Free Statistics

of Irreproducible Research!

Author's title

Author*Unverified author*
R Software Modulerwasp_autocorrelation.wasp
Title produced by software(Partial) Autocorrelation Function
Date of computationMon, 11 Jan 2016 19:07:16 +0000
Cite this page as followsStatistical Computations at FreeStatistics.org, Office for Research Development and Education, URL https://freestatistics.org/blog/index.php?v=date/2016/Jan/11/t1452539276tj4ifbdnhp84q72.htm/, Retrieved Wed, 08 May 2024 01:54:16 +0000
Statistical Computations at FreeStatistics.org, Office for Research Development and Education, URL https://freestatistics.org/blog/index.php?pk=289688, Retrieved Wed, 08 May 2024 01:54:16 +0000
QR Codes:

Original text written by user:
IsPrivate?No (this computation is public)
User-defined keywords
Estimated Impact55
Family? (F = Feedback message, R = changed R code, M = changed R Module, P = changed Parameters, D = changed Data)
-       [(Partial) Autocorrelation Function] [] [2016-01-11 19:07:16] [c7db9dbe56b0646da05788291b2eebd0] [Current]
Feedback Forum

Post a new message
Dataseries X:
99,1
98,9
98,8
98,8
99,2
99,6
100,5
100,6
100,7
101
101,3
101,5
102,3
103
102,9
103,5
103,8
103,6
103,4
103,4
103,3
103,2
103,2
103,5
104,5
105,7
106,5
107
106,7
107,1
106,1
106,2
106,5
106,8
107
107,2
107,8
107,9
107,9
108,2
108,9
109,1
109,3
109,8
109,8
109,9
109,9
109,9
108,8
108,5
108,8
108,8
108,8
108,9
108,8
108,4
107,7
107,3
107
107,7


Summary of computational transaction
Raw Inputview raw input (R code)
Raw Outputview raw output of R engine
Computing time1 seconds
R Server'Gertrude Mary Cox' @ cox.wessa.net

\begin{tabular}{lllllllll}
\hline
Summary of computational transaction \tabularnewline
Raw Input & view raw input (R code)  \tabularnewline
Raw Output & view raw output of R engine  \tabularnewline
Computing time & 1 seconds \tabularnewline
R Server & 'Gertrude Mary Cox' @ cox.wessa.net \tabularnewline
\hline
\end{tabular}
%Source: https://freestatistics.org/blog/index.php?pk=289688&T=0

[TABLE]
[ROW][C]Summary of computational transaction[/C][/ROW]
[ROW][C]Raw Input[/C][C]view raw input (R code) [/C][/ROW]
[ROW][C]Raw Output[/C][C]view raw output of R engine [/C][/ROW]
[ROW][C]Computing time[/C][C]1 seconds[/C][/ROW]
[ROW][C]R Server[/C][C]'Gertrude Mary Cox' @ cox.wessa.net[/C][/ROW]
[/TABLE]
Source: https://freestatistics.org/blog/index.php?pk=289688&T=0

Globally Unique Identifier (entire table): ba.freestatistics.org/blog/index.php?pk=289688&T=0

As an alternative you can also use a QR Code:  

The GUIDs for individual cells are displayed in the table below:

Summary of computational transaction
Raw Inputview raw input (R code)
Raw Outputview raw output of R engine
Computing time1 seconds
R Server'Gertrude Mary Cox' @ cox.wessa.net


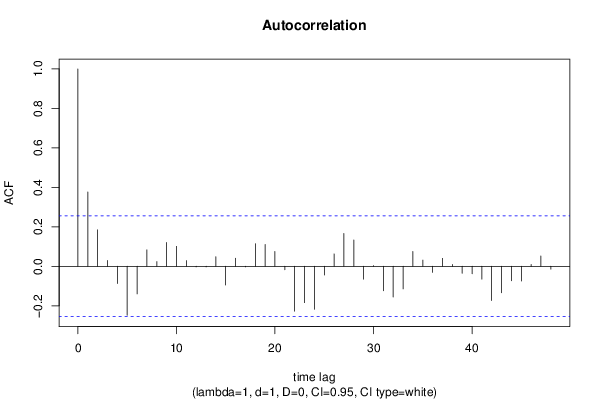
Autocorrelation Function
Time lag kACF(k)T-STATP-value
10.3764382.89150.00268
20.1844981.41720.080849
30.02930.22510.411356
4-0.086897-0.66750.253537
5-0.247762-1.90310.030955
6-0.139797-1.07380.143643
70.0832240.63930.262564
80.0238230.1830.427717
90.1205010.92560.179215
100.1008630.77470.220792
110.028680.22030.413202
12-0.003009-0.02310.490819
13-0.002937-0.02260.49104
140.0488870.37550.354314
15-0.095257-0.73170.23363
160.040920.31430.377196
17-0.002943-0.02260.49102
180.114520.87960.191311
190.1106530.84990.199397
200.0753990.57920.282346
21-0.017569-0.1350.446555
22-0.227119-1.74450.043137
23-0.184216-1.4150.081164
24-0.218022-1.67470.049647
25-0.044152-0.33910.367854
260.0628170.48250.315615
270.166191.27650.103385
280.1330071.02160.15556
29-0.065255-0.50120.309036
300.0033830.0260.489677
31-0.124148-0.95360.172088
32-0.155494-1.19440.118556
33-0.114584-0.88010.191178
340.0750570.57650.283228
350.0312240.23980.405643
36-0.031057-0.23860.406138
370.0403210.30970.378935
380.0089750.06890.472635
39-0.035309-0.27120.393587
40-0.037494-0.2880.387179
41-0.065244-0.50110.309067
42-0.17375-1.33460.093568
43-0.134023-1.02950.153735
44-0.073169-0.5620.288114
45-0.074934-0.57560.283544
460.009040.06940.472439
470.0522850.40160.344711
48-0.014309-0.10990.456426

\begin{tabular}{lllllllll}
\hline
Autocorrelation Function \tabularnewline
Time lag k & ACF(k) & T-STAT & P-value \tabularnewline
1 & 0.376438 & 2.8915 & 0.00268 \tabularnewline
2 & 0.184498 & 1.4172 & 0.080849 \tabularnewline
3 & 0.0293 & 0.2251 & 0.411356 \tabularnewline
4 & -0.086897 & -0.6675 & 0.253537 \tabularnewline
5 & -0.247762 & -1.9031 & 0.030955 \tabularnewline
6 & -0.139797 & -1.0738 & 0.143643 \tabularnewline
7 & 0.083224 & 0.6393 & 0.262564 \tabularnewline
8 & 0.023823 & 0.183 & 0.427717 \tabularnewline
9 & 0.120501 & 0.9256 & 0.179215 \tabularnewline
10 & 0.100863 & 0.7747 & 0.220792 \tabularnewline
11 & 0.02868 & 0.2203 & 0.413202 \tabularnewline
12 & -0.003009 & -0.0231 & 0.490819 \tabularnewline
13 & -0.002937 & -0.0226 & 0.49104 \tabularnewline
14 & 0.048887 & 0.3755 & 0.354314 \tabularnewline
15 & -0.095257 & -0.7317 & 0.23363 \tabularnewline
16 & 0.04092 & 0.3143 & 0.377196 \tabularnewline
17 & -0.002943 & -0.0226 & 0.49102 \tabularnewline
18 & 0.11452 & 0.8796 & 0.191311 \tabularnewline
19 & 0.110653 & 0.8499 & 0.199397 \tabularnewline
20 & 0.075399 & 0.5792 & 0.282346 \tabularnewline
21 & -0.017569 & -0.135 & 0.446555 \tabularnewline
22 & -0.227119 & -1.7445 & 0.043137 \tabularnewline
23 & -0.184216 & -1.415 & 0.081164 \tabularnewline
24 & -0.218022 & -1.6747 & 0.049647 \tabularnewline
25 & -0.044152 & -0.3391 & 0.367854 \tabularnewline
26 & 0.062817 & 0.4825 & 0.315615 \tabularnewline
27 & 0.16619 & 1.2765 & 0.103385 \tabularnewline
28 & 0.133007 & 1.0216 & 0.15556 \tabularnewline
29 & -0.065255 & -0.5012 & 0.309036 \tabularnewline
30 & 0.003383 & 0.026 & 0.489677 \tabularnewline
31 & -0.124148 & -0.9536 & 0.172088 \tabularnewline
32 & -0.155494 & -1.1944 & 0.118556 \tabularnewline
33 & -0.114584 & -0.8801 & 0.191178 \tabularnewline
34 & 0.075057 & 0.5765 & 0.283228 \tabularnewline
35 & 0.031224 & 0.2398 & 0.405643 \tabularnewline
36 & -0.031057 & -0.2386 & 0.406138 \tabularnewline
37 & 0.040321 & 0.3097 & 0.378935 \tabularnewline
38 & 0.008975 & 0.0689 & 0.472635 \tabularnewline
39 & -0.035309 & -0.2712 & 0.393587 \tabularnewline
40 & -0.037494 & -0.288 & 0.387179 \tabularnewline
41 & -0.065244 & -0.5011 & 0.309067 \tabularnewline
42 & -0.17375 & -1.3346 & 0.093568 \tabularnewline
43 & -0.134023 & -1.0295 & 0.153735 \tabularnewline
44 & -0.073169 & -0.562 & 0.288114 \tabularnewline
45 & -0.074934 & -0.5756 & 0.283544 \tabularnewline
46 & 0.00904 & 0.0694 & 0.472439 \tabularnewline
47 & 0.052285 & 0.4016 & 0.344711 \tabularnewline
48 & -0.014309 & -0.1099 & 0.456426 \tabularnewline
\hline
\end{tabular}
%Source: https://freestatistics.org/blog/index.php?pk=289688&T=1

[TABLE]
[ROW][C]Autocorrelation Function[/C][/ROW]
[ROW][C]Time lag k[/C][C]ACF(k)[/C][C]T-STAT[/C][C]P-value[/C][/ROW]
[ROW][C]1[/C][C]0.376438[/C][C]2.8915[/C][C]0.00268[/C][/ROW]
[ROW][C]2[/C][C]0.184498[/C][C]1.4172[/C][C]0.080849[/C][/ROW]
[ROW][C]3[/C][C]0.0293[/C][C]0.2251[/C][C]0.411356[/C][/ROW]
[ROW][C]4[/C][C]-0.086897[/C][C]-0.6675[/C][C]0.253537[/C][/ROW]
[ROW][C]5[/C][C]-0.247762[/C][C]-1.9031[/C][C]0.030955[/C][/ROW]
[ROW][C]6[/C][C]-0.139797[/C][C]-1.0738[/C][C]0.143643[/C][/ROW]
[ROW][C]7[/C][C]0.083224[/C][C]0.6393[/C][C]0.262564[/C][/ROW]
[ROW][C]8[/C][C]0.023823[/C][C]0.183[/C][C]0.427717[/C][/ROW]
[ROW][C]9[/C][C]0.120501[/C][C]0.9256[/C][C]0.179215[/C][/ROW]
[ROW][C]10[/C][C]0.100863[/C][C]0.7747[/C][C]0.220792[/C][/ROW]
[ROW][C]11[/C][C]0.02868[/C][C]0.2203[/C][C]0.413202[/C][/ROW]
[ROW][C]12[/C][C]-0.003009[/C][C]-0.0231[/C][C]0.490819[/C][/ROW]
[ROW][C]13[/C][C]-0.002937[/C][C]-0.0226[/C][C]0.49104[/C][/ROW]
[ROW][C]14[/C][C]0.048887[/C][C]0.3755[/C][C]0.354314[/C][/ROW]
[ROW][C]15[/C][C]-0.095257[/C][C]-0.7317[/C][C]0.23363[/C][/ROW]
[ROW][C]16[/C][C]0.04092[/C][C]0.3143[/C][C]0.377196[/C][/ROW]
[ROW][C]17[/C][C]-0.002943[/C][C]-0.0226[/C][C]0.49102[/C][/ROW]
[ROW][C]18[/C][C]0.11452[/C][C]0.8796[/C][C]0.191311[/C][/ROW]
[ROW][C]19[/C][C]0.110653[/C][C]0.8499[/C][C]0.199397[/C][/ROW]
[ROW][C]20[/C][C]0.075399[/C][C]0.5792[/C][C]0.282346[/C][/ROW]
[ROW][C]21[/C][C]-0.017569[/C][C]-0.135[/C][C]0.446555[/C][/ROW]
[ROW][C]22[/C][C]-0.227119[/C][C]-1.7445[/C][C]0.043137[/C][/ROW]
[ROW][C]23[/C][C]-0.184216[/C][C]-1.415[/C][C]0.081164[/C][/ROW]
[ROW][C]24[/C][C]-0.218022[/C][C]-1.6747[/C][C]0.049647[/C][/ROW]
[ROW][C]25[/C][C]-0.044152[/C][C]-0.3391[/C][C]0.367854[/C][/ROW]
[ROW][C]26[/C][C]0.062817[/C][C]0.4825[/C][C]0.315615[/C][/ROW]
[ROW][C]27[/C][C]0.16619[/C][C]1.2765[/C][C]0.103385[/C][/ROW]
[ROW][C]28[/C][C]0.133007[/C][C]1.0216[/C][C]0.15556[/C][/ROW]
[ROW][C]29[/C][C]-0.065255[/C][C]-0.5012[/C][C]0.309036[/C][/ROW]
[ROW][C]30[/C][C]0.003383[/C][C]0.026[/C][C]0.489677[/C][/ROW]
[ROW][C]31[/C][C]-0.124148[/C][C]-0.9536[/C][C]0.172088[/C][/ROW]
[ROW][C]32[/C][C]-0.155494[/C][C]-1.1944[/C][C]0.118556[/C][/ROW]
[ROW][C]33[/C][C]-0.114584[/C][C]-0.8801[/C][C]0.191178[/C][/ROW]
[ROW][C]34[/C][C]0.075057[/C][C]0.5765[/C][C]0.283228[/C][/ROW]
[ROW][C]35[/C][C]0.031224[/C][C]0.2398[/C][C]0.405643[/C][/ROW]
[ROW][C]36[/C][C]-0.031057[/C][C]-0.2386[/C][C]0.406138[/C][/ROW]
[ROW][C]37[/C][C]0.040321[/C][C]0.3097[/C][C]0.378935[/C][/ROW]
[ROW][C]38[/C][C]0.008975[/C][C]0.0689[/C][C]0.472635[/C][/ROW]
[ROW][C]39[/C][C]-0.035309[/C][C]-0.2712[/C][C]0.393587[/C][/ROW]
[ROW][C]40[/C][C]-0.037494[/C][C]-0.288[/C][C]0.387179[/C][/ROW]
[ROW][C]41[/C][C]-0.065244[/C][C]-0.5011[/C][C]0.309067[/C][/ROW]
[ROW][C]42[/C][C]-0.17375[/C][C]-1.3346[/C][C]0.093568[/C][/ROW]
[ROW][C]43[/C][C]-0.134023[/C][C]-1.0295[/C][C]0.153735[/C][/ROW]
[ROW][C]44[/C][C]-0.073169[/C][C]-0.562[/C][C]0.288114[/C][/ROW]
[ROW][C]45[/C][C]-0.074934[/C][C]-0.5756[/C][C]0.283544[/C][/ROW]
[ROW][C]46[/C][C]0.00904[/C][C]0.0694[/C][C]0.472439[/C][/ROW]
[ROW][C]47[/C][C]0.052285[/C][C]0.4016[/C][C]0.344711[/C][/ROW]
[ROW][C]48[/C][C]-0.014309[/C][C]-0.1099[/C][C]0.456426[/C][/ROW]
[/TABLE]
Source: https://freestatistics.org/blog/index.php?pk=289688&T=1

Globally Unique Identifier (entire table): ba.freestatistics.org/blog/index.php?pk=289688&T=1

As an alternative you can also use a QR Code:  

The GUIDs for individual cells are displayed in the table below:

Autocorrelation Function
Time lag kACF(k)T-STATP-value
10.3764382.89150.00268
20.1844981.41720.080849
30.02930.22510.411356
4-0.086897-0.66750.253537
5-0.247762-1.90310.030955
6-0.139797-1.07380.143643
70.0832240.63930.262564
80.0238230.1830.427717
90.1205010.92560.179215
100.1008630.77470.220792
110.028680.22030.413202
12-0.003009-0.02310.490819
13-0.002937-0.02260.49104
140.0488870.37550.354314
15-0.095257-0.73170.23363
160.040920.31430.377196
17-0.002943-0.02260.49102
180.114520.87960.191311
190.1106530.84990.199397
200.0753990.57920.282346
21-0.017569-0.1350.446555
22-0.227119-1.74450.043137
23-0.184216-1.4150.081164
24-0.218022-1.67470.049647
25-0.044152-0.33910.367854
260.0628170.48250.315615
270.166191.27650.103385
280.1330071.02160.15556
29-0.065255-0.50120.309036
300.0033830.0260.489677
31-0.124148-0.95360.172088
32-0.155494-1.19440.118556
33-0.114584-0.88010.191178
340.0750570.57650.283228
350.0312240.23980.405643
36-0.031057-0.23860.406138
370.0403210.30970.378935
380.0089750.06890.472635
39-0.035309-0.27120.393587
40-0.037494-0.2880.387179
41-0.065244-0.50110.309067
42-0.17375-1.33460.093568
43-0.134023-1.02950.153735
44-0.073169-0.5620.288114
45-0.074934-0.57560.283544
460.009040.06940.472439
470.0522850.40160.344711
48-0.014309-0.10990.456426


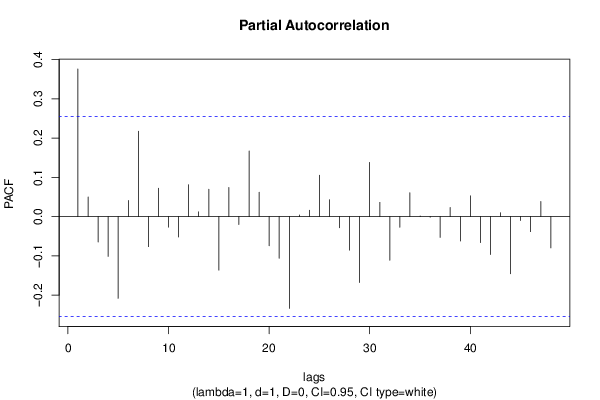
Partial Autocorrelation Function
Time lag kPACF(k)T-STATP-value
10.3764382.89150.00268
20.0498570.3830.351564
3-0.064775-0.49750.310328
4-0.10153-0.77990.219294
5-0.20849-1.60140.05731
60.0410680.31540.376767
70.2174861.67050.050055
8-0.07658-0.58820.279314
90.0724540.55650.289978
10-0.026902-0.20660.418503
11-0.051902-0.39870.345789
120.0813490.62490.267238
130.0121230.09310.463061
140.0698960.53690.296684
15-0.136633-1.04950.149114
160.0740530.56880.285823
17-0.020029-0.15380.439129
180.1672421.28460.101974
190.0618740.47530.318176
20-0.074498-0.57220.28467
21-0.106147-0.81530.209082
22-0.234047-1.79770.038667
230.0039160.03010.488052
240.0162980.12520.450399
250.1053970.80960.210721
260.0429450.32990.371334
27-0.028395-0.21810.41405
28-0.085583-0.65740.256747
29-0.168106-1.29120.100827
300.1381611.06120.146454
310.0362290.27830.390884
32-0.111542-0.85680.197518
33-0.027096-0.20810.417924
340.060830.46720.321024
350.0014080.01080.495704
36-0.001524-0.01170.495351
37-0.053119-0.4080.342369
380.0231490.17780.429741
39-0.062384-0.47920.316791
400.0528880.40620.343018
41-0.066338-0.50950.306134
42-0.096709-0.74280.230265
430.0097680.0750.470224
44-0.145742-1.11950.133739
45-0.009904-0.07610.46981
46-0.038378-0.29480.384595
470.0383310.29440.384734
48-0.079818-0.61310.271086

\begin{tabular}{lllllllll}
\hline
Partial Autocorrelation Function \tabularnewline
Time lag k & PACF(k) & T-STAT & P-value \tabularnewline
1 & 0.376438 & 2.8915 & 0.00268 \tabularnewline
2 & 0.049857 & 0.383 & 0.351564 \tabularnewline
3 & -0.064775 & -0.4975 & 0.310328 \tabularnewline
4 & -0.10153 & -0.7799 & 0.219294 \tabularnewline
5 & -0.20849 & -1.6014 & 0.05731 \tabularnewline
6 & 0.041068 & 0.3154 & 0.376767 \tabularnewline
7 & 0.217486 & 1.6705 & 0.050055 \tabularnewline
8 & -0.07658 & -0.5882 & 0.279314 \tabularnewline
9 & 0.072454 & 0.5565 & 0.289978 \tabularnewline
10 & -0.026902 & -0.2066 & 0.418503 \tabularnewline
11 & -0.051902 & -0.3987 & 0.345789 \tabularnewline
12 & 0.081349 & 0.6249 & 0.267238 \tabularnewline
13 & 0.012123 & 0.0931 & 0.463061 \tabularnewline
14 & 0.069896 & 0.5369 & 0.296684 \tabularnewline
15 & -0.136633 & -1.0495 & 0.149114 \tabularnewline
16 & 0.074053 & 0.5688 & 0.285823 \tabularnewline
17 & -0.020029 & -0.1538 & 0.439129 \tabularnewline
18 & 0.167242 & 1.2846 & 0.101974 \tabularnewline
19 & 0.061874 & 0.4753 & 0.318176 \tabularnewline
20 & -0.074498 & -0.5722 & 0.28467 \tabularnewline
21 & -0.106147 & -0.8153 & 0.209082 \tabularnewline
22 & -0.234047 & -1.7977 & 0.038667 \tabularnewline
23 & 0.003916 & 0.0301 & 0.488052 \tabularnewline
24 & 0.016298 & 0.1252 & 0.450399 \tabularnewline
25 & 0.105397 & 0.8096 & 0.210721 \tabularnewline
26 & 0.042945 & 0.3299 & 0.371334 \tabularnewline
27 & -0.028395 & -0.2181 & 0.41405 \tabularnewline
28 & -0.085583 & -0.6574 & 0.256747 \tabularnewline
29 & -0.168106 & -1.2912 & 0.100827 \tabularnewline
30 & 0.138161 & 1.0612 & 0.146454 \tabularnewline
31 & 0.036229 & 0.2783 & 0.390884 \tabularnewline
32 & -0.111542 & -0.8568 & 0.197518 \tabularnewline
33 & -0.027096 & -0.2081 & 0.417924 \tabularnewline
34 & 0.06083 & 0.4672 & 0.321024 \tabularnewline
35 & 0.001408 & 0.0108 & 0.495704 \tabularnewline
36 & -0.001524 & -0.0117 & 0.495351 \tabularnewline
37 & -0.053119 & -0.408 & 0.342369 \tabularnewline
38 & 0.023149 & 0.1778 & 0.429741 \tabularnewline
39 & -0.062384 & -0.4792 & 0.316791 \tabularnewline
40 & 0.052888 & 0.4062 & 0.343018 \tabularnewline
41 & -0.066338 & -0.5095 & 0.306134 \tabularnewline
42 & -0.096709 & -0.7428 & 0.230265 \tabularnewline
43 & 0.009768 & 0.075 & 0.470224 \tabularnewline
44 & -0.145742 & -1.1195 & 0.133739 \tabularnewline
45 & -0.009904 & -0.0761 & 0.46981 \tabularnewline
46 & -0.038378 & -0.2948 & 0.384595 \tabularnewline
47 & 0.038331 & 0.2944 & 0.384734 \tabularnewline
48 & -0.079818 & -0.6131 & 0.271086 \tabularnewline
\hline
\end{tabular}
%Source: https://freestatistics.org/blog/index.php?pk=289688&T=2

[TABLE]
[ROW][C]Partial Autocorrelation Function[/C][/ROW]
[ROW][C]Time lag k[/C][C]PACF(k)[/C][C]T-STAT[/C][C]P-value[/C][/ROW]
[ROW][C]1[/C][C]0.376438[/C][C]2.8915[/C][C]0.00268[/C][/ROW]
[ROW][C]2[/C][C]0.049857[/C][C]0.383[/C][C]0.351564[/C][/ROW]
[ROW][C]3[/C][C]-0.064775[/C][C]-0.4975[/C][C]0.310328[/C][/ROW]
[ROW][C]4[/C][C]-0.10153[/C][C]-0.7799[/C][C]0.219294[/C][/ROW]
[ROW][C]5[/C][C]-0.20849[/C][C]-1.6014[/C][C]0.05731[/C][/ROW]
[ROW][C]6[/C][C]0.041068[/C][C]0.3154[/C][C]0.376767[/C][/ROW]
[ROW][C]7[/C][C]0.217486[/C][C]1.6705[/C][C]0.050055[/C][/ROW]
[ROW][C]8[/C][C]-0.07658[/C][C]-0.5882[/C][C]0.279314[/C][/ROW]
[ROW][C]9[/C][C]0.072454[/C][C]0.5565[/C][C]0.289978[/C][/ROW]
[ROW][C]10[/C][C]-0.026902[/C][C]-0.2066[/C][C]0.418503[/C][/ROW]
[ROW][C]11[/C][C]-0.051902[/C][C]-0.3987[/C][C]0.345789[/C][/ROW]
[ROW][C]12[/C][C]0.081349[/C][C]0.6249[/C][C]0.267238[/C][/ROW]
[ROW][C]13[/C][C]0.012123[/C][C]0.0931[/C][C]0.463061[/C][/ROW]
[ROW][C]14[/C][C]0.069896[/C][C]0.5369[/C][C]0.296684[/C][/ROW]
[ROW][C]15[/C][C]-0.136633[/C][C]-1.0495[/C][C]0.149114[/C][/ROW]
[ROW][C]16[/C][C]0.074053[/C][C]0.5688[/C][C]0.285823[/C][/ROW]
[ROW][C]17[/C][C]-0.020029[/C][C]-0.1538[/C][C]0.439129[/C][/ROW]
[ROW][C]18[/C][C]0.167242[/C][C]1.2846[/C][C]0.101974[/C][/ROW]
[ROW][C]19[/C][C]0.061874[/C][C]0.4753[/C][C]0.318176[/C][/ROW]
[ROW][C]20[/C][C]-0.074498[/C][C]-0.5722[/C][C]0.28467[/C][/ROW]
[ROW][C]21[/C][C]-0.106147[/C][C]-0.8153[/C][C]0.209082[/C][/ROW]
[ROW][C]22[/C][C]-0.234047[/C][C]-1.7977[/C][C]0.038667[/C][/ROW]
[ROW][C]23[/C][C]0.003916[/C][C]0.0301[/C][C]0.488052[/C][/ROW]
[ROW][C]24[/C][C]0.016298[/C][C]0.1252[/C][C]0.450399[/C][/ROW]
[ROW][C]25[/C][C]0.105397[/C][C]0.8096[/C][C]0.210721[/C][/ROW]
[ROW][C]26[/C][C]0.042945[/C][C]0.3299[/C][C]0.371334[/C][/ROW]
[ROW][C]27[/C][C]-0.028395[/C][C]-0.2181[/C][C]0.41405[/C][/ROW]
[ROW][C]28[/C][C]-0.085583[/C][C]-0.6574[/C][C]0.256747[/C][/ROW]
[ROW][C]29[/C][C]-0.168106[/C][C]-1.2912[/C][C]0.100827[/C][/ROW]
[ROW][C]30[/C][C]0.138161[/C][C]1.0612[/C][C]0.146454[/C][/ROW]
[ROW][C]31[/C][C]0.036229[/C][C]0.2783[/C][C]0.390884[/C][/ROW]
[ROW][C]32[/C][C]-0.111542[/C][C]-0.8568[/C][C]0.197518[/C][/ROW]
[ROW][C]33[/C][C]-0.027096[/C][C]-0.2081[/C][C]0.417924[/C][/ROW]
[ROW][C]34[/C][C]0.06083[/C][C]0.4672[/C][C]0.321024[/C][/ROW]
[ROW][C]35[/C][C]0.001408[/C][C]0.0108[/C][C]0.495704[/C][/ROW]
[ROW][C]36[/C][C]-0.001524[/C][C]-0.0117[/C][C]0.495351[/C][/ROW]
[ROW][C]37[/C][C]-0.053119[/C][C]-0.408[/C][C]0.342369[/C][/ROW]
[ROW][C]38[/C][C]0.023149[/C][C]0.1778[/C][C]0.429741[/C][/ROW]
[ROW][C]39[/C][C]-0.062384[/C][C]-0.4792[/C][C]0.316791[/C][/ROW]
[ROW][C]40[/C][C]0.052888[/C][C]0.4062[/C][C]0.343018[/C][/ROW]
[ROW][C]41[/C][C]-0.066338[/C][C]-0.5095[/C][C]0.306134[/C][/ROW]
[ROW][C]42[/C][C]-0.096709[/C][C]-0.7428[/C][C]0.230265[/C][/ROW]
[ROW][C]43[/C][C]0.009768[/C][C]0.075[/C][C]0.470224[/C][/ROW]
[ROW][C]44[/C][C]-0.145742[/C][C]-1.1195[/C][C]0.133739[/C][/ROW]
[ROW][C]45[/C][C]-0.009904[/C][C]-0.0761[/C][C]0.46981[/C][/ROW]
[ROW][C]46[/C][C]-0.038378[/C][C]-0.2948[/C][C]0.384595[/C][/ROW]
[ROW][C]47[/C][C]0.038331[/C][C]0.2944[/C][C]0.384734[/C][/ROW]
[ROW][C]48[/C][C]-0.079818[/C][C]-0.6131[/C][C]0.271086[/C][/ROW]
[/TABLE]
Source: https://freestatistics.org/blog/index.php?pk=289688&T=2

Globally Unique Identifier (entire table): ba.freestatistics.org/blog/index.php?pk=289688&T=2

As an alternative you can also use a QR Code:  

The GUIDs for individual cells are displayed in the table below:

Partial Autocorrelation Function
Time lag kPACF(k)T-STATP-value
10.3764382.89150.00268
20.0498570.3830.351564
3-0.064775-0.49750.310328
4-0.10153-0.77990.219294
5-0.20849-1.60140.05731
60.0410680.31540.376767
70.2174861.67050.050055
8-0.07658-0.58820.279314
90.0724540.55650.289978
10-0.026902-0.20660.418503
11-0.051902-0.39870.345789
120.0813490.62490.267238
130.0121230.09310.463061
140.0698960.53690.296684
15-0.136633-1.04950.149114
160.0740530.56880.285823
17-0.020029-0.15380.439129
180.1672421.28460.101974
190.0618740.47530.318176
20-0.074498-0.57220.28467
21-0.106147-0.81530.209082
22-0.234047-1.79770.038667
230.0039160.03010.488052
240.0162980.12520.450399
250.1053970.80960.210721
260.0429450.32990.371334
27-0.028395-0.21810.41405
28-0.085583-0.65740.256747
29-0.168106-1.29120.100827
300.1381611.06120.146454
310.0362290.27830.390884
32-0.111542-0.85680.197518
33-0.027096-0.20810.417924
340.060830.46720.321024
350.0014080.01080.495704
36-0.001524-0.01170.495351
37-0.053119-0.4080.342369
380.0231490.17780.429741
39-0.062384-0.47920.316791
400.0528880.40620.343018
41-0.066338-0.50950.306134
42-0.096709-0.74280.230265
430.0097680.0750.470224
44-0.145742-1.11950.133739
45-0.009904-0.07610.46981
46-0.038378-0.29480.384595
470.0383310.29440.384734
48-0.079818-0.61310.271086


Parameters (Session):
par1 = 48 ; par2 = 1 ; par3 = 1 ; par4 = 0 ; par5 = 12 ; par6 = White Noise ; par7 = 0.95 ;
Parameters (R input):
par1 = 48 ; par2 = 1 ; par3 = 1 ; par4 = 0 ; par5 = 12 ; par6 = White Noise ; par7 = 0.95 ; par8 = ;
R code (references can be found in the software module):
if (par1 == 'Default') {
par1 = 10*log10(length(x))
} else {
par1 <- as.numeric(par1)
}
par2 <- as.numeric(par2)
par3 <- as.numeric(par3)
par4 <- as.numeric(par4)
par5 <- as.numeric(par5)
if (par6 == 'White Noise') par6 <- 'white' else par6 <- 'ma'
par7 <- as.numeric(par7)
if (par8 != '') par8 <- as.numeric(par8)
x <- na.omit(x)
ox <- x
if (par8 == '') {
if (par2 == 0) {
x <- log(x)
} else {
x <- (x ^ par2 - 1) / par2
}
} else {
x <- log(x,base=par8)
}
if (par3 > 0) x <- diff(x,lag=1,difference=par3)
if (par4 > 0) x <- diff(x,lag=par5,difference=par4)
bitmap(file='picts.png')
op <- par(mfrow=c(2,1))
plot(ox,type='l',main='Original Time Series',xlab='time',ylab='value')
if (par8=='') {
mytitle <- paste('Working Time Series (lambda=',par2,', d=',par3,', D=',par4,')',sep='')
mysub <- paste('(lambda=',par2,', d=',par3,', D=',par4,', CI=', par7, ', CI type=',par6,')',sep='')
} else {
mytitle <- paste('Working Time Series (base=',par8,', d=',par3,', D=',par4,')',sep='')
mysub <- paste('(base=',par8,', d=',par3,', D=',par4,', CI=', par7, ', CI type=',par6,')',sep='')
}
plot(x,type='l', main=mytitle,xlab='time',ylab='value')
par(op)
dev.off()
bitmap(file='pic1.png')
racf <- acf(x, par1, main='Autocorrelation', xlab='time lag', ylab='ACF', ci.type=par6, ci=par7, sub=mysub)
dev.off()
bitmap(file='pic2.png')
rpacf <- pacf(x,par1,main='Partial Autocorrelation',xlab='lags',ylab='PACF',sub=mysub)
dev.off()
(myacf <- c(racf$acf))
(mypacf <- c(rpacf$acf))
lengthx <- length(x)
sqrtn <- sqrt(lengthx)
load(file='createtable')
a<-table.start()
a<-table.row.start(a)
a<-table.element(a,'Autocorrelation Function',4,TRUE)
a<-table.row.end(a)
a<-table.row.start(a)
a<-table.element(a,'Time lag k',header=TRUE)
a<-table.element(a,hyperlink('basics.htm','ACF(k)','click here for more information about the Autocorrelation Function'),header=TRUE)
a<-table.element(a,'T-STAT',header=TRUE)
a<-table.element(a,'P-value',header=TRUE)
a<-table.row.end(a)
for (i in 2:(par1+1)) {
a<-table.row.start(a)
a<-table.element(a,i-1,header=TRUE)
a<-table.element(a,round(myacf[i],6))
mytstat <- myacf[i]*sqrtn
a<-table.element(a,round(mytstat,4))
a<-table.element(a,round(1-pt(abs(mytstat),lengthx),6))
a<-table.row.end(a)
}
a<-table.end(a)
table.save(a,file='mytable.tab')
a<-table.start()
a<-table.row.start(a)
a<-table.element(a,'Partial Autocorrelation Function',4,TRUE)
a<-table.row.end(a)
a<-table.row.start(a)
a<-table.element(a,'Time lag k',header=TRUE)
a<-table.element(a,hyperlink('basics.htm','PACF(k)','click here for more information about the Partial Autocorrelation Function'),header=TRUE)
a<-table.element(a,'T-STAT',header=TRUE)
a<-table.element(a,'P-value',header=TRUE)
a<-table.row.end(a)
for (i in 1:par1) {
a<-table.row.start(a)
a<-table.element(a,i,header=TRUE)
a<-table.element(a,round(mypacf[i],6))
mytstat <- mypacf[i]*sqrtn
a<-table.element(a,round(mytstat,4))
a<-table.element(a,round(1-pt(abs(mytstat),lengthx),6))
a<-table.row.end(a)
}
a<-table.end(a)
table.save(a,file='mytable1.tab')