Free Statistics

of Irreproducible Research!

Author's title

Author*Unverified author*
R Software Modulerwasp_autocorrelation.wasp
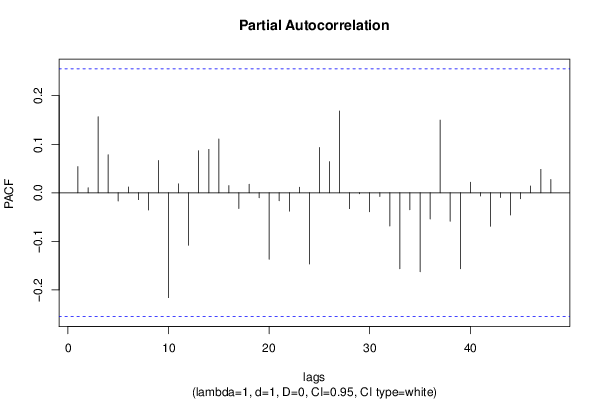
Title produced by software(Partial) Autocorrelation Function
Date of computationMon, 11 Jan 2016 20:12:44 +0000
Cite this page as followsStatistical Computations at FreeStatistics.org, Office for Research Development and Education, URL https://freestatistics.org/blog/index.php?v=date/2016/Jan/11/t1452543228uz3nu9c8v0qwus9.htm/, Retrieved Tue, 07 May 2024 21:48:06 +0000
Statistical Computations at FreeStatistics.org, Office for Research Development and Education, URL https://freestatistics.org/blog/index.php?pk=289699, Retrieved Tue, 07 May 2024 21:48:06 +0000
QR Codes:

Original text written by user:
IsPrivate?No (this computation is public)
User-defined keywords
Estimated Impact107
Family? (F = Feedback message, R = changed R code, M = changed R Module, P = changed Parameters, D = changed Data)
-     [(Partial) Autocorrelation Function] [] [2015-10-22 13:20:01] [a642a7d7b5f7c65c232df2d499025a08]
- R  D    [(Partial) Autocorrelation Function] [] [2016-01-11 20:12:44] [c6ba03d4d421ca9ab835e2907c34aa87] [Current]
Feedback Forum

Post a new message
Dataseries X:
99,2
99,1
99,1
99,1
99,1
99,1
99,9
100
100
101,3
102
102
102,4
103
103
103,6
103,6
103,6
103,6
103,6
103,9
104
104
104
104,9
105,1
105,2
105,5
105,7
105,7
105,7
105,7
105,7
105,8
105,8
105,8
106,6
107
107,2
107,3
107,3
107,3
107,4
107,4
107,4
107,4
107,5
107,5
105
105,2
105,2
105,3
105,3
105,3
105,3
105,3
105,3
105,3
106,1
106,1


Summary of computational transaction
Raw Inputview raw input (R code)
Raw Outputview raw output of R engine
Computing time1 seconds
R Server'Sir Ronald Aylmer Fisher' @ fisher.wessa.net

\begin{tabular}{lllllllll}
\hline
Summary of computational transaction \tabularnewline
Raw Input & view raw input (R code)  \tabularnewline
Raw Output & view raw output of R engine  \tabularnewline
Computing time & 1 seconds \tabularnewline
R Server & 'Sir Ronald Aylmer Fisher' @ fisher.wessa.net \tabularnewline
\hline
\end{tabular}
%Source: https://freestatistics.org/blog/index.php?pk=289699&T=0

[TABLE]
[ROW][C]Summary of computational transaction[/C][/ROW]
[ROW][C]Raw Input[/C][C]view raw input (R code) [/C][/ROW]
[ROW][C]Raw Output[/C][C]view raw output of R engine [/C][/ROW]
[ROW][C]Computing time[/C][C]1 seconds[/C][/ROW]
[ROW][C]R Server[/C][C]'Sir Ronald Aylmer Fisher' @ fisher.wessa.net[/C][/ROW]
[/TABLE]
Source: https://freestatistics.org/blog/index.php?pk=289699&T=0

Globally Unique Identifier (entire table): ba.freestatistics.org/blog/index.php?pk=289699&T=0

As an alternative you can also use a QR Code:  

The GUIDs for individual cells are displayed in the table below:

Summary of computational transaction
Raw Inputview raw input (R code)
Raw Outputview raw output of R engine
Computing time1 seconds
R Server'Sir Ronald Aylmer Fisher' @ fisher.wessa.net


Autocorrelation Function
Time lag kACF(k)T-STATP-value
10.0539350.41430.340084
20.0133270.10240.459408
30.1576481.21090.115377
40.0930560.71480.238783
5-0.006214-0.04770.481046
60.0360660.2770.391363
70.0147530.11330.45508
8-0.030385-0.23340.408132
90.0668870.51380.304667
10-0.198004-1.52090.066814
11-0.013642-0.10480.458449
12-0.084628-0.650.259094
130.0182630.14030.444457
140.0502360.38590.35049
150.0854630.65650.257042
160.0115670.08880.464751
17-0.007352-0.05650.47758
180.0711410.54640.293411
19-0.012905-0.09910.460687
20-0.071147-0.54650.293396
21-0.020423-0.15690.437942
220.0269180.20680.418453
23-0.042175-0.3240.373559
24-0.159308-1.22370.112971
250.0106750.0820.467464
260.0257320.19760.422
270.0784340.60250.274587
28-0.038312-0.29430.38479
290.011280.08660.465624
300.0515680.39610.346731
310.0208080.15980.436782
32-0.00882-0.06770.473108
33-0.122741-0.94280.174816
340.0420230.32280.373999
35-0.164378-1.26260.105849
36-0.075979-0.58360.280854
370.0097090.07460.470401
38-0.135793-1.0430.15059
39-0.270301-2.07620.02112
400.0190840.14660.44198
41-0.026901-0.20660.418506
42-0.167472-1.28640.101668
430.0419770.32240.374134
44-0.012466-0.09580.462021
450.0379860.29180.385742
460.0183640.14110.444151
470.0172220.13230.447605
480.0198210.15220.439755

\begin{tabular}{lllllllll}
\hline
Autocorrelation Function \tabularnewline
Time lag k & ACF(k) & T-STAT & P-value \tabularnewline
1 & 0.053935 & 0.4143 & 0.340084 \tabularnewline
2 & 0.013327 & 0.1024 & 0.459408 \tabularnewline
3 & 0.157648 & 1.2109 & 0.115377 \tabularnewline
4 & 0.093056 & 0.7148 & 0.238783 \tabularnewline
5 & -0.006214 & -0.0477 & 0.481046 \tabularnewline
6 & 0.036066 & 0.277 & 0.391363 \tabularnewline
7 & 0.014753 & 0.1133 & 0.45508 \tabularnewline
8 & -0.030385 & -0.2334 & 0.408132 \tabularnewline
9 & 0.066887 & 0.5138 & 0.304667 \tabularnewline
10 & -0.198004 & -1.5209 & 0.066814 \tabularnewline
11 & -0.013642 & -0.1048 & 0.458449 \tabularnewline
12 & -0.084628 & -0.65 & 0.259094 \tabularnewline
13 & 0.018263 & 0.1403 & 0.444457 \tabularnewline
14 & 0.050236 & 0.3859 & 0.35049 \tabularnewline
15 & 0.085463 & 0.6565 & 0.257042 \tabularnewline
16 & 0.011567 & 0.0888 & 0.464751 \tabularnewline
17 & -0.007352 & -0.0565 & 0.47758 \tabularnewline
18 & 0.071141 & 0.5464 & 0.293411 \tabularnewline
19 & -0.012905 & -0.0991 & 0.460687 \tabularnewline
20 & -0.071147 & -0.5465 & 0.293396 \tabularnewline
21 & -0.020423 & -0.1569 & 0.437942 \tabularnewline
22 & 0.026918 & 0.2068 & 0.418453 \tabularnewline
23 & -0.042175 & -0.324 & 0.373559 \tabularnewline
24 & -0.159308 & -1.2237 & 0.112971 \tabularnewline
25 & 0.010675 & 0.082 & 0.467464 \tabularnewline
26 & 0.025732 & 0.1976 & 0.422 \tabularnewline
27 & 0.078434 & 0.6025 & 0.274587 \tabularnewline
28 & -0.038312 & -0.2943 & 0.38479 \tabularnewline
29 & 0.01128 & 0.0866 & 0.465624 \tabularnewline
30 & 0.051568 & 0.3961 & 0.346731 \tabularnewline
31 & 0.020808 & 0.1598 & 0.436782 \tabularnewline
32 & -0.00882 & -0.0677 & 0.473108 \tabularnewline
33 & -0.122741 & -0.9428 & 0.174816 \tabularnewline
34 & 0.042023 & 0.3228 & 0.373999 \tabularnewline
35 & -0.164378 & -1.2626 & 0.105849 \tabularnewline
36 & -0.075979 & -0.5836 & 0.280854 \tabularnewline
37 & 0.009709 & 0.0746 & 0.470401 \tabularnewline
38 & -0.135793 & -1.043 & 0.15059 \tabularnewline
39 & -0.270301 & -2.0762 & 0.02112 \tabularnewline
40 & 0.019084 & 0.1466 & 0.44198 \tabularnewline
41 & -0.026901 & -0.2066 & 0.418506 \tabularnewline
42 & -0.167472 & -1.2864 & 0.101668 \tabularnewline
43 & 0.041977 & 0.3224 & 0.374134 \tabularnewline
44 & -0.012466 & -0.0958 & 0.462021 \tabularnewline
45 & 0.037986 & 0.2918 & 0.385742 \tabularnewline
46 & 0.018364 & 0.1411 & 0.444151 \tabularnewline
47 & 0.017222 & 0.1323 & 0.447605 \tabularnewline
48 & 0.019821 & 0.1522 & 0.439755 \tabularnewline
\hline
\end{tabular}
%Source: https://freestatistics.org/blog/index.php?pk=289699&T=1

[TABLE]
[ROW][C]Autocorrelation Function[/C][/ROW]
[ROW][C]Time lag k[/C][C]ACF(k)[/C][C]T-STAT[/C][C]P-value[/C][/ROW]
[ROW][C]1[/C][C]0.053935[/C][C]0.4143[/C][C]0.340084[/C][/ROW]
[ROW][C]2[/C][C]0.013327[/C][C]0.1024[/C][C]0.459408[/C][/ROW]
[ROW][C]3[/C][C]0.157648[/C][C]1.2109[/C][C]0.115377[/C][/ROW]
[ROW][C]4[/C][C]0.093056[/C][C]0.7148[/C][C]0.238783[/C][/ROW]
[ROW][C]5[/C][C]-0.006214[/C][C]-0.0477[/C][C]0.481046[/C][/ROW]
[ROW][C]6[/C][C]0.036066[/C][C]0.277[/C][C]0.391363[/C][/ROW]
[ROW][C]7[/C][C]0.014753[/C][C]0.1133[/C][C]0.45508[/C][/ROW]
[ROW][C]8[/C][C]-0.030385[/C][C]-0.2334[/C][C]0.408132[/C][/ROW]
[ROW][C]9[/C][C]0.066887[/C][C]0.5138[/C][C]0.304667[/C][/ROW]
[ROW][C]10[/C][C]-0.198004[/C][C]-1.5209[/C][C]0.066814[/C][/ROW]
[ROW][C]11[/C][C]-0.013642[/C][C]-0.1048[/C][C]0.458449[/C][/ROW]
[ROW][C]12[/C][C]-0.084628[/C][C]-0.65[/C][C]0.259094[/C][/ROW]
[ROW][C]13[/C][C]0.018263[/C][C]0.1403[/C][C]0.444457[/C][/ROW]
[ROW][C]14[/C][C]0.050236[/C][C]0.3859[/C][C]0.35049[/C][/ROW]
[ROW][C]15[/C][C]0.085463[/C][C]0.6565[/C][C]0.257042[/C][/ROW]
[ROW][C]16[/C][C]0.011567[/C][C]0.0888[/C][C]0.464751[/C][/ROW]
[ROW][C]17[/C][C]-0.007352[/C][C]-0.0565[/C][C]0.47758[/C][/ROW]
[ROW][C]18[/C][C]0.071141[/C][C]0.5464[/C][C]0.293411[/C][/ROW]
[ROW][C]19[/C][C]-0.012905[/C][C]-0.0991[/C][C]0.460687[/C][/ROW]
[ROW][C]20[/C][C]-0.071147[/C][C]-0.5465[/C][C]0.293396[/C][/ROW]
[ROW][C]21[/C][C]-0.020423[/C][C]-0.1569[/C][C]0.437942[/C][/ROW]
[ROW][C]22[/C][C]0.026918[/C][C]0.2068[/C][C]0.418453[/C][/ROW]
[ROW][C]23[/C][C]-0.042175[/C][C]-0.324[/C][C]0.373559[/C][/ROW]
[ROW][C]24[/C][C]-0.159308[/C][C]-1.2237[/C][C]0.112971[/C][/ROW]
[ROW][C]25[/C][C]0.010675[/C][C]0.082[/C][C]0.467464[/C][/ROW]
[ROW][C]26[/C][C]0.025732[/C][C]0.1976[/C][C]0.422[/C][/ROW]
[ROW][C]27[/C][C]0.078434[/C][C]0.6025[/C][C]0.274587[/C][/ROW]
[ROW][C]28[/C][C]-0.038312[/C][C]-0.2943[/C][C]0.38479[/C][/ROW]
[ROW][C]29[/C][C]0.01128[/C][C]0.0866[/C][C]0.465624[/C][/ROW]
[ROW][C]30[/C][C]0.051568[/C][C]0.3961[/C][C]0.346731[/C][/ROW]
[ROW][C]31[/C][C]0.020808[/C][C]0.1598[/C][C]0.436782[/C][/ROW]
[ROW][C]32[/C][C]-0.00882[/C][C]-0.0677[/C][C]0.473108[/C][/ROW]
[ROW][C]33[/C][C]-0.122741[/C][C]-0.9428[/C][C]0.174816[/C][/ROW]
[ROW][C]34[/C][C]0.042023[/C][C]0.3228[/C][C]0.373999[/C][/ROW]
[ROW][C]35[/C][C]-0.164378[/C][C]-1.2626[/C][C]0.105849[/C][/ROW]
[ROW][C]36[/C][C]-0.075979[/C][C]-0.5836[/C][C]0.280854[/C][/ROW]
[ROW][C]37[/C][C]0.009709[/C][C]0.0746[/C][C]0.470401[/C][/ROW]
[ROW][C]38[/C][C]-0.135793[/C][C]-1.043[/C][C]0.15059[/C][/ROW]
[ROW][C]39[/C][C]-0.270301[/C][C]-2.0762[/C][C]0.02112[/C][/ROW]
[ROW][C]40[/C][C]0.019084[/C][C]0.1466[/C][C]0.44198[/C][/ROW]
[ROW][C]41[/C][C]-0.026901[/C][C]-0.2066[/C][C]0.418506[/C][/ROW]
[ROW][C]42[/C][C]-0.167472[/C][C]-1.2864[/C][C]0.101668[/C][/ROW]
[ROW][C]43[/C][C]0.041977[/C][C]0.3224[/C][C]0.374134[/C][/ROW]
[ROW][C]44[/C][C]-0.012466[/C][C]-0.0958[/C][C]0.462021[/C][/ROW]
[ROW][C]45[/C][C]0.037986[/C][C]0.2918[/C][C]0.385742[/C][/ROW]
[ROW][C]46[/C][C]0.018364[/C][C]0.1411[/C][C]0.444151[/C][/ROW]
[ROW][C]47[/C][C]0.017222[/C][C]0.1323[/C][C]0.447605[/C][/ROW]
[ROW][C]48[/C][C]0.019821[/C][C]0.1522[/C][C]0.439755[/C][/ROW]
[/TABLE]
Source: https://freestatistics.org/blog/index.php?pk=289699&T=1

Globally Unique Identifier (entire table): ba.freestatistics.org/blog/index.php?pk=289699&T=1

As an alternative you can also use a QR Code:  

The GUIDs for individual cells are displayed in the table below:

Autocorrelation Function
Time lag kACF(k)T-STATP-value
10.0539350.41430.340084
20.0133270.10240.459408
30.1576481.21090.115377
40.0930560.71480.238783
5-0.006214-0.04770.481046
60.0360660.2770.391363
70.0147530.11330.45508
8-0.030385-0.23340.408132
90.0668870.51380.304667
10-0.198004-1.52090.066814
11-0.013642-0.10480.458449
12-0.084628-0.650.259094
130.0182630.14030.444457
140.0502360.38590.35049
150.0854630.65650.257042
160.0115670.08880.464751
17-0.007352-0.05650.47758
180.0711410.54640.293411
19-0.012905-0.09910.460687
20-0.071147-0.54650.293396
21-0.020423-0.15690.437942
220.0269180.20680.418453
23-0.042175-0.3240.373559
24-0.159308-1.22370.112971
250.0106750.0820.467464
260.0257320.19760.422
270.0784340.60250.274587
28-0.038312-0.29430.38479
290.011280.08660.465624
300.0515680.39610.346731
310.0208080.15980.436782
32-0.00882-0.06770.473108
33-0.122741-0.94280.174816
340.0420230.32280.373999
35-0.164378-1.26260.105849
36-0.075979-0.58360.280854
370.0097090.07460.470401
38-0.135793-1.0430.15059
39-0.270301-2.07620.02112
400.0190840.14660.44198
41-0.026901-0.20660.418506
42-0.167472-1.28640.101668
430.0419770.32240.374134
44-0.012466-0.09580.462021
450.0379860.29180.385742
460.0183640.14110.444151
470.0172220.13230.447605
480.0198210.15220.439755


Partial Autocorrelation Function
Time lag kPACF(k)T-STATP-value
10.0539350.41430.340084
20.0104480.08030.468154
30.1568471.20480.116553
40.0785780.60360.274223
5-0.017028-0.13080.44819
60.0120790.09280.463196
7-0.014133-0.10860.456961
8-0.035603-0.27350.392723
90.0666830.51220.305212
10-0.216007-1.65920.051194
110.0183480.14090.444201
12-0.107991-0.82950.205084
130.086640.66550.254163
140.0895460.68780.247132
150.110730.85050.199235
160.0148560.11410.454768
17-0.032407-0.24890.402142
180.0177880.13660.445892
19-0.010185-0.07820.468955
20-0.137063-1.05280.148362
21-0.016423-0.12610.450023
22-0.037801-0.29040.386282
230.0114220.08770.465194
24-0.146562-1.12580.132412
250.0934160.71750.237935
260.0642360.49340.31178
270.168631.29530.100136
28-0.032594-0.25040.40159
29-0.002039-0.01570.493779
30-0.038971-0.29930.382865
31-0.007472-0.05740.477213
32-0.06851-0.52620.300348
33-0.15648-1.20190.117093
34-0.034788-0.26720.395118
35-0.162805-1.25050.108022
36-0.05403-0.4150.339819
370.1497131.150.127399
38-0.058737-0.45120.32676
39-0.156595-1.20280.116924
400.0217210.16680.434032
41-0.006675-0.05130.47964
42-0.068926-0.52940.299247
43-0.009739-0.07480.470312
44-0.045892-0.35250.362857
45-0.012122-0.09310.463066
460.0140280.10780.457279
470.0482430.37060.356144
480.0275020.21120.416712

\begin{tabular}{lllllllll}
\hline
Partial Autocorrelation Function \tabularnewline
Time lag k & PACF(k) & T-STAT & P-value \tabularnewline
1 & 0.053935 & 0.4143 & 0.340084 \tabularnewline
2 & 0.010448 & 0.0803 & 0.468154 \tabularnewline
3 & 0.156847 & 1.2048 & 0.116553 \tabularnewline
4 & 0.078578 & 0.6036 & 0.274223 \tabularnewline
5 & -0.017028 & -0.1308 & 0.44819 \tabularnewline
6 & 0.012079 & 0.0928 & 0.463196 \tabularnewline
7 & -0.014133 & -0.1086 & 0.456961 \tabularnewline
8 & -0.035603 & -0.2735 & 0.392723 \tabularnewline
9 & 0.066683 & 0.5122 & 0.305212 \tabularnewline
10 & -0.216007 & -1.6592 & 0.051194 \tabularnewline
11 & 0.018348 & 0.1409 & 0.444201 \tabularnewline
12 & -0.107991 & -0.8295 & 0.205084 \tabularnewline
13 & 0.08664 & 0.6655 & 0.254163 \tabularnewline
14 & 0.089546 & 0.6878 & 0.247132 \tabularnewline
15 & 0.11073 & 0.8505 & 0.199235 \tabularnewline
16 & 0.014856 & 0.1141 & 0.454768 \tabularnewline
17 & -0.032407 & -0.2489 & 0.402142 \tabularnewline
18 & 0.017788 & 0.1366 & 0.445892 \tabularnewline
19 & -0.010185 & -0.0782 & 0.468955 \tabularnewline
20 & -0.137063 & -1.0528 & 0.148362 \tabularnewline
21 & -0.016423 & -0.1261 & 0.450023 \tabularnewline
22 & -0.037801 & -0.2904 & 0.386282 \tabularnewline
23 & 0.011422 & 0.0877 & 0.465194 \tabularnewline
24 & -0.146562 & -1.1258 & 0.132412 \tabularnewline
25 & 0.093416 & 0.7175 & 0.237935 \tabularnewline
26 & 0.064236 & 0.4934 & 0.31178 \tabularnewline
27 & 0.16863 & 1.2953 & 0.100136 \tabularnewline
28 & -0.032594 & -0.2504 & 0.40159 \tabularnewline
29 & -0.002039 & -0.0157 & 0.493779 \tabularnewline
30 & -0.038971 & -0.2993 & 0.382865 \tabularnewline
31 & -0.007472 & -0.0574 & 0.477213 \tabularnewline
32 & -0.06851 & -0.5262 & 0.300348 \tabularnewline
33 & -0.15648 & -1.2019 & 0.117093 \tabularnewline
34 & -0.034788 & -0.2672 & 0.395118 \tabularnewline
35 & -0.162805 & -1.2505 & 0.108022 \tabularnewline
36 & -0.05403 & -0.415 & 0.339819 \tabularnewline
37 & 0.149713 & 1.15 & 0.127399 \tabularnewline
38 & -0.058737 & -0.4512 & 0.32676 \tabularnewline
39 & -0.156595 & -1.2028 & 0.116924 \tabularnewline
40 & 0.021721 & 0.1668 & 0.434032 \tabularnewline
41 & -0.006675 & -0.0513 & 0.47964 \tabularnewline
42 & -0.068926 & -0.5294 & 0.299247 \tabularnewline
43 & -0.009739 & -0.0748 & 0.470312 \tabularnewline
44 & -0.045892 & -0.3525 & 0.362857 \tabularnewline
45 & -0.012122 & -0.0931 & 0.463066 \tabularnewline
46 & 0.014028 & 0.1078 & 0.457279 \tabularnewline
47 & 0.048243 & 0.3706 & 0.356144 \tabularnewline
48 & 0.027502 & 0.2112 & 0.416712 \tabularnewline
\hline
\end{tabular}
%Source: https://freestatistics.org/blog/index.php?pk=289699&T=2

[TABLE]
[ROW][C]Partial Autocorrelation Function[/C][/ROW]
[ROW][C]Time lag k[/C][C]PACF(k)[/C][C]T-STAT[/C][C]P-value[/C][/ROW]
[ROW][C]1[/C][C]0.053935[/C][C]0.4143[/C][C]0.340084[/C][/ROW]
[ROW][C]2[/C][C]0.010448[/C][C]0.0803[/C][C]0.468154[/C][/ROW]
[ROW][C]3[/C][C]0.156847[/C][C]1.2048[/C][C]0.116553[/C][/ROW]
[ROW][C]4[/C][C]0.078578[/C][C]0.6036[/C][C]0.274223[/C][/ROW]
[ROW][C]5[/C][C]-0.017028[/C][C]-0.1308[/C][C]0.44819[/C][/ROW]
[ROW][C]6[/C][C]0.012079[/C][C]0.0928[/C][C]0.463196[/C][/ROW]
[ROW][C]7[/C][C]-0.014133[/C][C]-0.1086[/C][C]0.456961[/C][/ROW]
[ROW][C]8[/C][C]-0.035603[/C][C]-0.2735[/C][C]0.392723[/C][/ROW]
[ROW][C]9[/C][C]0.066683[/C][C]0.5122[/C][C]0.305212[/C][/ROW]
[ROW][C]10[/C][C]-0.216007[/C][C]-1.6592[/C][C]0.051194[/C][/ROW]
[ROW][C]11[/C][C]0.018348[/C][C]0.1409[/C][C]0.444201[/C][/ROW]
[ROW][C]12[/C][C]-0.107991[/C][C]-0.8295[/C][C]0.205084[/C][/ROW]
[ROW][C]13[/C][C]0.08664[/C][C]0.6655[/C][C]0.254163[/C][/ROW]
[ROW][C]14[/C][C]0.089546[/C][C]0.6878[/C][C]0.247132[/C][/ROW]
[ROW][C]15[/C][C]0.11073[/C][C]0.8505[/C][C]0.199235[/C][/ROW]
[ROW][C]16[/C][C]0.014856[/C][C]0.1141[/C][C]0.454768[/C][/ROW]
[ROW][C]17[/C][C]-0.032407[/C][C]-0.2489[/C][C]0.402142[/C][/ROW]
[ROW][C]18[/C][C]0.017788[/C][C]0.1366[/C][C]0.445892[/C][/ROW]
[ROW][C]19[/C][C]-0.010185[/C][C]-0.0782[/C][C]0.468955[/C][/ROW]
[ROW][C]20[/C][C]-0.137063[/C][C]-1.0528[/C][C]0.148362[/C][/ROW]
[ROW][C]21[/C][C]-0.016423[/C][C]-0.1261[/C][C]0.450023[/C][/ROW]
[ROW][C]22[/C][C]-0.037801[/C][C]-0.2904[/C][C]0.386282[/C][/ROW]
[ROW][C]23[/C][C]0.011422[/C][C]0.0877[/C][C]0.465194[/C][/ROW]
[ROW][C]24[/C][C]-0.146562[/C][C]-1.1258[/C][C]0.132412[/C][/ROW]
[ROW][C]25[/C][C]0.093416[/C][C]0.7175[/C][C]0.237935[/C][/ROW]
[ROW][C]26[/C][C]0.064236[/C][C]0.4934[/C][C]0.31178[/C][/ROW]
[ROW][C]27[/C][C]0.16863[/C][C]1.2953[/C][C]0.100136[/C][/ROW]
[ROW][C]28[/C][C]-0.032594[/C][C]-0.2504[/C][C]0.40159[/C][/ROW]
[ROW][C]29[/C][C]-0.002039[/C][C]-0.0157[/C][C]0.493779[/C][/ROW]
[ROW][C]30[/C][C]-0.038971[/C][C]-0.2993[/C][C]0.382865[/C][/ROW]
[ROW][C]31[/C][C]-0.007472[/C][C]-0.0574[/C][C]0.477213[/C][/ROW]
[ROW][C]32[/C][C]-0.06851[/C][C]-0.5262[/C][C]0.300348[/C][/ROW]
[ROW][C]33[/C][C]-0.15648[/C][C]-1.2019[/C][C]0.117093[/C][/ROW]
[ROW][C]34[/C][C]-0.034788[/C][C]-0.2672[/C][C]0.395118[/C][/ROW]
[ROW][C]35[/C][C]-0.162805[/C][C]-1.2505[/C][C]0.108022[/C][/ROW]
[ROW][C]36[/C][C]-0.05403[/C][C]-0.415[/C][C]0.339819[/C][/ROW]
[ROW][C]37[/C][C]0.149713[/C][C]1.15[/C][C]0.127399[/C][/ROW]
[ROW][C]38[/C][C]-0.058737[/C][C]-0.4512[/C][C]0.32676[/C][/ROW]
[ROW][C]39[/C][C]-0.156595[/C][C]-1.2028[/C][C]0.116924[/C][/ROW]
[ROW][C]40[/C][C]0.021721[/C][C]0.1668[/C][C]0.434032[/C][/ROW]
[ROW][C]41[/C][C]-0.006675[/C][C]-0.0513[/C][C]0.47964[/C][/ROW]
[ROW][C]42[/C][C]-0.068926[/C][C]-0.5294[/C][C]0.299247[/C][/ROW]
[ROW][C]43[/C][C]-0.009739[/C][C]-0.0748[/C][C]0.470312[/C][/ROW]
[ROW][C]44[/C][C]-0.045892[/C][C]-0.3525[/C][C]0.362857[/C][/ROW]
[ROW][C]45[/C][C]-0.012122[/C][C]-0.0931[/C][C]0.463066[/C][/ROW]
[ROW][C]46[/C][C]0.014028[/C][C]0.1078[/C][C]0.457279[/C][/ROW]
[ROW][C]47[/C][C]0.048243[/C][C]0.3706[/C][C]0.356144[/C][/ROW]
[ROW][C]48[/C][C]0.027502[/C][C]0.2112[/C][C]0.416712[/C][/ROW]
[/TABLE]
Source: https://freestatistics.org/blog/index.php?pk=289699&T=2

Globally Unique Identifier (entire table): ba.freestatistics.org/blog/index.php?pk=289699&T=2

As an alternative you can also use a QR Code:  

The GUIDs for individual cells are displayed in the table below:

Partial Autocorrelation Function
Time lag kPACF(k)T-STATP-value
10.0539350.41430.340084
20.0104480.08030.468154
30.1568471.20480.116553
40.0785780.60360.274223
5-0.017028-0.13080.44819
60.0120790.09280.463196
7-0.014133-0.10860.456961
8-0.035603-0.27350.392723
90.0666830.51220.305212
10-0.216007-1.65920.051194
110.0183480.14090.444201
12-0.107991-0.82950.205084
130.086640.66550.254163
140.0895460.68780.247132
150.110730.85050.199235
160.0148560.11410.454768
17-0.032407-0.24890.402142
180.0177880.13660.445892
19-0.010185-0.07820.468955
20-0.137063-1.05280.148362
21-0.016423-0.12610.450023
22-0.037801-0.29040.386282
230.0114220.08770.465194
24-0.146562-1.12580.132412
250.0934160.71750.237935
260.0642360.49340.31178
270.168631.29530.100136
28-0.032594-0.25040.40159
29-0.002039-0.01570.493779
30-0.038971-0.29930.382865
31-0.007472-0.05740.477213
32-0.06851-0.52620.300348
33-0.15648-1.20190.117093
34-0.034788-0.26720.395118
35-0.162805-1.25050.108022
36-0.05403-0.4150.339819
370.1497131.150.127399
38-0.058737-0.45120.32676
39-0.156595-1.20280.116924
400.0217210.16680.434032
41-0.006675-0.05130.47964
42-0.068926-0.52940.299247
43-0.009739-0.07480.470312
44-0.045892-0.35250.362857
45-0.012122-0.09310.463066
460.0140280.10780.457279
470.0482430.37060.356144
480.0275020.21120.416712


Parameters (Session):
par1 = 48 ; par2 = 1 ; par3 = 1 ; par4 = 0 ; par5 = 12 ; par6 = White Noise ; par7 = 0.95 ;
Parameters (R input):
par1 = 48 ; par2 = 1 ; par3 = 1 ; par4 = 0 ; par5 = 12 ; par6 = White Noise ; par7 = 0.95 ; par8 = ;
R code (references can be found in the software module):
if (par1 == 'Default') {
par1 = 10*log10(length(x))
} else {
par1 <- as.numeric(par1)
}
par2 <- as.numeric(par2)
par3 <- as.numeric(par3)
par4 <- as.numeric(par4)
par5 <- as.numeric(par5)
if (par6 == 'White Noise') par6 <- 'white' else par6 <- 'ma'
par7 <- as.numeric(par7)
if (par8 != '') par8 <- as.numeric(par8)
ox <- x
if (par8 == '') {
if (par2 == 0) {
x <- log(x)
} else {
x <- (x ^ par2 - 1) / par2
}
} else {
x <- log(x,base=par8)
}
if (par3 > 0) x <- diff(x,lag=1,difference=par3)
if (par4 > 0) x <- diff(x,lag=par5,difference=par4)
bitmap(file='picts.png')
op <- par(mfrow=c(2,1))
plot(ox,type='l',main='Original Time Series',xlab='time',ylab='value')
if (par8=='') {
mytitle <- paste('Working Time Series (lambda=',par2,', d=',par3,', D=',par4,')',sep='')
mysub <- paste('(lambda=',par2,', d=',par3,', D=',par4,', CI=', par7, ', CI type=',par6,')',sep='')
} else {
mytitle <- paste('Working Time Series (base=',par8,', d=',par3,', D=',par4,')',sep='')
mysub <- paste('(base=',par8,', d=',par3,', D=',par4,', CI=', par7, ', CI type=',par6,')',sep='')
}
plot(x,type='l', main=mytitle,xlab='time',ylab='value')
par(op)
dev.off()
bitmap(file='pic1.png')
racf <- acf(x, par1, main='Autocorrelation', xlab='time lag', ylab='ACF', ci.type=par6, ci=par7, sub=mysub)
dev.off()
bitmap(file='pic2.png')
rpacf <- pacf(x,par1,main='Partial Autocorrelation',xlab='lags',ylab='PACF',sub=mysub)
dev.off()
(myacf <- c(racf$acf))
(mypacf <- c(rpacf$acf))
lengthx <- length(x)
sqrtn <- sqrt(lengthx)
load(file='createtable')
a<-table.start()
a<-table.row.start(a)
a<-table.element(a,'Autocorrelation Function',4,TRUE)
a<-table.row.end(a)
a<-table.row.start(a)
a<-table.element(a,'Time lag k',header=TRUE)
a<-table.element(a,hyperlink('basics.htm','ACF(k)','click here for more information about the Autocorrelation Function'),header=TRUE)
a<-table.element(a,'T-STAT',header=TRUE)
a<-table.element(a,'P-value',header=TRUE)
a<-table.row.end(a)
for (i in 2:(par1+1)) {
a<-table.row.start(a)
a<-table.element(a,i-1,header=TRUE)
a<-table.element(a,round(myacf[i],6))
mytstat <- myacf[i]*sqrtn
a<-table.element(a,round(mytstat,4))
a<-table.element(a,round(1-pt(abs(mytstat),lengthx),6))
a<-table.row.end(a)
}
a<-table.end(a)
table.save(a,file='mytable.tab')
a<-table.start()
a<-table.row.start(a)
a<-table.element(a,'Partial Autocorrelation Function',4,TRUE)
a<-table.row.end(a)
a<-table.row.start(a)
a<-table.element(a,'Time lag k',header=TRUE)
a<-table.element(a,hyperlink('basics.htm','PACF(k)','click here for more information about the Partial Autocorrelation Function'),header=TRUE)
a<-table.element(a,'T-STAT',header=TRUE)
a<-table.element(a,'P-value',header=TRUE)
a<-table.row.end(a)
for (i in 1:par1) {
a<-table.row.start(a)
a<-table.element(a,i,header=TRUE)
a<-table.element(a,round(mypacf[i],6))
mytstat <- mypacf[i]*sqrtn
a<-table.element(a,round(mytstat,4))
a<-table.element(a,round(1-pt(abs(mytstat),lengthx),6))
a<-table.row.end(a)
}
a<-table.end(a)
table.save(a,file='mytable1.tab')