Free Statistics
of Irreproducible Research!
Description of Statistical Computation | |||||||||||||||||||||||||||||||||
|---|---|---|---|---|---|---|---|---|---|---|---|---|---|---|---|---|---|---|---|---|---|---|---|---|---|---|---|---|---|---|---|---|---|
| Author's title | |||||||||||||||||||||||||||||||||
| Author | *The author of this computation has been verified* | ||||||||||||||||||||||||||||||||
| R Software Module | rwasp_fitdistrchisq1.wasp | ||||||||||||||||||||||||||||||||
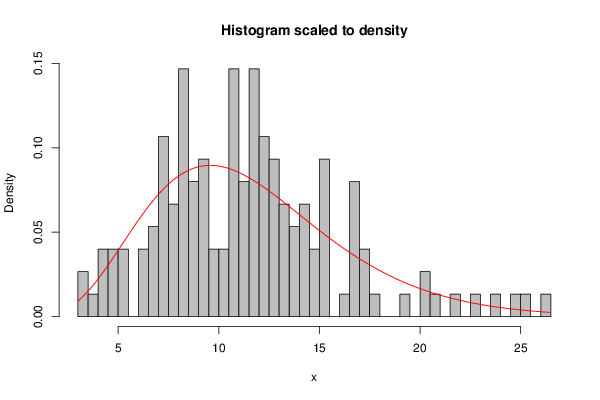
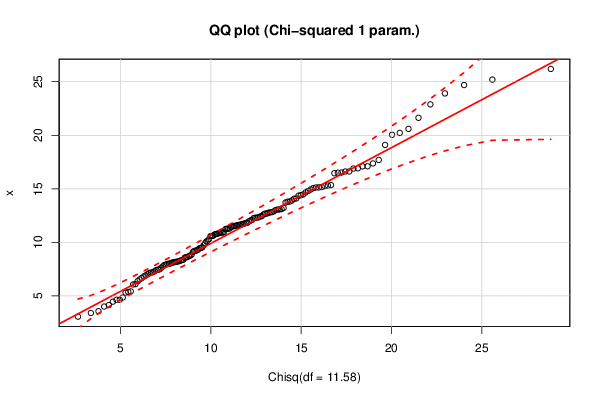
| Title produced by software | Maximum-likelihood Fitting - Chi-squared Distribution | ||||||||||||||||||||||||||||||||
| Date of computation | Thu, 21 Jan 2016 07:55:02 +0000 | ||||||||||||||||||||||||||||||||
| Cite this page as follows | Statistical Computations at FreeStatistics.org, Office for Research Development and Education, URL https://freestatistics.org/blog/index.php?v=date/2016/Jan/21/t1453363001itzsn25fj6xw0oo.htm/, Retrieved Mon, 29 Apr 2024 04:53:02 +0000 | ||||||||||||||||||||||||||||||||
| Statistical Computations at FreeStatistics.org, Office for Research Development and Education, URL https://freestatistics.org/blog/index.php?pk=289811, Retrieved Mon, 29 Apr 2024 04:53:02 +0000 | |||||||||||||||||||||||||||||||||
| QR Codes: | |||||||||||||||||||||||||||||||||
|
| |||||||||||||||||||||||||||||||||
| Original text written by user: | |||||||||||||||||||||||||||||||||
| IsPrivate? | No (this computation is public) | ||||||||||||||||||||||||||||||||
| User-defined keywords | |||||||||||||||||||||||||||||||||
| Estimated Impact | 105 | ||||||||||||||||||||||||||||||||
Tree of Dependent Computations | |||||||||||||||||||||||||||||||||
| Family? (F = Feedback message, R = changed R code, M = changed R Module, P = changed Parameters, D = changed Data) | |||||||||||||||||||||||||||||||||
| - [Maximum-likelihood Fitting - Chi-squared Distribution] [] [2016-01-21 07:55:02] [c64ec7a2d0db7c519901da97df98e10d] [Current] | |||||||||||||||||||||||||||||||||
| Feedback Forum | |||||||||||||||||||||||||||||||||
Post a new message | |||||||||||||||||||||||||||||||||
Dataset | |||||||||||||||||||||||||||||||||
| Dataseries X: | |||||||||||||||||||||||||||||||||
7.038000643 6.916302644 14.47796988 19.09765301 11.45985244 9.214516154 8.609559417 12.08897342 7.929146371 8.108477761 10.72831674 26.19206344 10.85539296 4.647097627 8.259985746 12.04346248 13.72261352 7.464611938 7.487224479 4.852896082 21.63060067 10.16782594 6.543246196 16.89649193 11.62058271 23.90794066 14.66857781 13.2222634 12.32072242 6.107537199 8.126620064 8.0200517 11.95208251 11.29742191 8.209801964 8.72013604 10.60049124 9.282624225 6.817237025 8.633147787 20.04713506 7.621341925 3.578459716 12.41295334 20.2230696 15.35084446 9.107967449 7.193913945 7.21968995 22.88353215 11.27270836 14.06928409 3.07012206 15.137479 6.674362638 12.82992589 8.352162642 13.06613621 13.91203353 16.45792314 17.1067134 10.5731559 7.99126064 9.204957829 11.67341918 12.59881779 10.91054683 17.37195352 15.30844203 3.411459493 15.16924332 11.58704363 11.48148827 9.340000059 15.13161637 10.61352939 6.075358976 14.94021634 8.848931175 24.68932802 11.53391548 12.6871527 25.19635589 12.45272368 10.90342682 9.735708456 16.61876901 9.535451954 10.08416953 12.69181935 20.60111354 12.91144807 6.380204973 10.91029442 8.18763532 4.014733702 7.142997325 12.77285687 5.314471941 8.180314296 15.25470209 8.030433674 11.82560087 10.30595393 9.468316998 14.36129914 16.62388164 5.376657288 10.97778533 17.69719866 12.25998778 5.430284469 13.8147117 14.10379006 7.419580281 13.0881447 13.02845326 8.305817612 4.150293051 7.308568395 8.378234921 9.483049175 12.29030735 13.79784671 16.52266175 11.8151468 10.7951911 12.80965787 14.40697576 11.55088769 16.9141281 4.647973215 16.5093465 8.579572243 11.71974138 15.06896628 11.64693867 17.09733382 11.29431023 14.80172557 13.11218775 7.878163611 9.912256497 8.769506203 10.78079094 11.23954521 4.469090351 7.76202616 12.33443871 11.7518016 | |||||||||||||||||||||||||||||||||
Tables (Output of Computation) | |||||||||||||||||||||||||||||||||
| |||||||||||||||||||||||||||||||||
Figures (Output of Computation) | |||||||||||||||||||||||||||||||||
Input Parameters & R Code | |||||||||||||||||||||||||||||||||
| Parameters (Session): | |||||||||||||||||||||||||||||||||
| Parameters (R input): | |||||||||||||||||||||||||||||||||
| R code (references can be found in the software module): | |||||||||||||||||||||||||||||||||
library(MASS) | |||||||||||||||||||||||||||||||||