Free Statistics

of Irreproducible Research!

Author's title

Author*The author of this computation has been verified*
R Software Modulerwasp_arimabackwardselection.wasp
Title produced by softwareARIMA Backward Selection
Date of computationFri, 22 Jan 2016 08:37:53 +0000
Cite this page as followsStatistical Computations at FreeStatistics.org, Office for Research Development and Education, URL https://freestatistics.org/blog/index.php?v=date/2016/Jan/22/t14534518883r50k4a08u56aya.htm/, Retrieved Tue, 07 May 2024 10:23:30 +0000
Statistical Computations at FreeStatistics.org, Office for Research Development and Education, URL https://freestatistics.org/blog/index.php?pk=290347, Retrieved Tue, 07 May 2024 10:23:30 +0000
QR Codes:

Original text written by user:
IsPrivate?No (this computation is public)
User-defined keywords
Estimated Impact62
Family? (F = Feedback message, R = changed R code, M = changed R Module, P = changed Parameters, D = changed Data)
-       [ARIMA Backward Selection] [Vraag 111] [2016-01-22 08:37:53] [afd4c65acc975d18603626e8e09ce640] [Current]
Feedback Forum

Post a new message
Dataseries X:
3035
2552
2704
2554
2014
1655
1721
1524
1596
2074
2199
2512
2933
2889
2938
2497
1870
1726
1607
1545
1396
1787
2076
2837
2787
3891
3179
2011
1636
1580
1489
1300
1356
1653
2013
2823
3102
2294
2385
2444
1748
1554
1498
1361
1346
1564
1640
2293
2815
3137
2679
1969
1870
1633
1529
1366
1357
1570
1535
2491
3084
2605
2573
2143
1693
1504
1461
1354
1333
1492
1781
1915


Summary of computational transaction
Raw Inputview raw input (R code)
Raw Outputview raw output of R engine
Computing time3 seconds
R Server'Sir Ronald Aylmer Fisher' @ fisher.wessa.net

\begin{tabular}{lllllllll}
\hline
Summary of computational transaction \tabularnewline
Raw Input & view raw input (R code)  \tabularnewline
Raw Output & view raw output of R engine  \tabularnewline
Computing time & 3 seconds \tabularnewline
R Server & 'Sir Ronald Aylmer Fisher' @ fisher.wessa.net \tabularnewline
\hline
\end{tabular}
%Source: https://freestatistics.org/blog/index.php?pk=290347&T=0

[TABLE]
[ROW][C]Summary of computational transaction[/C][/ROW]
[ROW][C]Raw Input[/C][C]view raw input (R code) [/C][/ROW]
[ROW][C]Raw Output[/C][C]view raw output of R engine [/C][/ROW]
[ROW][C]Computing time[/C][C]3 seconds[/C][/ROW]
[ROW][C]R Server[/C][C]'Sir Ronald Aylmer Fisher' @ fisher.wessa.net[/C][/ROW]
[/TABLE]
Source: https://freestatistics.org/blog/index.php?pk=290347&T=0

Globally Unique Identifier (entire table): ba.freestatistics.org/blog/index.php?pk=290347&T=0

As an alternative you can also use a QR Code:  

The GUIDs for individual cells are displayed in the table below:

Summary of computational transaction
Raw Inputview raw input (R code)
Raw Outputview raw output of R engine
Computing time3 seconds
R Server'Sir Ronald Aylmer Fisher' @ fisher.wessa.net


ARIMA Parameter Estimation and Backward Selection
Iterationar1ar2ar3ma1sar1sma1
Estimates ( 1 )0.29420.42550.22350.31160.38570.3116
(p-val)(0.6184 )(0.353 )(0.2778 )(0.7046 )(0.1865 )(0.7046 )
Estimates ( 2 )0.41090.40540.133800.39540.4972
(p-val)(0.4207 )(0.4424 )(0.5733 )(NA )(0.2136 )(0.3786 )
Estimates ( 3 )0.44160.5176000.22580.64
(p-val)(0.5144 )(0.4292 )(NA )(NA )(0.2882 )(0.2359 )
Estimates ( 4 )00.9439000.29671.0033
(p-val)(NA )(0 )(NA )(NA )(0.0162 )(0 )
Estimates ( 5 )NANANANANANA
(p-val)(NA )(NA )(NA )(NA )(NA )(NA )
Estimates ( 6 )NANANANANANA
(p-val)(NA )(NA )(NA )(NA )(NA )(NA )
Estimates ( 7 )NANANANANANA
(p-val)(NA )(NA )(NA )(NA )(NA )(NA )
Estimates ( 8 )NANANANANANA
(p-val)(NA )(NA )(NA )(NA )(NA )(NA )
Estimates ( 9 )NANANANANANA
(p-val)(NA )(NA )(NA )(NA )(NA )(NA )
Estimates ( 10 )NANANANANANA
(p-val)(NA )(NA )(NA )(NA )(NA )(NA )
Estimates ( 11 )NANANANANANA
(p-val)(NA )(NA )(NA )(NA )(NA )(NA )

\begin{tabular}{lllllllll}
\hline
ARIMA Parameter Estimation and Backward Selection \tabularnewline
Iteration & ar1 & ar2 & ar3 & ma1 & sar1 & sma1 \tabularnewline
Estimates ( 1 ) & 0.2942 & 0.4255 & 0.2235 & 0.3116 & 0.3857 & 0.3116 \tabularnewline
(p-val) & (0.6184 ) & (0.353 ) & (0.2778 ) & (0.7046 ) & (0.1865 ) & (0.7046 ) \tabularnewline
Estimates ( 2 ) & 0.4109 & 0.4054 & 0.1338 & 0 & 0.3954 & 0.4972 \tabularnewline
(p-val) & (0.4207 ) & (0.4424 ) & (0.5733 ) & (NA ) & (0.2136 ) & (0.3786 ) \tabularnewline
Estimates ( 3 ) & 0.4416 & 0.5176 & 0 & 0 & 0.2258 & 0.64 \tabularnewline
(p-val) & (0.5144 ) & (0.4292 ) & (NA ) & (NA ) & (0.2882 ) & (0.2359 ) \tabularnewline
Estimates ( 4 ) & 0 & 0.9439 & 0 & 0 & 0.2967 & 1.0033 \tabularnewline
(p-val) & (NA ) & (0 ) & (NA ) & (NA ) & (0.0162 ) & (0 ) \tabularnewline
Estimates ( 5 ) & NA & NA & NA & NA & NA & NA \tabularnewline
(p-val) & (NA ) & (NA ) & (NA ) & (NA ) & (NA ) & (NA ) \tabularnewline
Estimates ( 6 ) & NA & NA & NA & NA & NA & NA \tabularnewline
(p-val) & (NA ) & (NA ) & (NA ) & (NA ) & (NA ) & (NA ) \tabularnewline
Estimates ( 7 ) & NA & NA & NA & NA & NA & NA \tabularnewline
(p-val) & (NA ) & (NA ) & (NA ) & (NA ) & (NA ) & (NA ) \tabularnewline
Estimates ( 8 ) & NA & NA & NA & NA & NA & NA \tabularnewline
(p-val) & (NA ) & (NA ) & (NA ) & (NA ) & (NA ) & (NA ) \tabularnewline
Estimates ( 9 ) & NA & NA & NA & NA & NA & NA \tabularnewline
(p-val) & (NA ) & (NA ) & (NA ) & (NA ) & (NA ) & (NA ) \tabularnewline
Estimates ( 10 ) & NA & NA & NA & NA & NA & NA \tabularnewline
(p-val) & (NA ) & (NA ) & (NA ) & (NA ) & (NA ) & (NA ) \tabularnewline
Estimates ( 11 ) & NA & NA & NA & NA & NA & NA \tabularnewline
(p-val) & (NA ) & (NA ) & (NA ) & (NA ) & (NA ) & (NA ) \tabularnewline
\hline
\end{tabular}
%Source: https://freestatistics.org/blog/index.php?pk=290347&T=1

[TABLE]
[ROW][C]ARIMA Parameter Estimation and Backward Selection[/C][/ROW]
[ROW][C]Iteration[/C][C]ar1[/C][C]ar2[/C][C]ar3[/C][C]ma1[/C][C]sar1[/C][C]sma1[/C][/ROW]
[ROW][C]Estimates ( 1 )[/C][C]0.2942[/C][C]0.4255[/C][C]0.2235[/C][C]0.3116[/C][C]0.3857[/C][C]0.3116[/C][/ROW]
[ROW][C](p-val)[/C][C](0.6184 )[/C][C](0.353 )[/C][C](0.2778 )[/C][C](0.7046 )[/C][C](0.1865 )[/C][C](0.7046 )[/C][/ROW]
[ROW][C]Estimates ( 2 )[/C][C]0.4109[/C][C]0.4054[/C][C]0.1338[/C][C]0[/C][C]0.3954[/C][C]0.4972[/C][/ROW]
[ROW][C](p-val)[/C][C](0.4207 )[/C][C](0.4424 )[/C][C](0.5733 )[/C][C](NA )[/C][C](0.2136 )[/C][C](0.3786 )[/C][/ROW]
[ROW][C]Estimates ( 3 )[/C][C]0.4416[/C][C]0.5176[/C][C]0[/C][C]0[/C][C]0.2258[/C][C]0.64[/C][/ROW]
[ROW][C](p-val)[/C][C](0.5144 )[/C][C](0.4292 )[/C][C](NA )[/C][C](NA )[/C][C](0.2882 )[/C][C](0.2359 )[/C][/ROW]
[ROW][C]Estimates ( 4 )[/C][C]0[/C][C]0.9439[/C][C]0[/C][C]0[/C][C]0.2967[/C][C]1.0033[/C][/ROW]
[ROW][C](p-val)[/C][C](NA )[/C][C](0 )[/C][C](NA )[/C][C](NA )[/C][C](0.0162 )[/C][C](0 )[/C][/ROW]
[ROW][C]Estimates ( 5 )[/C][C]NA[/C][C]NA[/C][C]NA[/C][C]NA[/C][C]NA[/C][C]NA[/C][/ROW]
[ROW][C](p-val)[/C][C](NA )[/C][C](NA )[/C][C](NA )[/C][C](NA )[/C][C](NA )[/C][C](NA )[/C][/ROW]
[ROW][C]Estimates ( 6 )[/C][C]NA[/C][C]NA[/C][C]NA[/C][C]NA[/C][C]NA[/C][C]NA[/C][/ROW]
[ROW][C](p-val)[/C][C](NA )[/C][C](NA )[/C][C](NA )[/C][C](NA )[/C][C](NA )[/C][C](NA )[/C][/ROW]
[ROW][C]Estimates ( 7 )[/C][C]NA[/C][C]NA[/C][C]NA[/C][C]NA[/C][C]NA[/C][C]NA[/C][/ROW]
[ROW][C](p-val)[/C][C](NA )[/C][C](NA )[/C][C](NA )[/C][C](NA )[/C][C](NA )[/C][C](NA )[/C][/ROW]
[ROW][C]Estimates ( 8 )[/C][C]NA[/C][C]NA[/C][C]NA[/C][C]NA[/C][C]NA[/C][C]NA[/C][/ROW]
[ROW][C](p-val)[/C][C](NA )[/C][C](NA )[/C][C](NA )[/C][C](NA )[/C][C](NA )[/C][C](NA )[/C][/ROW]
[ROW][C]Estimates ( 9 )[/C][C]NA[/C][C]NA[/C][C]NA[/C][C]NA[/C][C]NA[/C][C]NA[/C][/ROW]
[ROW][C](p-val)[/C][C](NA )[/C][C](NA )[/C][C](NA )[/C][C](NA )[/C][C](NA )[/C][C](NA )[/C][/ROW]
[ROW][C]Estimates ( 10 )[/C][C]NA[/C][C]NA[/C][C]NA[/C][C]NA[/C][C]NA[/C][C]NA[/C][/ROW]
[ROW][C](p-val)[/C][C](NA )[/C][C](NA )[/C][C](NA )[/C][C](NA )[/C][C](NA )[/C][C](NA )[/C][/ROW]
[ROW][C]Estimates ( 11 )[/C][C]NA[/C][C]NA[/C][C]NA[/C][C]NA[/C][C]NA[/C][C]NA[/C][/ROW]
[ROW][C](p-val)[/C][C](NA )[/C][C](NA )[/C][C](NA )[/C][C](NA )[/C][C](NA )[/C][C](NA )[/C][/ROW]
[/TABLE]
Source: https://freestatistics.org/blog/index.php?pk=290347&T=1

Globally Unique Identifier (entire table): ba.freestatistics.org/blog/index.php?pk=290347&T=1

As an alternative you can also use a QR Code:  

The GUIDs for individual cells are displayed in the table below:

ARIMA Parameter Estimation and Backward Selection
Iterationar1ar2ar3ma1sar1sma1
Estimates ( 1 )0.29420.42550.22350.31160.38570.3116
(p-val)(0.6184 )(0.353 )(0.2778 )(0.7046 )(0.1865 )(0.7046 )
Estimates ( 2 )0.41090.40540.133800.39540.4972
(p-val)(0.4207 )(0.4424 )(0.5733 )(NA )(0.2136 )(0.3786 )
Estimates ( 3 )0.44160.5176000.22580.64
(p-val)(0.5144 )(0.4292 )(NA )(NA )(0.2882 )(0.2359 )
Estimates ( 4 )00.9439000.29671.0033
(p-val)(NA )(0 )(NA )(NA )(0.0162 )(0 )
Estimates ( 5 )NANANANANANA
(p-val)(NA )(NA )(NA )(NA )(NA )(NA )
Estimates ( 6 )NANANANANANA
(p-val)(NA )(NA )(NA )(NA )(NA )(NA )
Estimates ( 7 )NANANANANANA
(p-val)(NA )(NA )(NA )(NA )(NA )(NA )
Estimates ( 8 )NANANANANANA
(p-val)(NA )(NA )(NA )(NA )(NA )(NA )
Estimates ( 9 )NANANANANANA
(p-val)(NA )(NA )(NA )(NA )(NA )(NA )
Estimates ( 10 )NANANANANANA
(p-val)(NA )(NA )(NA )(NA )(NA )(NA )
Estimates ( 11 )NANANANANANA
(p-val)(NA )(NA )(NA )(NA )(NA )(NA )


Estimated ARIMA Residuals
Value
506.426738367619
-413.84574125118
346.860804371247
-183.084660796588
-405.037865853094
-181.36705040597
189.298611000218
-201.974488128342
182.341957509985
456.377699207521
33.8655282428787
342.501170496486
360.706239102951
-92.117649939415
136.698883206653
-415.853790963673
-420.516067584897
46.9540341908551
-64.636097021152
11.1002229514529
-112.090738277592
469.196234128328
180.240287689584
752.475922635456
-246.724126841401
1245.88268102436
-1048.35890918946
-740.069487915235
-106.263710847069
87.2724707169958
-70.0098988370932
-118.041551469367
126.323002515967
297.903505426521
304.381084791831
752.397175197003
88.336292864451
-777.299984275301
385.042784632912
9.68649229144194
-617.928652049538
40.2383618139236
-9.7541216141949
-77.6564429070879
42.9650093424075
244.486215452077
36.2755613514244
678.9508266574
347.542984019905
269.248208327663
-495.373401768862
-483.902931847778
112.648083656937
-196.887812078292
13.7808396377557
-127.163226214101
78.5897836074228
221.878888931487
-62.2730230662128
1008.87756949877
317.825584824678
-518.281819711809
168.428870876195
-410.225278473051
-245.514651235835
-63.6369199000035
40.9009433917004
-77.9139458573486
44.4200038420461
178.832465801878
271.961491829147
84.5780913462256

\begin{tabular}{lllllllll}
\hline
Estimated ARIMA Residuals \tabularnewline
Value \tabularnewline
 \tabularnewline
506.426738367619 \tabularnewline
-413.84574125118 \tabularnewline
346.860804371247 \tabularnewline
-183.084660796588 \tabularnewline
-405.037865853094 \tabularnewline
-181.36705040597 \tabularnewline
189.298611000218 \tabularnewline
-201.974488128342 \tabularnewline
182.341957509985 \tabularnewline
456.377699207521 \tabularnewline
33.8655282428787 \tabularnewline
342.501170496486 \tabularnewline
360.706239102951 \tabularnewline
-92.117649939415 \tabularnewline
136.698883206653 \tabularnewline
-415.853790963673 \tabularnewline
-420.516067584897 \tabularnewline
46.9540341908551 \tabularnewline
-64.636097021152 \tabularnewline
11.1002229514529 \tabularnewline
-112.090738277592 \tabularnewline
469.196234128328 \tabularnewline
180.240287689584 \tabularnewline
752.475922635456 \tabularnewline
-246.724126841401 \tabularnewline
1245.88268102436 \tabularnewline
-1048.35890918946 \tabularnewline
-740.069487915235 \tabularnewline
-106.263710847069 \tabularnewline
87.2724707169958 \tabularnewline
-70.0098988370932 \tabularnewline
-118.041551469367 \tabularnewline
126.323002515967 \tabularnewline
297.903505426521 \tabularnewline
304.381084791831 \tabularnewline
752.397175197003 \tabularnewline
88.336292864451 \tabularnewline
-777.299984275301 \tabularnewline
385.042784632912 \tabularnewline
9.68649229144194 \tabularnewline
-617.928652049538 \tabularnewline
40.2383618139236 \tabularnewline
-9.7541216141949 \tabularnewline
-77.6564429070879 \tabularnewline
42.9650093424075 \tabularnewline
244.486215452077 \tabularnewline
36.2755613514244 \tabularnewline
678.9508266574 \tabularnewline
347.542984019905 \tabularnewline
269.248208327663 \tabularnewline
-495.373401768862 \tabularnewline
-483.902931847778 \tabularnewline
112.648083656937 \tabularnewline
-196.887812078292 \tabularnewline
13.7808396377557 \tabularnewline
-127.163226214101 \tabularnewline
78.5897836074228 \tabularnewline
221.878888931487 \tabularnewline
-62.2730230662128 \tabularnewline
1008.87756949877 \tabularnewline
317.825584824678 \tabularnewline
-518.281819711809 \tabularnewline
168.428870876195 \tabularnewline
-410.225278473051 \tabularnewline
-245.514651235835 \tabularnewline
-63.6369199000035 \tabularnewline
40.9009433917004 \tabularnewline
-77.9139458573486 \tabularnewline
44.4200038420461 \tabularnewline
178.832465801878 \tabularnewline
271.961491829147 \tabularnewline
84.5780913462256 \tabularnewline
\hline
\end{tabular}
%Source: https://freestatistics.org/blog/index.php?pk=290347&T=2

[TABLE]
[ROW][C]Estimated ARIMA Residuals[/C][/ROW]
[ROW][C]Value[/C][/ROW]
[ROW][C][/C][/ROW]
[ROW][C]506.426738367619[/C][/ROW]
[ROW][C]-413.84574125118[/C][/ROW]
[ROW][C]346.860804371247[/C][/ROW]
[ROW][C]-183.084660796588[/C][/ROW]
[ROW][C]-405.037865853094[/C][/ROW]
[ROW][C]-181.36705040597[/C][/ROW]
[ROW][C]189.298611000218[/C][/ROW]
[ROW][C]-201.974488128342[/C][/ROW]
[ROW][C]182.341957509985[/C][/ROW]
[ROW][C]456.377699207521[/C][/ROW]
[ROW][C]33.8655282428787[/C][/ROW]
[ROW][C]342.501170496486[/C][/ROW]
[ROW][C]360.706239102951[/C][/ROW]
[ROW][C]-92.117649939415[/C][/ROW]
[ROW][C]136.698883206653[/C][/ROW]
[ROW][C]-415.853790963673[/C][/ROW]
[ROW][C]-420.516067584897[/C][/ROW]
[ROW][C]46.9540341908551[/C][/ROW]
[ROW][C]-64.636097021152[/C][/ROW]
[ROW][C]11.1002229514529[/C][/ROW]
[ROW][C]-112.090738277592[/C][/ROW]
[ROW][C]469.196234128328[/C][/ROW]
[ROW][C]180.240287689584[/C][/ROW]
[ROW][C]752.475922635456[/C][/ROW]
[ROW][C]-246.724126841401[/C][/ROW]
[ROW][C]1245.88268102436[/C][/ROW]
[ROW][C]-1048.35890918946[/C][/ROW]
[ROW][C]-740.069487915235[/C][/ROW]
[ROW][C]-106.263710847069[/C][/ROW]
[ROW][C]87.2724707169958[/C][/ROW]
[ROW][C]-70.0098988370932[/C][/ROW]
[ROW][C]-118.041551469367[/C][/ROW]
[ROW][C]126.323002515967[/C][/ROW]
[ROW][C]297.903505426521[/C][/ROW]
[ROW][C]304.381084791831[/C][/ROW]
[ROW][C]752.397175197003[/C][/ROW]
[ROW][C]88.336292864451[/C][/ROW]
[ROW][C]-777.299984275301[/C][/ROW]
[ROW][C]385.042784632912[/C][/ROW]
[ROW][C]9.68649229144194[/C][/ROW]
[ROW][C]-617.928652049538[/C][/ROW]
[ROW][C]40.2383618139236[/C][/ROW]
[ROW][C]-9.7541216141949[/C][/ROW]
[ROW][C]-77.6564429070879[/C][/ROW]
[ROW][C]42.9650093424075[/C][/ROW]
[ROW][C]244.486215452077[/C][/ROW]
[ROW][C]36.2755613514244[/C][/ROW]
[ROW][C]678.9508266574[/C][/ROW]
[ROW][C]347.542984019905[/C][/ROW]
[ROW][C]269.248208327663[/C][/ROW]
[ROW][C]-495.373401768862[/C][/ROW]
[ROW][C]-483.902931847778[/C][/ROW]
[ROW][C]112.648083656937[/C][/ROW]
[ROW][C]-196.887812078292[/C][/ROW]
[ROW][C]13.7808396377557[/C][/ROW]
[ROW][C]-127.163226214101[/C][/ROW]
[ROW][C]78.5897836074228[/C][/ROW]
[ROW][C]221.878888931487[/C][/ROW]
[ROW][C]-62.2730230662128[/C][/ROW]
[ROW][C]1008.87756949877[/C][/ROW]
[ROW][C]317.825584824678[/C][/ROW]
[ROW][C]-518.281819711809[/C][/ROW]
[ROW][C]168.428870876195[/C][/ROW]
[ROW][C]-410.225278473051[/C][/ROW]
[ROW][C]-245.514651235835[/C][/ROW]
[ROW][C]-63.6369199000035[/C][/ROW]
[ROW][C]40.9009433917004[/C][/ROW]
[ROW][C]-77.9139458573486[/C][/ROW]
[ROW][C]44.4200038420461[/C][/ROW]
[ROW][C]178.832465801878[/C][/ROW]
[ROW][C]271.961491829147[/C][/ROW]
[ROW][C]84.5780913462256[/C][/ROW]
[/TABLE]
Source: https://freestatistics.org/blog/index.php?pk=290347&T=2

Globally Unique Identifier (entire table): ba.freestatistics.org/blog/index.php?pk=290347&T=2

As an alternative you can also use a QR Code:  

The GUIDs for individual cells are displayed in the table below:

Estimated ARIMA Residuals
Value
506.426738367619
-413.84574125118
346.860804371247
-183.084660796588
-405.037865853094
-181.36705040597
189.298611000218
-201.974488128342
182.341957509985
456.377699207521
33.8655282428787
342.501170496486
360.706239102951
-92.117649939415
136.698883206653
-415.853790963673
-420.516067584897
46.9540341908551
-64.636097021152
11.1002229514529
-112.090738277592
469.196234128328
180.240287689584
752.475922635456
-246.724126841401
1245.88268102436
-1048.35890918946
-740.069487915235
-106.263710847069
87.2724707169958
-70.0098988370932
-118.041551469367
126.323002515967
297.903505426521
304.381084791831
752.397175197003
88.336292864451
-777.299984275301
385.042784632912
9.68649229144194
-617.928652049538
40.2383618139236
-9.7541216141949
-77.6564429070879
42.9650093424075
244.486215452077
36.2755613514244
678.9508266574
347.542984019905
269.248208327663
-495.373401768862
-483.902931847778
112.648083656937
-196.887812078292
13.7808396377557
-127.163226214101
78.5897836074228
221.878888931487
-62.2730230662128
1008.87756949877
317.825584824678
-518.281819711809
168.428870876195
-410.225278473051
-245.514651235835
-63.6369199000035
40.9009433917004
-77.9139458573486
44.4200038420461
178.832465801878
271.961491829147
84.5780913462256


Parameters (Session):
par1 = 12 ; par2 = Triple ; par3 = additive ;
Parameters (R input):
par1 = FALSE ; par2 = 1 ; par3 = 0 ; par4 = 0 ; par5 = 1 ; par6 = 3 ; par7 = 1 ; par8 = 1 ; par9 = 1 ;
R code (references can be found in the software module):
library(lattice)
if (par1 == 'TRUE') par1 <- TRUE
if (par1 == 'FALSE') par1 <- FALSE
par2 <- as.numeric(par2) #Box-Cox lambda transformation parameter
par3 <- as.numeric(par3) #degree of non-seasonal differencing
par4 <- as.numeric(par4) #degree of seasonal differencing
par5 <- as.numeric(par5) #seasonal period
par6 <- as.numeric(par6) #degree (p) of the non-seasonal AR(p) polynomial
par7 <- as.numeric(par7) #degree (q) of the non-seasonal MA(q) polynomial
par8 <- as.numeric(par8) #degree (P) of the seasonal AR(P) polynomial
par9 <- as.numeric(par9) #degree (Q) of the seasonal MA(Q) polynomial
armaGR <- function(arima.out, names, n){
try1 <- arima.out$coef
try2 <- sqrt(diag(arima.out$var.coef))
try.data.frame <- data.frame(matrix(NA,ncol=4,nrow=length(names)))
dimnames(try.data.frame) <- list(names,c('coef','std','tstat','pv'))
try.data.frame[,1] <- try1
for(i in 1:length(try2)) try.data.frame[which(rownames(try.data.frame)==names(try2)[i]),2] <- try2[i]
try.data.frame[,3] <- try.data.frame[,1] / try.data.frame[,2]
try.data.frame[,4] <- round((1-pt(abs(try.data.frame[,3]),df=n-(length(try2)+1)))*2,5)
vector <- rep(NA,length(names))
vector[is.na(try.data.frame[,4])] <- 0
maxi <- which.max(try.data.frame[,4])
continue <- max(try.data.frame[,4],na.rm=TRUE) > .05
vector[maxi] <- 0
list(summary=try.data.frame,next.vector=vector,continue=continue)
}
arimaSelect <- function(series, order=c(13,0,0), seasonal=list(order=c(2,0,0),period=12), include.mean=F){
nrc <- order[1]+order[3]+seasonal$order[1]+seasonal$order[3]
coeff <- matrix(NA, nrow=nrc*2, ncol=nrc)
pval <- matrix(NA, nrow=nrc*2, ncol=nrc)
mylist <- rep(list(NULL), nrc)
names <- NULL
if(order[1] > 0) names <- paste('ar',1:order[1],sep='')
if(order[3] > 0) names <- c( names , paste('ma',1:order[3],sep='') )
if(seasonal$order[1] > 0) names <- c(names, paste('sar',1:seasonal$order[1],sep=''))
if(seasonal$order[3] > 0) names <- c(names, paste('sma',1:seasonal$order[3],sep=''))
arima.out <- arima(series, order=order, seasonal=seasonal, include.mean=include.mean, method='ML')
mylist[[1]] <- arima.out
last.arma <- armaGR(arima.out, names, length(series))
mystop <- FALSE
i <- 1
coeff[i,] <- last.arma[[1]][,1]
pval [i,] <- last.arma[[1]][,4]
i <- 2
aic <- arima.out$aic
while(!mystop){
mylist[[i]] <- arima.out
arima.out <- arima(series, order=order, seasonal=seasonal, include.mean=include.mean, method='ML', fixed=last.arma$next.vector)
aic <- c(aic, arima.out$aic)
last.arma <- armaGR(arima.out, names, length(series))
mystop <- !last.arma$continue
coeff[i,] <- last.arma[[1]][,1]
pval [i,] <- last.arma[[1]][,4]
i <- i+1
}
list(coeff, pval, mylist, aic=aic)
}
arimaSelectplot <- function(arimaSelect.out,noms,choix){
noms <- names(arimaSelect.out[[3]][[1]]$coef)
coeff <- arimaSelect.out[[1]]
k <- min(which(is.na(coeff[,1])))-1
coeff <- coeff[1:k,]
pval <- arimaSelect.out[[2]][1:k,]
aic <- arimaSelect.out$aic[1:k]
coeff[coeff==0] <- NA
n <- ncol(coeff)
if(missing(choix)) choix <- k
layout(matrix(c(1,1,1,2,
3,3,3,2,
3,3,3,4,
5,6,7,7),nr=4),
widths=c(10,35,45,15),
heights=c(30,30,15,15))
couleurs <- rainbow(75)[1:50]#(50)
ticks <- pretty(coeff)
par(mar=c(1,1,3,1))
plot(aic,k:1-.5,type='o',pch=21,bg='blue',cex=2,axes=F,lty=2,xpd=NA)
points(aic[choix],k-choix+.5,pch=21,cex=4,bg=2,xpd=NA)
title('aic',line=2)
par(mar=c(3,0,0,0))
plot(0,axes=F,xlab='',ylab='',xlim=range(ticks),ylim=c(.1,1))
rect(xleft = min(ticks) + (0:49)/50*(max(ticks)-min(ticks)),
xright = min(ticks) + (1:50)/50*(max(ticks)-min(ticks)),
ytop = rep(1,50),
ybottom= rep(0,50),col=couleurs,border=NA)
axis(1,ticks)
rect(xleft=min(ticks),xright=max(ticks),ytop=1,ybottom=0)
text(mean(coeff,na.rm=T),.5,'coefficients',cex=2,font=2)
par(mar=c(1,1,3,1))
image(1:n,1:k,t(coeff[k:1,]),axes=F,col=couleurs,zlim=range(ticks))
for(i in 1:n) for(j in 1:k) if(!is.na(coeff[j,i])) {
if(pval[j,i]<.01) symb = 'green'
else if( (pval[j,i]<.05) & (pval[j,i]>=.01)) symb = 'orange'
else if( (pval[j,i]<.1) & (pval[j,i]>=.05)) symb = 'red'
else symb = 'black'
polygon(c(i+.5 ,i+.2 ,i+.5 ,i+.5),
c(k-j+0.5,k-j+0.5,k-j+0.8,k-j+0.5),
col=symb)
if(j==choix) {
rect(xleft=i-.5,
xright=i+.5,
ybottom=k-j+1.5,
ytop=k-j+.5,
lwd=4)
text(i,
k-j+1,
round(coeff[j,i],2),
cex=1.2,
font=2)
}
else{
rect(xleft=i-.5,xright=i+.5,ybottom=k-j+1.5,ytop=k-j+.5)
text(i,k-j+1,round(coeff[j,i],2),cex=1.2,font=1)
}
}
axis(3,1:n,noms)
par(mar=c(0.5,0,0,0.5))
plot(0,axes=F,xlab='',ylab='',type='n',xlim=c(0,8),ylim=c(-.2,.8))
cols <- c('green','orange','red','black')
niv <- c('0','0.01','0.05','0.1')
for(i in 0:3){
polygon(c(1+2*i ,1+2*i ,1+2*i-.5 ,1+2*i),
c(.4 ,.7 , .4 , .4),
col=cols[i+1])
text(2*i,0.5,niv[i+1],cex=1.5)
}
text(8,.5,1,cex=1.5)
text(4,0,'p-value',cex=2)
box()
residus <- arimaSelect.out[[3]][[choix]]$res
par(mar=c(1,2,4,1))
acf(residus,main='')
title('acf',line=.5)
par(mar=c(1,2,4,1))
pacf(residus,main='')
title('pacf',line=.5)
par(mar=c(2,2,4,1))
qqnorm(residus,main='')
title('qq-norm',line=.5)
qqline(residus)
residus
}
if (par2 == 0) x <- log(x)
if (par2 != 0) x <- x^par2
(selection <- arimaSelect(x, order=c(par6,par3,par7), seasonal=list(order=c(par8,par4,par9), period=par5)))
bitmap(file='test1.png')
resid <- arimaSelectplot(selection)
dev.off()
resid
bitmap(file='test2.png')
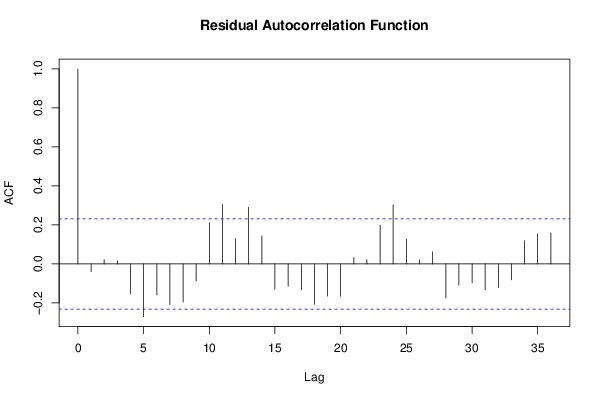
acf(resid,length(resid)/2, main='Residual Autocorrelation Function')
dev.off()
bitmap(file='test3.png')
pacf(resid,length(resid)/2, main='Residual Partial Autocorrelation Function')
dev.off()
bitmap(file='test4.png')
cpgram(resid, main='Residual Cumulative Periodogram')
dev.off()
bitmap(file='test5.png')
hist(resid, main='Residual Histogram', xlab='values of Residuals')
dev.off()
bitmap(file='test6.png')
densityplot(~resid,col='black',main='Residual Density Plot', xlab='values of Residuals')
dev.off()
bitmap(file='test7.png')
qqnorm(resid, main='Residual Normal Q-Q Plot')
qqline(resid)
dev.off()
ncols <- length(selection[[1]][1,])
nrows <- length(selection[[2]][,1])-1
load(file='createtable')
a<-table.start()
a<-table.row.start(a)
a<-table.element(a,'ARIMA Parameter Estimation and Backward Selection', ncols+1,TRUE)
a<-table.row.end(a)
a<-table.row.start(a)
a<-table.element(a,'Iteration', header=TRUE)
for (i in 1:ncols) {
a<-table.element(a,names(selection[[3]][[1]]$coef)[i],header=TRUE)
}
a<-table.row.end(a)
for (j in 1:nrows) {
a<-table.row.start(a)
mydum <- 'Estimates ('
mydum <- paste(mydum,j)
mydum <- paste(mydum,')')
a<-table.element(a,mydum, header=TRUE)
for (i in 1:ncols) {
a<-table.element(a,round(selection[[1]][j,i],4))
}
a<-table.row.end(a)
a<-table.row.start(a)
a<-table.element(a,'(p-val)', header=TRUE)
for (i in 1:ncols) {
mydum <- '('
mydum <- paste(mydum,round(selection[[2]][j,i],4),sep='')
mydum <- paste(mydum,')')
a<-table.element(a,mydum)
}
a<-table.row.end(a)
}
a<-table.end(a)
table.save(a,file='mytable.tab')
a<-table.start()
a<-table.row.start(a)
a<-table.element(a,'Estimated ARIMA Residuals', 1,TRUE)
a<-table.row.end(a)
a<-table.row.start(a)
a<-table.element(a,'Value', 1,TRUE)
a<-table.row.end(a)
for (i in (par4*par5+par3):length(resid)) {
a<-table.row.start(a)
a<-table.element(a,resid[i])
a<-table.row.end(a)
}
a<-table.end(a)
table.save(a,file='mytable1.tab')