Free Statistics

of Irreproducible Research!

Author's title

Author*The author of this computation has been verified*
R Software Modulerwasp_arimabackwardselection.wasp
Title produced by softwareARIMA Backward Selection
Date of computationFri, 22 Jan 2016 08:53:26 +0000
Cite this page as followsStatistical Computations at FreeStatistics.org, Office for Research Development and Education, URL https://freestatistics.org/blog/index.php?v=date/2016/Jan/22/t145345281323a9texp4rvk8gn.htm/, Retrieved Wed, 08 May 2024 03:15:31 +0000
Statistical Computations at FreeStatistics.org, Office for Research Development and Education, URL https://freestatistics.org/blog/index.php?pk=290517, Retrieved Wed, 08 May 2024 03:15:31 +0000
QR Codes:

Original text written by user:
IsPrivate?No (this computation is public)
User-defined keywords
Estimated Impact51
Family? (F = Feedback message, R = changed R code, M = changed R Module, P = changed Parameters, D = changed Data)
-       [ARIMA Backward Selection] [] [2016-01-22 08:53:26] [d42bb29750b9700c1c3b9062bc539f05] [Current]
Feedback Forum

Post a new message
Dataseries X:
3035
2552
2704
2554
2014
1655
1721
1524
1596
2074
2199
2512
2933
2889
2938
2497
1870
1726
1607
1545
1396
1787
2076
2837
2787
3891
3179
2011
1636
1580
1489
1300
1356
1653
2013
2823
3102
2294
2385
2444
1748
1554
1498
1361
1346
1564
1640
2293
2815
3137
2679
1969
1870
1633
1529
1366
1357
1570
1535
2491
3084
2605
2573
2143
1693
1504
1461
1354
1333
1492
1781
1915


Summary of computational transaction
Raw Inputview raw input (R code)
Raw Outputview raw output of R engine
Computing time4 seconds
R Server'George Udny Yule' @ yule.wessa.net

\begin{tabular}{lllllllll}
\hline
Summary of computational transaction \tabularnewline
Raw Input & view raw input (R code)  \tabularnewline
Raw Output & view raw output of R engine  \tabularnewline
Computing time & 4 seconds \tabularnewline
R Server & 'George Udny Yule' @ yule.wessa.net \tabularnewline
\hline
\end{tabular}
%Source: https://freestatistics.org/blog/index.php?pk=290517&T=0

[TABLE]
[ROW][C]Summary of computational transaction[/C][/ROW]
[ROW][C]Raw Input[/C][C]view raw input (R code) [/C][/ROW]
[ROW][C]Raw Output[/C][C]view raw output of R engine [/C][/ROW]
[ROW][C]Computing time[/C][C]4 seconds[/C][/ROW]
[ROW][C]R Server[/C][C]'George Udny Yule' @ yule.wessa.net[/C][/ROW]
[/TABLE]
Source: https://freestatistics.org/blog/index.php?pk=290517&T=0

Globally Unique Identifier (entire table): ba.freestatistics.org/blog/index.php?pk=290517&T=0

As an alternative you can also use a QR Code:  

The GUIDs for individual cells are displayed in the table below:

Summary of computational transaction
Raw Inputview raw input (R code)
Raw Outputview raw output of R engine
Computing time4 seconds
R Server'George Udny Yule' @ yule.wessa.net


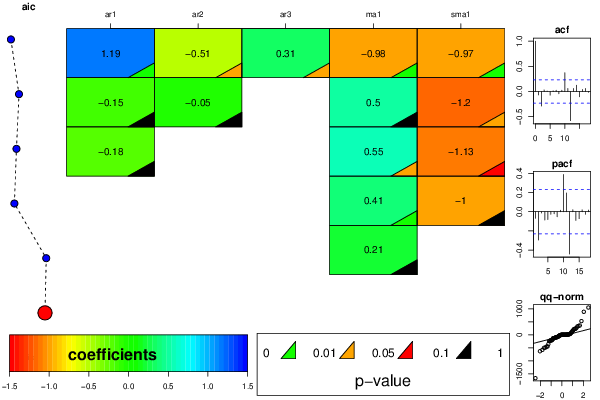
ARIMA Parameter Estimation and Backward Selection
Iterationar1ar2ar3ma1sma1
Estimates ( 1 )1.1941-0.50650.3124-0.9798-0.9675
(p-val)(0 )(0.0129 )(0.0235 )(0 )(0 )
Estimates ( 2 )-0.1453-0.045700.5037-1.1959
(p-val)(0.6835 )(0.8286 )(NA )(0.1372 )(0.0499 )
Estimates ( 3 )-0.1842000.5525-1.1345
(p-val)(0.5458 )(NA )(NA )(0.0236 )(0.0962 )
Estimates ( 4 )0000.4068-0.9998
(p-val)(NA )(NA )(NA )(0.0049 )(0.1258 )
Estimates ( 5 )0000.20950
(p-val)(NA )(NA )(NA )(0.2973 )(NA )
Estimates ( 6 )00000
(p-val)(NA )(NA )(NA )(NA )(NA )
Estimates ( 7 )NANANANANA
(p-val)(NA )(NA )(NA )(NA )(NA )
Estimates ( 8 )NANANANANA
(p-val)(NA )(NA )(NA )(NA )(NA )
Estimates ( 9 )NANANANANA
(p-val)(NA )(NA )(NA )(NA )(NA )

\begin{tabular}{lllllllll}
\hline
ARIMA Parameter Estimation and Backward Selection \tabularnewline
Iteration & ar1 & ar2 & ar3 & ma1 & sma1 \tabularnewline
Estimates ( 1 ) & 1.1941 & -0.5065 & 0.3124 & -0.9798 & -0.9675 \tabularnewline
(p-val) & (0 ) & (0.0129 ) & (0.0235 ) & (0 ) & (0 ) \tabularnewline
Estimates ( 2 ) & -0.1453 & -0.0457 & 0 & 0.5037 & -1.1959 \tabularnewline
(p-val) & (0.6835 ) & (0.8286 ) & (NA ) & (0.1372 ) & (0.0499 ) \tabularnewline
Estimates ( 3 ) & -0.1842 & 0 & 0 & 0.5525 & -1.1345 \tabularnewline
(p-val) & (0.5458 ) & (NA ) & (NA ) & (0.0236 ) & (0.0962 ) \tabularnewline
Estimates ( 4 ) & 0 & 0 & 0 & 0.4068 & -0.9998 \tabularnewline
(p-val) & (NA ) & (NA ) & (NA ) & (0.0049 ) & (0.1258 ) \tabularnewline
Estimates ( 5 ) & 0 & 0 & 0 & 0.2095 & 0 \tabularnewline
(p-val) & (NA ) & (NA ) & (NA ) & (0.2973 ) & (NA ) \tabularnewline
Estimates ( 6 ) & 0 & 0 & 0 & 0 & 0 \tabularnewline
(p-val) & (NA ) & (NA ) & (NA ) & (NA ) & (NA ) \tabularnewline
Estimates ( 7 ) & NA & NA & NA & NA & NA \tabularnewline
(p-val) & (NA ) & (NA ) & (NA ) & (NA ) & (NA ) \tabularnewline
Estimates ( 8 ) & NA & NA & NA & NA & NA \tabularnewline
(p-val) & (NA ) & (NA ) & (NA ) & (NA ) & (NA ) \tabularnewline
Estimates ( 9 ) & NA & NA & NA & NA & NA \tabularnewline
(p-val) & (NA ) & (NA ) & (NA ) & (NA ) & (NA ) \tabularnewline
\hline
\end{tabular}
%Source: https://freestatistics.org/blog/index.php?pk=290517&T=1

[TABLE]
[ROW][C]ARIMA Parameter Estimation and Backward Selection[/C][/ROW]
[ROW][C]Iteration[/C][C]ar1[/C][C]ar2[/C][C]ar3[/C][C]ma1[/C][C]sma1[/C][/ROW]
[ROW][C]Estimates ( 1 )[/C][C]1.1941[/C][C]-0.5065[/C][C]0.3124[/C][C]-0.9798[/C][C]-0.9675[/C][/ROW]
[ROW][C](p-val)[/C][C](0 )[/C][C](0.0129 )[/C][C](0.0235 )[/C][C](0 )[/C][C](0 )[/C][/ROW]
[ROW][C]Estimates ( 2 )[/C][C]-0.1453[/C][C]-0.0457[/C][C]0[/C][C]0.5037[/C][C]-1.1959[/C][/ROW]
[ROW][C](p-val)[/C][C](0.6835 )[/C][C](0.8286 )[/C][C](NA )[/C][C](0.1372 )[/C][C](0.0499 )[/C][/ROW]
[ROW][C]Estimates ( 3 )[/C][C]-0.1842[/C][C]0[/C][C]0[/C][C]0.5525[/C][C]-1.1345[/C][/ROW]
[ROW][C](p-val)[/C][C](0.5458 )[/C][C](NA )[/C][C](NA )[/C][C](0.0236 )[/C][C](0.0962 )[/C][/ROW]
[ROW][C]Estimates ( 4 )[/C][C]0[/C][C]0[/C][C]0[/C][C]0.4068[/C][C]-0.9998[/C][/ROW]
[ROW][C](p-val)[/C][C](NA )[/C][C](NA )[/C][C](NA )[/C][C](0.0049 )[/C][C](0.1258 )[/C][/ROW]
[ROW][C]Estimates ( 5 )[/C][C]0[/C][C]0[/C][C]0[/C][C]0.2095[/C][C]0[/C][/ROW]
[ROW][C](p-val)[/C][C](NA )[/C][C](NA )[/C][C](NA )[/C][C](0.2973 )[/C][C](NA )[/C][/ROW]
[ROW][C]Estimates ( 6 )[/C][C]0[/C][C]0[/C][C]0[/C][C]0[/C][C]0[/C][/ROW]
[ROW][C](p-val)[/C][C](NA )[/C][C](NA )[/C][C](NA )[/C][C](NA )[/C][C](NA )[/C][/ROW]
[ROW][C]Estimates ( 7 )[/C][C]NA[/C][C]NA[/C][C]NA[/C][C]NA[/C][C]NA[/C][/ROW]
[ROW][C](p-val)[/C][C](NA )[/C][C](NA )[/C][C](NA )[/C][C](NA )[/C][C](NA )[/C][/ROW]
[ROW][C]Estimates ( 8 )[/C][C]NA[/C][C]NA[/C][C]NA[/C][C]NA[/C][C]NA[/C][/ROW]
[ROW][C](p-val)[/C][C](NA )[/C][C](NA )[/C][C](NA )[/C][C](NA )[/C][C](NA )[/C][/ROW]
[ROW][C]Estimates ( 9 )[/C][C]NA[/C][C]NA[/C][C]NA[/C][C]NA[/C][C]NA[/C][/ROW]
[ROW][C](p-val)[/C][C](NA )[/C][C](NA )[/C][C](NA )[/C][C](NA )[/C][C](NA )[/C][/ROW]
[/TABLE]
Source: https://freestatistics.org/blog/index.php?pk=290517&T=1

Globally Unique Identifier (entire table): ba.freestatistics.org/blog/index.php?pk=290517&T=1

As an alternative you can also use a QR Code:  

The GUIDs for individual cells are displayed in the table below:

ARIMA Parameter Estimation and Backward Selection
Iterationar1ar2ar3ma1sma1
Estimates ( 1 )1.1941-0.50650.3124-0.9798-0.9675
(p-val)(0 )(0.0129 )(0.0235 )(0 )(0 )
Estimates ( 2 )-0.1453-0.045700.5037-1.1959
(p-val)(0.6835 )(0.8286 )(NA )(0.1372 )(0.0499 )
Estimates ( 3 )-0.1842000.5525-1.1345
(p-val)(0.5458 )(NA )(NA )(0.0236 )(0.0962 )
Estimates ( 4 )0000.4068-0.9998
(p-val)(NA )(NA )(NA )(0.0049 )(0.1258 )
Estimates ( 5 )0000.20950
(p-val)(NA )(NA )(NA )(0.2973 )(NA )
Estimates ( 6 )00000
(p-val)(NA )(NA )(NA )(NA )(NA )
Estimates ( 7 )NANANANANA
(p-val)(NA )(NA )(NA )(NA )(NA )
Estimates ( 8 )NANANANANA
(p-val)(NA )(NA )(NA )(NA )(NA )
Estimates ( 9 )NANANANANA
(p-val)(NA )(NA )(NA )(NA )(NA )


Estimated ARIMA Residuals
Value
2.51199822816355
-99.8330426289464
357.141936908044
159.238437220973
-90.3602108362018
-125.068840528182
97.2029151224329
-134.364784255572
49.1504916842264
-210.297419198496
-242.941016972121
-72.1019234251681
340.105926821397
-217.254898510222
1047.51663032757
21.5369289653023
-490.512158026458
-131.233799002628
-118.505474644677
-93.1721598999247
-225.479690961873
7.23978980550214
-135.516793584331
-34.6081531922894
-6.74931646665755
316.414035516261
-1663.2912587184
-445.527243486986
526.34150337517
1.72726599328439
-26.3618759725671
14.5230228252944
57.9573111321879
-22.1425179531561
-84.3609662608217
-355.325706155841
-455.55643659219
-191.557300848893
883.13277909513
108.976654097609
-497.831476357436
226.299656440742
31.588420900729
24.3819744152013
-0.108217691375103
11.0226724676265
3.69066239072663
-105.773223144121
220.160332077196
222.87465821658
-578.694014712415
15.2410017953198
170.806888823713
-212.785402627363
-84.4197646319487
-50.3133874291252
-1.4589448991369
-23.6943394321722
-73.0358473103224
261.301591289611
-630.744763023698

\begin{tabular}{lllllllll}
\hline
Estimated ARIMA Residuals \tabularnewline
Value \tabularnewline
2.51199822816355 \tabularnewline
-99.8330426289464 \tabularnewline
357.141936908044 \tabularnewline
159.238437220973 \tabularnewline
-90.3602108362018 \tabularnewline
-125.068840528182 \tabularnewline
97.2029151224329 \tabularnewline
-134.364784255572 \tabularnewline
49.1504916842264 \tabularnewline
-210.297419198496 \tabularnewline
-242.941016972121 \tabularnewline
-72.1019234251681 \tabularnewline
340.105926821397 \tabularnewline
-217.254898510222 \tabularnewline
1047.51663032757 \tabularnewline
21.5369289653023 \tabularnewline
-490.512158026458 \tabularnewline
-131.233799002628 \tabularnewline
-118.505474644677 \tabularnewline
-93.1721598999247 \tabularnewline
-225.479690961873 \tabularnewline
7.23978980550214 \tabularnewline
-135.516793584331 \tabularnewline
-34.6081531922894 \tabularnewline
-6.74931646665755 \tabularnewline
316.414035516261 \tabularnewline
-1663.2912587184 \tabularnewline
-445.527243486986 \tabularnewline
526.34150337517 \tabularnewline
1.72726599328439 \tabularnewline
-26.3618759725671 \tabularnewline
14.5230228252944 \tabularnewline
57.9573111321879 \tabularnewline
-22.1425179531561 \tabularnewline
-84.3609662608217 \tabularnewline
-355.325706155841 \tabularnewline
-455.55643659219 \tabularnewline
-191.557300848893 \tabularnewline
883.13277909513 \tabularnewline
108.976654097609 \tabularnewline
-497.831476357436 \tabularnewline
226.299656440742 \tabularnewline
31.588420900729 \tabularnewline
24.3819744152013 \tabularnewline
-0.108217691375103 \tabularnewline
11.0226724676265 \tabularnewline
3.69066239072663 \tabularnewline
-105.773223144121 \tabularnewline
220.160332077196 \tabularnewline
222.87465821658 \tabularnewline
-578.694014712415 \tabularnewline
15.2410017953198 \tabularnewline
170.806888823713 \tabularnewline
-212.785402627363 \tabularnewline
-84.4197646319487 \tabularnewline
-50.3133874291252 \tabularnewline
-1.4589448991369 \tabularnewline
-23.6943394321722 \tabularnewline
-73.0358473103224 \tabularnewline
261.301591289611 \tabularnewline
-630.744763023698 \tabularnewline
\hline
\end{tabular}
%Source: https://freestatistics.org/blog/index.php?pk=290517&T=2

[TABLE]
[ROW][C]Estimated ARIMA Residuals[/C][/ROW]
[ROW][C]Value[/C][/ROW]
[ROW][C]2.51199822816355[/C][/ROW]
[ROW][C]-99.8330426289464[/C][/ROW]
[ROW][C]357.141936908044[/C][/ROW]
[ROW][C]159.238437220973[/C][/ROW]
[ROW][C]-90.3602108362018[/C][/ROW]
[ROW][C]-125.068840528182[/C][/ROW]
[ROW][C]97.2029151224329[/C][/ROW]
[ROW][C]-134.364784255572[/C][/ROW]
[ROW][C]49.1504916842264[/C][/ROW]
[ROW][C]-210.297419198496[/C][/ROW]
[ROW][C]-242.941016972121[/C][/ROW]
[ROW][C]-72.1019234251681[/C][/ROW]
[ROW][C]340.105926821397[/C][/ROW]
[ROW][C]-217.254898510222[/C][/ROW]
[ROW][C]1047.51663032757[/C][/ROW]
[ROW][C]21.5369289653023[/C][/ROW]
[ROW][C]-490.512158026458[/C][/ROW]
[ROW][C]-131.233799002628[/C][/ROW]
[ROW][C]-118.505474644677[/C][/ROW]
[ROW][C]-93.1721598999247[/C][/ROW]
[ROW][C]-225.479690961873[/C][/ROW]
[ROW][C]7.23978980550214[/C][/ROW]
[ROW][C]-135.516793584331[/C][/ROW]
[ROW][C]-34.6081531922894[/C][/ROW]
[ROW][C]-6.74931646665755[/C][/ROW]
[ROW][C]316.414035516261[/C][/ROW]
[ROW][C]-1663.2912587184[/C][/ROW]
[ROW][C]-445.527243486986[/C][/ROW]
[ROW][C]526.34150337517[/C][/ROW]
[ROW][C]1.72726599328439[/C][/ROW]
[ROW][C]-26.3618759725671[/C][/ROW]
[ROW][C]14.5230228252944[/C][/ROW]
[ROW][C]57.9573111321879[/C][/ROW]
[ROW][C]-22.1425179531561[/C][/ROW]
[ROW][C]-84.3609662608217[/C][/ROW]
[ROW][C]-355.325706155841[/C][/ROW]
[ROW][C]-455.55643659219[/C][/ROW]
[ROW][C]-191.557300848893[/C][/ROW]
[ROW][C]883.13277909513[/C][/ROW]
[ROW][C]108.976654097609[/C][/ROW]
[ROW][C]-497.831476357436[/C][/ROW]
[ROW][C]226.299656440742[/C][/ROW]
[ROW][C]31.588420900729[/C][/ROW]
[ROW][C]24.3819744152013[/C][/ROW]
[ROW][C]-0.108217691375103[/C][/ROW]
[ROW][C]11.0226724676265[/C][/ROW]
[ROW][C]3.69066239072663[/C][/ROW]
[ROW][C]-105.773223144121[/C][/ROW]
[ROW][C]220.160332077196[/C][/ROW]
[ROW][C]222.87465821658[/C][/ROW]
[ROW][C]-578.694014712415[/C][/ROW]
[ROW][C]15.2410017953198[/C][/ROW]
[ROW][C]170.806888823713[/C][/ROW]
[ROW][C]-212.785402627363[/C][/ROW]
[ROW][C]-84.4197646319487[/C][/ROW]
[ROW][C]-50.3133874291252[/C][/ROW]
[ROW][C]-1.4589448991369[/C][/ROW]
[ROW][C]-23.6943394321722[/C][/ROW]
[ROW][C]-73.0358473103224[/C][/ROW]
[ROW][C]261.301591289611[/C][/ROW]
[ROW][C]-630.744763023698[/C][/ROW]
[/TABLE]
Source: https://freestatistics.org/blog/index.php?pk=290517&T=2

Globally Unique Identifier (entire table): ba.freestatistics.org/blog/index.php?pk=290517&T=2

As an alternative you can also use a QR Code:  

The GUIDs for individual cells are displayed in the table below:

Estimated ARIMA Residuals
Value
2.51199822816355
-99.8330426289464
357.141936908044
159.238437220973
-90.3602108362018
-125.068840528182
97.2029151224329
-134.364784255572
49.1504916842264
-210.297419198496
-242.941016972121
-72.1019234251681
340.105926821397
-217.254898510222
1047.51663032757
21.5369289653023
-490.512158026458
-131.233799002628
-118.505474644677
-93.1721598999247
-225.479690961873
7.23978980550214
-135.516793584331
-34.6081531922894
-6.74931646665755
316.414035516261
-1663.2912587184
-445.527243486986
526.34150337517
1.72726599328439
-26.3618759725671
14.5230228252944
57.9573111321879
-22.1425179531561
-84.3609662608217
-355.325706155841
-455.55643659219
-191.557300848893
883.13277909513
108.976654097609
-497.831476357436
226.299656440742
31.588420900729
24.3819744152013
-0.108217691375103
11.0226724676265
3.69066239072663
-105.773223144121
220.160332077196
222.87465821658
-578.694014712415
15.2410017953198
170.806888823713
-212.785402627363
-84.4197646319487
-50.3133874291252
-1.4589448991369
-23.6943394321722
-73.0358473103224
261.301591289611
-630.744763023698


Parameters (Session):
par1 = 12 ; par2 = Triple ; par3 = additive ;
Parameters (R input):
par1 = TRUE ; par2 = 1 ; par3 = 0 ; par4 = 1 ; par5 = 12 ; par6 = 3 ; par7 = 1 ; par8 = 0 ; par9 = 1 ;
R code (references can be found in the software module):
par9 <- '1'
par8 <- '2'
par7 <- '1'
par6 <- '3'
par5 <- '12'
par4 <- '1'
par3 <- '0'
par2 <- '1'
par1 <- 'TRUE'
library(lattice)
if (par1 == 'TRUE') par1 <- TRUE
if (par1 == 'FALSE') par1 <- FALSE
par2 <- as.numeric(par2) #Box-Cox lambda transformation parameter
par3 <- as.numeric(par3) #degree of non-seasonal differencing
par4 <- as.numeric(par4) #degree of seasonal differencing
par5 <- as.numeric(par5) #seasonal period
par6 <- as.numeric(par6) #degree (p) of the non-seasonal AR(p) polynomial
par7 <- as.numeric(par7) #degree (q) of the non-seasonal MA(q) polynomial
par8 <- as.numeric(par8) #degree (P) of the seasonal AR(P) polynomial
par9 <- as.numeric(par9) #degree (Q) of the seasonal MA(Q) polynomial
armaGR <- function(arima.out, names, n){
try1 <- arima.out$coef
try2 <- sqrt(diag(arima.out$var.coef))
try.data.frame <- data.frame(matrix(NA,ncol=4,nrow=length(names)))
dimnames(try.data.frame) <- list(names,c('coef','std','tstat','pv'))
try.data.frame[,1] <- try1
for(i in 1:length(try2)) try.data.frame[which(rownames(try.data.frame)==names(try2)[i]),2] <- try2[i]
try.data.frame[,3] <- try.data.frame[,1] / try.data.frame[,2]
try.data.frame[,4] <- round((1-pt(abs(try.data.frame[,3]),df=n-(length(try2)+1)))*2,5)
vector <- rep(NA,length(names))
vector[is.na(try.data.frame[,4])] <- 0
maxi <- which.max(try.data.frame[,4])
continue <- max(try.data.frame[,4],na.rm=TRUE) > .05
vector[maxi] <- 0
list(summary=try.data.frame,next.vector=vector,continue=continue)
}
arimaSelect <- function(series, order=c(13,0,0), seasonal=list(order=c(2,0,0),period=12), include.mean=F){
nrc <- order[1]+order[3]+seasonal$order[1]+seasonal$order[3]
coeff <- matrix(NA, nrow=nrc*2, ncol=nrc)
pval <- matrix(NA, nrow=nrc*2, ncol=nrc)
mylist <- rep(list(NULL), nrc)
names <- NULL
if(order[1] > 0) names <- paste('ar',1:order[1],sep='')
if(order[3] > 0) names <- c( names , paste('ma',1:order[3],sep='') )
if(seasonal$order[1] > 0) names <- c(names, paste('sar',1:seasonal$order[1],sep=''))
if(seasonal$order[3] > 0) names <- c(names, paste('sma',1:seasonal$order[3],sep=''))
arima.out <- arima(series, order=order, seasonal=seasonal, include.mean=include.mean, method='ML')
mylist[[1]] <- arima.out
last.arma <- armaGR(arima.out, names, length(series))
mystop <- FALSE
i <- 1
coeff[i,] <- last.arma[[1]][,1]
pval [i,] <- last.arma[[1]][,4]
i <- 2
aic <- arima.out$aic
while(!mystop){
mylist[[i]] <- arima.out
arima.out <- arima(series, order=order, seasonal=seasonal, include.mean=include.mean, method='ML', fixed=last.arma$next.vector)
aic <- c(aic, arima.out$aic)
last.arma <- armaGR(arima.out, names, length(series))
mystop <- !last.arma$continue
coeff[i,] <- last.arma[[1]][,1]
pval [i,] <- last.arma[[1]][,4]
i <- i+1
}
list(coeff, pval, mylist, aic=aic)
}
arimaSelectplot <- function(arimaSelect.out,noms,choix){
noms <- names(arimaSelect.out[[3]][[1]]$coef)
coeff <- arimaSelect.out[[1]]
k <- min(which(is.na(coeff[,1])))-1
coeff <- coeff[1:k,]
pval <- arimaSelect.out[[2]][1:k,]
aic <- arimaSelect.out$aic[1:k]
coeff[coeff==0] <- NA
n <- ncol(coeff)
if(missing(choix)) choix <- k
layout(matrix(c(1,1,1,2,
3,3,3,2,
3,3,3,4,
5,6,7,7),nr=4),
widths=c(10,35,45,15),
heights=c(30,30,15,15))
couleurs <- rainbow(75)[1:50]#(50)
ticks <- pretty(coeff)
par(mar=c(1,1,3,1))
plot(aic,k:1-.5,type='o',pch=21,bg='blue',cex=2,axes=F,lty=2,xpd=NA)
points(aic[choix],k-choix+.5,pch=21,cex=4,bg=2,xpd=NA)
title('aic',line=2)
par(mar=c(3,0,0,0))
plot(0,axes=F,xlab='',ylab='',xlim=range(ticks),ylim=c(.1,1))
rect(xleft = min(ticks) + (0:49)/50*(max(ticks)-min(ticks)),
xright = min(ticks) + (1:50)/50*(max(ticks)-min(ticks)),
ytop = rep(1,50),
ybottom= rep(0,50),col=couleurs,border=NA)
axis(1,ticks)
rect(xleft=min(ticks),xright=max(ticks),ytop=1,ybottom=0)
text(mean(coeff,na.rm=T),.5,'coefficients',cex=2,font=2)
par(mar=c(1,1,3,1))
image(1:n,1:k,t(coeff[k:1,]),axes=F,col=couleurs,zlim=range(ticks))
for(i in 1:n) for(j in 1:k) if(!is.na(coeff[j,i])) {
if(pval[j,i]<.01) symb = 'green'
else if( (pval[j,i]<.05) & (pval[j,i]>=.01)) symb = 'orange'
else if( (pval[j,i]<.1) & (pval[j,i]>=.05)) symb = 'red'
else symb = 'black'
polygon(c(i+.5 ,i+.2 ,i+.5 ,i+.5),
c(k-j+0.5,k-j+0.5,k-j+0.8,k-j+0.5),
col=symb)
if(j==choix) {
rect(xleft=i-.5,
xright=i+.5,
ybottom=k-j+1.5,
ytop=k-j+.5,
lwd=4)
text(i,
k-j+1,
round(coeff[j,i],2),
cex=1.2,
font=2)
}
else{
rect(xleft=i-.5,xright=i+.5,ybottom=k-j+1.5,ytop=k-j+.5)
text(i,k-j+1,round(coeff[j,i],2),cex=1.2,font=1)
}
}
axis(3,1:n,noms)
par(mar=c(0.5,0,0,0.5))
plot(0,axes=F,xlab='',ylab='',type='n',xlim=c(0,8),ylim=c(-.2,.8))
cols <- c('green','orange','red','black')
niv <- c('0','0.01','0.05','0.1')
for(i in 0:3){
polygon(c(1+2*i ,1+2*i ,1+2*i-.5 ,1+2*i),
c(.4 ,.7 , .4 , .4),
col=cols[i+1])
text(2*i,0.5,niv[i+1],cex=1.5)
}
text(8,.5,1,cex=1.5)
text(4,0,'p-value',cex=2)
box()
residus <- arimaSelect.out[[3]][[choix]]$res
par(mar=c(1,2,4,1))
acf(residus,main='')
title('acf',line=.5)
par(mar=c(1,2,4,1))
pacf(residus,main='')
title('pacf',line=.5)
par(mar=c(2,2,4,1))
qqnorm(residus,main='')
title('qq-norm',line=.5)
qqline(residus)
residus
}
if (par2 == 0) x <- log(x)
if (par2 != 0) x <- x^par2
(selection <- arimaSelect(x, order=c(par6,par3,par7), seasonal=list(order=c(par8,par4,par9), period=par5)))
bitmap(file='test1.png')
resid <- arimaSelectplot(selection)
dev.off()
resid
bitmap(file='test2.png')
acf(resid,length(resid)/2, main='Residual Autocorrelation Function')
dev.off()
bitmap(file='test3.png')
pacf(resid,length(resid)/2, main='Residual Partial Autocorrelation Function')
dev.off()
bitmap(file='test4.png')
cpgram(resid, main='Residual Cumulative Periodogram')
dev.off()
bitmap(file='test5.png')
hist(resid, main='Residual Histogram', xlab='values of Residuals')
dev.off()
bitmap(file='test6.png')
densityplot(~resid,col='black',main='Residual Density Plot', xlab='values of Residuals')
dev.off()
bitmap(file='test7.png')
qqnorm(resid, main='Residual Normal Q-Q Plot')
qqline(resid)
dev.off()
ncols <- length(selection[[1]][1,])
nrows <- length(selection[[2]][,1])-1
load(file='createtable')
a<-table.start()
a<-table.row.start(a)
a<-table.element(a,'ARIMA Parameter Estimation and Backward Selection', ncols+1,TRUE)
a<-table.row.end(a)
a<-table.row.start(a)
a<-table.element(a,'Iteration', header=TRUE)
for (i in 1:ncols) {
a<-table.element(a,names(selection[[3]][[1]]$coef)[i],header=TRUE)
}
a<-table.row.end(a)
for (j in 1:nrows) {
a<-table.row.start(a)
mydum <- 'Estimates ('
mydum <- paste(mydum,j)
mydum <- paste(mydum,')')
a<-table.element(a,mydum, header=TRUE)
for (i in 1:ncols) {
a<-table.element(a,round(selection[[1]][j,i],4))
}
a<-table.row.end(a)
a<-table.row.start(a)
a<-table.element(a,'(p-val)', header=TRUE)
for (i in 1:ncols) {
mydum <- '('
mydum <- paste(mydum,round(selection[[2]][j,i],4),sep='')
mydum <- paste(mydum,')')
a<-table.element(a,mydum)
}
a<-table.row.end(a)
}
a<-table.end(a)
table.save(a,file='mytable.tab')
a<-table.start()
a<-table.row.start(a)
a<-table.element(a,'Estimated ARIMA Residuals', 1,TRUE)
a<-table.row.end(a)
a<-table.row.start(a)
a<-table.element(a,'Value', 1,TRUE)
a<-table.row.end(a)
for (i in (par4*par5+par3):length(resid)) {
a<-table.row.start(a)
a<-table.element(a,resid[i])
a<-table.row.end(a)
}
a<-table.end(a)
table.save(a,file='mytable1.tab')