Free Statistics

of Irreproducible Research!

Author's title

Author*The author of this computation has been verified*
R Software Modulerwasp_arimabackwardselection.wasp
Title produced by softwareARIMA Backward Selection
Date of computationFri, 22 Jan 2016 09:53:56 +0000
Cite this page as followsStatistical Computations at FreeStatistics.org, Office for Research Development and Education, URL https://freestatistics.org/blog/index.php?v=date/2016/Jan/22/t1453456560fbuo8ik2k9rxynx.htm/, Retrieved Tue, 07 May 2024 16:29:42 +0000
Statistical Computations at FreeStatistics.org, Office for Research Development and Education, URL https://freestatistics.org/blog/index.php?pk=291174, Retrieved Tue, 07 May 2024 16:29:42 +0000
QR Codes:

Original text written by user:
IsPrivate?No (this computation is public)
User-defined keywords
Estimated Impact34
Family? (F = Feedback message, R = changed R code, M = changed R Module, P = changed Parameters, D = changed Data)
-       [ARIMA Backward Selection] [EX11] [2016-01-22 09:53:56] [35e7b9ed56e3b903c23a8574643f2583] [Current]
Feedback Forum

Post a new message
Dataseries X:
3035
2552
2704
2554
2014
1655
1721
1524
1596
2074
2199
2512
2933
2889
2938
2497
1870
1726
1607
1545
1396
1787
2076
2837
2787
3891
3179
2011
1636
1580
1489
1300
1356
1653
2013
2823
3102
2294
2385
2444
1748
1554
1498
1361
1346
1564
1640
2293
2815
3137
2679
1969
1870
1633
1529
1366
1357
1570
1535
2491
3084
2605
2573
2143
1693
1504
1461
1354
1333
1492
1781
1915


Summary of computational transaction
Raw Inputview raw input (R code)
Raw Outputview raw output of R engine
Computing time7 seconds
R Server'Sir Ronald Aylmer Fisher' @ fisher.wessa.net

\begin{tabular}{lllllllll}
\hline
Summary of computational transaction \tabularnewline
Raw Input & view raw input (R code)  \tabularnewline
Raw Output & view raw output of R engine  \tabularnewline
Computing time & 7 seconds \tabularnewline
R Server & 'Sir Ronald Aylmer Fisher' @ fisher.wessa.net \tabularnewline
\hline
\end{tabular}
%Source: https://freestatistics.org/blog/index.php?pk=291174&T=0

[TABLE]
[ROW][C]Summary of computational transaction[/C][/ROW]
[ROW][C]Raw Input[/C][C]view raw input (R code) [/C][/ROW]
[ROW][C]Raw Output[/C][C]view raw output of R engine [/C][/ROW]
[ROW][C]Computing time[/C][C]7 seconds[/C][/ROW]
[ROW][C]R Server[/C][C]'Sir Ronald Aylmer Fisher' @ fisher.wessa.net[/C][/ROW]
[/TABLE]
Source: https://freestatistics.org/blog/index.php?pk=291174&T=0

Globally Unique Identifier (entire table): ba.freestatistics.org/blog/index.php?pk=291174&T=0

As an alternative you can also use a QR Code:  

The GUIDs for individual cells are displayed in the table below:

Summary of computational transaction
Raw Inputview raw input (R code)
Raw Outputview raw output of R engine
Computing time7 seconds
R Server'Sir Ronald Aylmer Fisher' @ fisher.wessa.net


ARIMA Parameter Estimation and Backward Selection
Iterationar1ar2ar3ma1sar1sar2sma1
Estimates ( 1 )1.4932-0.71180.2161-0.94190.61980.37-0.7186
(p-val)(0 )(0.0023 )(0.1021 )(0 )(0 )(0.0072 )(0 )
Estimates ( 2 )0.39320.485900.60470.60840.3879-0.8788
(p-val)(0.3712 )(0.2327 )(NA )(0.1455 )(0 )(0.0028 )(0 )
Estimates ( 3 )00.880200.98160.6150.3815-0.8789
(p-val)(NA )(0 )(NA )(0 )(0 )(0.0034 )(0 )
Estimates ( 4 )NANANANANANANA
(p-val)(NA )(NA )(NA )(NA )(NA )(NA )(NA )
Estimates ( 5 )NANANANANANANA
(p-val)(NA )(NA )(NA )(NA )(NA )(NA )(NA )
Estimates ( 6 )NANANANANANANA
(p-val)(NA )(NA )(NA )(NA )(NA )(NA )(NA )
Estimates ( 7 )NANANANANANANA
(p-val)(NA )(NA )(NA )(NA )(NA )(NA )(NA )
Estimates ( 8 )NANANANANANANA
(p-val)(NA )(NA )(NA )(NA )(NA )(NA )(NA )
Estimates ( 9 )NANANANANANANA
(p-val)(NA )(NA )(NA )(NA )(NA )(NA )(NA )
Estimates ( 10 )NANANANANANANA
(p-val)(NA )(NA )(NA )(NA )(NA )(NA )(NA )
Estimates ( 11 )NANANANANANANA
(p-val)(NA )(NA )(NA )(NA )(NA )(NA )(NA )
Estimates ( 12 )NANANANANANANA
(p-val)(NA )(NA )(NA )(NA )(NA )(NA )(NA )
Estimates ( 13 )NANANANANANANA
(p-val)(NA )(NA )(NA )(NA )(NA )(NA )(NA )

\begin{tabular}{lllllllll}
\hline
ARIMA Parameter Estimation and Backward Selection \tabularnewline
Iteration & ar1 & ar2 & ar3 & ma1 & sar1 & sar2 & sma1 \tabularnewline
Estimates ( 1 ) & 1.4932 & -0.7118 & 0.2161 & -0.9419 & 0.6198 & 0.37 & -0.7186 \tabularnewline
(p-val) & (0 ) & (0.0023 ) & (0.1021 ) & (0 ) & (0 ) & (0.0072 ) & (0 ) \tabularnewline
Estimates ( 2 ) & 0.3932 & 0.4859 & 0 & 0.6047 & 0.6084 & 0.3879 & -0.8788 \tabularnewline
(p-val) & (0.3712 ) & (0.2327 ) & (NA ) & (0.1455 ) & (0 ) & (0.0028 ) & (0 ) \tabularnewline
Estimates ( 3 ) & 0 & 0.8802 & 0 & 0.9816 & 0.615 & 0.3815 & -0.8789 \tabularnewline
(p-val) & (NA ) & (0 ) & (NA ) & (0 ) & (0 ) & (0.0034 ) & (0 ) \tabularnewline
Estimates ( 4 ) & NA & NA & NA & NA & NA & NA & NA \tabularnewline
(p-val) & (NA ) & (NA ) & (NA ) & (NA ) & (NA ) & (NA ) & (NA ) \tabularnewline
Estimates ( 5 ) & NA & NA & NA & NA & NA & NA & NA \tabularnewline
(p-val) & (NA ) & (NA ) & (NA ) & (NA ) & (NA ) & (NA ) & (NA ) \tabularnewline
Estimates ( 6 ) & NA & NA & NA & NA & NA & NA & NA \tabularnewline
(p-val) & (NA ) & (NA ) & (NA ) & (NA ) & (NA ) & (NA ) & (NA ) \tabularnewline
Estimates ( 7 ) & NA & NA & NA & NA & NA & NA & NA \tabularnewline
(p-val) & (NA ) & (NA ) & (NA ) & (NA ) & (NA ) & (NA ) & (NA ) \tabularnewline
Estimates ( 8 ) & NA & NA & NA & NA & NA & NA & NA \tabularnewline
(p-val) & (NA ) & (NA ) & (NA ) & (NA ) & (NA ) & (NA ) & (NA ) \tabularnewline
Estimates ( 9 ) & NA & NA & NA & NA & NA & NA & NA \tabularnewline
(p-val) & (NA ) & (NA ) & (NA ) & (NA ) & (NA ) & (NA ) & (NA ) \tabularnewline
Estimates ( 10 ) & NA & NA & NA & NA & NA & NA & NA \tabularnewline
(p-val) & (NA ) & (NA ) & (NA ) & (NA ) & (NA ) & (NA ) & (NA ) \tabularnewline
Estimates ( 11 ) & NA & NA & NA & NA & NA & NA & NA \tabularnewline
(p-val) & (NA ) & (NA ) & (NA ) & (NA ) & (NA ) & (NA ) & (NA ) \tabularnewline
Estimates ( 12 ) & NA & NA & NA & NA & NA & NA & NA \tabularnewline
(p-val) & (NA ) & (NA ) & (NA ) & (NA ) & (NA ) & (NA ) & (NA ) \tabularnewline
Estimates ( 13 ) & NA & NA & NA & NA & NA & NA & NA \tabularnewline
(p-val) & (NA ) & (NA ) & (NA ) & (NA ) & (NA ) & (NA ) & (NA ) \tabularnewline
\hline
\end{tabular}
%Source: https://freestatistics.org/blog/index.php?pk=291174&T=1

[TABLE]
[ROW][C]ARIMA Parameter Estimation and Backward Selection[/C][/ROW]
[ROW][C]Iteration[/C][C]ar1[/C][C]ar2[/C][C]ar3[/C][C]ma1[/C][C]sar1[/C][C]sar2[/C][C]sma1[/C][/ROW]
[ROW][C]Estimates ( 1 )[/C][C]1.4932[/C][C]-0.7118[/C][C]0.2161[/C][C]-0.9419[/C][C]0.6198[/C][C]0.37[/C][C]-0.7186[/C][/ROW]
[ROW][C](p-val)[/C][C](0 )[/C][C](0.0023 )[/C][C](0.1021 )[/C][C](0 )[/C][C](0 )[/C][C](0.0072 )[/C][C](0 )[/C][/ROW]
[ROW][C]Estimates ( 2 )[/C][C]0.3932[/C][C]0.4859[/C][C]0[/C][C]0.6047[/C][C]0.6084[/C][C]0.3879[/C][C]-0.8788[/C][/ROW]
[ROW][C](p-val)[/C][C](0.3712 )[/C][C](0.2327 )[/C][C](NA )[/C][C](0.1455 )[/C][C](0 )[/C][C](0.0028 )[/C][C](0 )[/C][/ROW]
[ROW][C]Estimates ( 3 )[/C][C]0[/C][C]0.8802[/C][C]0[/C][C]0.9816[/C][C]0.615[/C][C]0.3815[/C][C]-0.8789[/C][/ROW]
[ROW][C](p-val)[/C][C](NA )[/C][C](0 )[/C][C](NA )[/C][C](0 )[/C][C](0 )[/C][C](0.0034 )[/C][C](0 )[/C][/ROW]
[ROW][C]Estimates ( 4 )[/C][C]NA[/C][C]NA[/C][C]NA[/C][C]NA[/C][C]NA[/C][C]NA[/C][C]NA[/C][/ROW]
[ROW][C](p-val)[/C][C](NA )[/C][C](NA )[/C][C](NA )[/C][C](NA )[/C][C](NA )[/C][C](NA )[/C][C](NA )[/C][/ROW]
[ROW][C]Estimates ( 5 )[/C][C]NA[/C][C]NA[/C][C]NA[/C][C]NA[/C][C]NA[/C][C]NA[/C][C]NA[/C][/ROW]
[ROW][C](p-val)[/C][C](NA )[/C][C](NA )[/C][C](NA )[/C][C](NA )[/C][C](NA )[/C][C](NA )[/C][C](NA )[/C][/ROW]
[ROW][C]Estimates ( 6 )[/C][C]NA[/C][C]NA[/C][C]NA[/C][C]NA[/C][C]NA[/C][C]NA[/C][C]NA[/C][/ROW]
[ROW][C](p-val)[/C][C](NA )[/C][C](NA )[/C][C](NA )[/C][C](NA )[/C][C](NA )[/C][C](NA )[/C][C](NA )[/C][/ROW]
[ROW][C]Estimates ( 7 )[/C][C]NA[/C][C]NA[/C][C]NA[/C][C]NA[/C][C]NA[/C][C]NA[/C][C]NA[/C][/ROW]
[ROW][C](p-val)[/C][C](NA )[/C][C](NA )[/C][C](NA )[/C][C](NA )[/C][C](NA )[/C][C](NA )[/C][C](NA )[/C][/ROW]
[ROW][C]Estimates ( 8 )[/C][C]NA[/C][C]NA[/C][C]NA[/C][C]NA[/C][C]NA[/C][C]NA[/C][C]NA[/C][/ROW]
[ROW][C](p-val)[/C][C](NA )[/C][C](NA )[/C][C](NA )[/C][C](NA )[/C][C](NA )[/C][C](NA )[/C][C](NA )[/C][/ROW]
[ROW][C]Estimates ( 9 )[/C][C]NA[/C][C]NA[/C][C]NA[/C][C]NA[/C][C]NA[/C][C]NA[/C][C]NA[/C][/ROW]
[ROW][C](p-val)[/C][C](NA )[/C][C](NA )[/C][C](NA )[/C][C](NA )[/C][C](NA )[/C][C](NA )[/C][C](NA )[/C][/ROW]
[ROW][C]Estimates ( 10 )[/C][C]NA[/C][C]NA[/C][C]NA[/C][C]NA[/C][C]NA[/C][C]NA[/C][C]NA[/C][/ROW]
[ROW][C](p-val)[/C][C](NA )[/C][C](NA )[/C][C](NA )[/C][C](NA )[/C][C](NA )[/C][C](NA )[/C][C](NA )[/C][/ROW]
[ROW][C]Estimates ( 11 )[/C][C]NA[/C][C]NA[/C][C]NA[/C][C]NA[/C][C]NA[/C][C]NA[/C][C]NA[/C][/ROW]
[ROW][C](p-val)[/C][C](NA )[/C][C](NA )[/C][C](NA )[/C][C](NA )[/C][C](NA )[/C][C](NA )[/C][C](NA )[/C][/ROW]
[ROW][C]Estimates ( 12 )[/C][C]NA[/C][C]NA[/C][C]NA[/C][C]NA[/C][C]NA[/C][C]NA[/C][C]NA[/C][/ROW]
[ROW][C](p-val)[/C][C](NA )[/C][C](NA )[/C][C](NA )[/C][C](NA )[/C][C](NA )[/C][C](NA )[/C][C](NA )[/C][/ROW]
[ROW][C]Estimates ( 13 )[/C][C]NA[/C][C]NA[/C][C]NA[/C][C]NA[/C][C]NA[/C][C]NA[/C][C]NA[/C][/ROW]
[ROW][C](p-val)[/C][C](NA )[/C][C](NA )[/C][C](NA )[/C][C](NA )[/C][C](NA )[/C][C](NA )[/C][C](NA )[/C][/ROW]
[/TABLE]
Source: https://freestatistics.org/blog/index.php?pk=291174&T=1

Globally Unique Identifier (entire table): ba.freestatistics.org/blog/index.php?pk=291174&T=1

As an alternative you can also use a QR Code:  

The GUIDs for individual cells are displayed in the table below:

ARIMA Parameter Estimation and Backward Selection
Iterationar1ar2ar3ma1sar1sar2sma1
Estimates ( 1 )1.4932-0.71180.2161-0.94190.61980.37-0.7186
(p-val)(0 )(0.0023 )(0.1021 )(0 )(0 )(0.0072 )(0 )
Estimates ( 2 )0.39320.485900.60470.60840.3879-0.8788
(p-val)(0.3712 )(0.2327 )(NA )(0.1455 )(0 )(0.0028 )(0 )
Estimates ( 3 )00.880200.98160.6150.3815-0.8789
(p-val)(NA )(0 )(NA )(0 )(0 )(0.0034 )(0 )
Estimates ( 4 )NANANANANANANA
(p-val)(NA )(NA )(NA )(NA )(NA )(NA )(NA )
Estimates ( 5 )NANANANANANANA
(p-val)(NA )(NA )(NA )(NA )(NA )(NA )(NA )
Estimates ( 6 )NANANANANANANA
(p-val)(NA )(NA )(NA )(NA )(NA )(NA )(NA )
Estimates ( 7 )NANANANANANANA
(p-val)(NA )(NA )(NA )(NA )(NA )(NA )(NA )
Estimates ( 8 )NANANANANANANA
(p-val)(NA )(NA )(NA )(NA )(NA )(NA )(NA )
Estimates ( 9 )NANANANANANANA
(p-val)(NA )(NA )(NA )(NA )(NA )(NA )(NA )
Estimates ( 10 )NANANANANANANA
(p-val)(NA )(NA )(NA )(NA )(NA )(NA )(NA )
Estimates ( 11 )NANANANANANANA
(p-val)(NA )(NA )(NA )(NA )(NA )(NA )(NA )
Estimates ( 12 )NANANANANANANA
(p-val)(NA )(NA )(NA )(NA )(NA )(NA )(NA )
Estimates ( 13 )NANANANANANANA
(p-val)(NA )(NA )(NA )(NA )(NA )(NA )(NA )


Estimated ARIMA Residuals
Value
567.586419383542
-220.916245328906
178.780580682371
-54.207756420842
-275.707905595398
-204.924297614148
33.8323008769745
-157.636895678833
16.1884812111362
242.51928260802
41.5643550202599
169.450029219193
259.765142046181
148.222147093809
39.7198635952239
-214.495880068286
-243.199659214342
3.43770779560538
-125.705054426027
-9.03871753107845
-175.07154864558
80.5681414792557
96.120304887107
397.955498714391
-165.812784778399
1212.26085246507
-676.924086310337
-692.801003534482
11.0716883248863
124.654009739776
-113.776123509763
-68.6445828959069
1.6207282642477
-77.4135722982368
171.629627394597
365.498112161275
66.4327196264601
-498.521414373952
20.4584185613441
246.763360817199
-178.387207183437
14.2688769049711
-39.4671720591321
-40.8545232428984
13.9766566368335
-150.07261019688
-112.349617955654
110.358731448486
343.257194817231
-45.6631894435067
-200.529071299545
-67.2024484080619
293.312487801781
-102.663532203613
-26.6166908637283
-46.5961827227173
3.83269996441012
-145.731010048395
-285.613032318494
308.608417414979
391.560314080632
-364.939242911473
54.1651410974544
-99.096896109847
136.016998355021
-62.5688079934243
13.3920662642582
1.78667199854654
-6.54647450956943
-164.920654778241
44.2824106358796
-431.061671510956

\begin{tabular}{lllllllll}
\hline
Estimated ARIMA Residuals \tabularnewline
Value \tabularnewline
 \tabularnewline
567.586419383542 \tabularnewline
-220.916245328906 \tabularnewline
178.780580682371 \tabularnewline
-54.207756420842 \tabularnewline
-275.707905595398 \tabularnewline
-204.924297614148 \tabularnewline
33.8323008769745 \tabularnewline
-157.636895678833 \tabularnewline
16.1884812111362 \tabularnewline
242.51928260802 \tabularnewline
41.5643550202599 \tabularnewline
169.450029219193 \tabularnewline
259.765142046181 \tabularnewline
148.222147093809 \tabularnewline
39.7198635952239 \tabularnewline
-214.495880068286 \tabularnewline
-243.199659214342 \tabularnewline
3.43770779560538 \tabularnewline
-125.705054426027 \tabularnewline
-9.03871753107845 \tabularnewline
-175.07154864558 \tabularnewline
80.5681414792557 \tabularnewline
96.120304887107 \tabularnewline
397.955498714391 \tabularnewline
-165.812784778399 \tabularnewline
1212.26085246507 \tabularnewline
-676.924086310337 \tabularnewline
-692.801003534482 \tabularnewline
11.0716883248863 \tabularnewline
124.654009739776 \tabularnewline
-113.776123509763 \tabularnewline
-68.6445828959069 \tabularnewline
1.6207282642477 \tabularnewline
-77.4135722982368 \tabularnewline
171.629627394597 \tabularnewline
365.498112161275 \tabularnewline
66.4327196264601 \tabularnewline
-498.521414373952 \tabularnewline
20.4584185613441 \tabularnewline
246.763360817199 \tabularnewline
-178.387207183437 \tabularnewline
14.2688769049711 \tabularnewline
-39.4671720591321 \tabularnewline
-40.8545232428984 \tabularnewline
13.9766566368335 \tabularnewline
-150.07261019688 \tabularnewline
-112.349617955654 \tabularnewline
110.358731448486 \tabularnewline
343.257194817231 \tabularnewline
-45.6631894435067 \tabularnewline
-200.529071299545 \tabularnewline
-67.2024484080619 \tabularnewline
293.312487801781 \tabularnewline
-102.663532203613 \tabularnewline
-26.6166908637283 \tabularnewline
-46.5961827227173 \tabularnewline
3.83269996441012 \tabularnewline
-145.731010048395 \tabularnewline
-285.613032318494 \tabularnewline
308.608417414979 \tabularnewline
391.560314080632 \tabularnewline
-364.939242911473 \tabularnewline
54.1651410974544 \tabularnewline
-99.096896109847 \tabularnewline
136.016998355021 \tabularnewline
-62.5688079934243 \tabularnewline
13.3920662642582 \tabularnewline
1.78667199854654 \tabularnewline
-6.54647450956943 \tabularnewline
-164.920654778241 \tabularnewline
44.2824106358796 \tabularnewline
-431.061671510956 \tabularnewline
\hline
\end{tabular}
%Source: https://freestatistics.org/blog/index.php?pk=291174&T=2

[TABLE]
[ROW][C]Estimated ARIMA Residuals[/C][/ROW]
[ROW][C]Value[/C][/ROW]
[ROW][C][/C][/ROW]
[ROW][C]567.586419383542[/C][/ROW]
[ROW][C]-220.916245328906[/C][/ROW]
[ROW][C]178.780580682371[/C][/ROW]
[ROW][C]-54.207756420842[/C][/ROW]
[ROW][C]-275.707905595398[/C][/ROW]
[ROW][C]-204.924297614148[/C][/ROW]
[ROW][C]33.8323008769745[/C][/ROW]
[ROW][C]-157.636895678833[/C][/ROW]
[ROW][C]16.1884812111362[/C][/ROW]
[ROW][C]242.51928260802[/C][/ROW]
[ROW][C]41.5643550202599[/C][/ROW]
[ROW][C]169.450029219193[/C][/ROW]
[ROW][C]259.765142046181[/C][/ROW]
[ROW][C]148.222147093809[/C][/ROW]
[ROW][C]39.7198635952239[/C][/ROW]
[ROW][C]-214.495880068286[/C][/ROW]
[ROW][C]-243.199659214342[/C][/ROW]
[ROW][C]3.43770779560538[/C][/ROW]
[ROW][C]-125.705054426027[/C][/ROW]
[ROW][C]-9.03871753107845[/C][/ROW]
[ROW][C]-175.07154864558[/C][/ROW]
[ROW][C]80.5681414792557[/C][/ROW]
[ROW][C]96.120304887107[/C][/ROW]
[ROW][C]397.955498714391[/C][/ROW]
[ROW][C]-165.812784778399[/C][/ROW]
[ROW][C]1212.26085246507[/C][/ROW]
[ROW][C]-676.924086310337[/C][/ROW]
[ROW][C]-692.801003534482[/C][/ROW]
[ROW][C]11.0716883248863[/C][/ROW]
[ROW][C]124.654009739776[/C][/ROW]
[ROW][C]-113.776123509763[/C][/ROW]
[ROW][C]-68.6445828959069[/C][/ROW]
[ROW][C]1.6207282642477[/C][/ROW]
[ROW][C]-77.4135722982368[/C][/ROW]
[ROW][C]171.629627394597[/C][/ROW]
[ROW][C]365.498112161275[/C][/ROW]
[ROW][C]66.4327196264601[/C][/ROW]
[ROW][C]-498.521414373952[/C][/ROW]
[ROW][C]20.4584185613441[/C][/ROW]
[ROW][C]246.763360817199[/C][/ROW]
[ROW][C]-178.387207183437[/C][/ROW]
[ROW][C]14.2688769049711[/C][/ROW]
[ROW][C]-39.4671720591321[/C][/ROW]
[ROW][C]-40.8545232428984[/C][/ROW]
[ROW][C]13.9766566368335[/C][/ROW]
[ROW][C]-150.07261019688[/C][/ROW]
[ROW][C]-112.349617955654[/C][/ROW]
[ROW][C]110.358731448486[/C][/ROW]
[ROW][C]343.257194817231[/C][/ROW]
[ROW][C]-45.6631894435067[/C][/ROW]
[ROW][C]-200.529071299545[/C][/ROW]
[ROW][C]-67.2024484080619[/C][/ROW]
[ROW][C]293.312487801781[/C][/ROW]
[ROW][C]-102.663532203613[/C][/ROW]
[ROW][C]-26.6166908637283[/C][/ROW]
[ROW][C]-46.5961827227173[/C][/ROW]
[ROW][C]3.83269996441012[/C][/ROW]
[ROW][C]-145.731010048395[/C][/ROW]
[ROW][C]-285.613032318494[/C][/ROW]
[ROW][C]308.608417414979[/C][/ROW]
[ROW][C]391.560314080632[/C][/ROW]
[ROW][C]-364.939242911473[/C][/ROW]
[ROW][C]54.1651410974544[/C][/ROW]
[ROW][C]-99.096896109847[/C][/ROW]
[ROW][C]136.016998355021[/C][/ROW]
[ROW][C]-62.5688079934243[/C][/ROW]
[ROW][C]13.3920662642582[/C][/ROW]
[ROW][C]1.78667199854654[/C][/ROW]
[ROW][C]-6.54647450956943[/C][/ROW]
[ROW][C]-164.920654778241[/C][/ROW]
[ROW][C]44.2824106358796[/C][/ROW]
[ROW][C]-431.061671510956[/C][/ROW]
[/TABLE]
Source: https://freestatistics.org/blog/index.php?pk=291174&T=2

Globally Unique Identifier (entire table): ba.freestatistics.org/blog/index.php?pk=291174&T=2

As an alternative you can also use a QR Code:  

The GUIDs for individual cells are displayed in the table below:

Estimated ARIMA Residuals
Value
567.586419383542
-220.916245328906
178.780580682371
-54.207756420842
-275.707905595398
-204.924297614148
33.8323008769745
-157.636895678833
16.1884812111362
242.51928260802
41.5643550202599
169.450029219193
259.765142046181
148.222147093809
39.7198635952239
-214.495880068286
-243.199659214342
3.43770779560538
-125.705054426027
-9.03871753107845
-175.07154864558
80.5681414792557
96.120304887107
397.955498714391
-165.812784778399
1212.26085246507
-676.924086310337
-692.801003534482
11.0716883248863
124.654009739776
-113.776123509763
-68.6445828959069
1.6207282642477
-77.4135722982368
171.629627394597
365.498112161275
66.4327196264601
-498.521414373952
20.4584185613441
246.763360817199
-178.387207183437
14.2688769049711
-39.4671720591321
-40.8545232428984
13.9766566368335
-150.07261019688
-112.349617955654
110.358731448486
343.257194817231
-45.6631894435067
-200.529071299545
-67.2024484080619
293.312487801781
-102.663532203613
-26.6166908637283
-46.5961827227173
3.83269996441012
-145.731010048395
-285.613032318494
308.608417414979
391.560314080632
-364.939242911473
54.1651410974544
-99.096896109847
136.016998355021
-62.5688079934243
13.3920662642582
1.78667199854654
-6.54647450956943
-164.920654778241
44.2824106358796
-431.061671510956


Parameters (Session):
par1 = 2 ; par2 = 1 ; par3 = TRUE ;
Parameters (R input):
par1 = FALSE ; par2 = 1 ; par3 = 0 ; par4 = 0 ; par5 = 12 ; par6 = 3 ; par7 = 1 ; par8 = 2 ; par9 = 1 ;
R code (references can be found in the software module):
library(lattice)
if (par1 == 'TRUE') par1 <- TRUE
if (par1 == 'FALSE') par1 <- FALSE
par2 <- as.numeric(par2) #Box-Cox lambda transformation parameter
par3 <- as.numeric(par3) #degree of non-seasonal differencing
par4 <- as.numeric(par4) #degree of seasonal differencing
par5 <- as.numeric(par5) #seasonal period
par6 <- as.numeric(par6) #degree (p) of the non-seasonal AR(p) polynomial
par7 <- as.numeric(par7) #degree (q) of the non-seasonal MA(q) polynomial
par8 <- as.numeric(par8) #degree (P) of the seasonal AR(P) polynomial
par9 <- as.numeric(par9) #degree (Q) of the seasonal MA(Q) polynomial
armaGR <- function(arima.out, names, n){
try1 <- arima.out$coef
try2 <- sqrt(diag(arima.out$var.coef))
try.data.frame <- data.frame(matrix(NA,ncol=4,nrow=length(names)))
dimnames(try.data.frame) <- list(names,c('coef','std','tstat','pv'))
try.data.frame[,1] <- try1
for(i in 1:length(try2)) try.data.frame[which(rownames(try.data.frame)==names(try2)[i]),2] <- try2[i]
try.data.frame[,3] <- try.data.frame[,1] / try.data.frame[,2]
try.data.frame[,4] <- round((1-pt(abs(try.data.frame[,3]),df=n-(length(try2)+1)))*2,5)
vector <- rep(NA,length(names))
vector[is.na(try.data.frame[,4])] <- 0
maxi <- which.max(try.data.frame[,4])
continue <- max(try.data.frame[,4],na.rm=TRUE) > .05
vector[maxi] <- 0
list(summary=try.data.frame,next.vector=vector,continue=continue)
}
arimaSelect <- function(series, order=c(13,0,0), seasonal=list(order=c(2,0,0),period=12), include.mean=F){
nrc <- order[1]+order[3]+seasonal$order[1]+seasonal$order[3]
coeff <- matrix(NA, nrow=nrc*2, ncol=nrc)
pval <- matrix(NA, nrow=nrc*2, ncol=nrc)
mylist <- rep(list(NULL), nrc)
names <- NULL
if(order[1] > 0) names <- paste('ar',1:order[1],sep='')
if(order[3] > 0) names <- c( names , paste('ma',1:order[3],sep='') )
if(seasonal$order[1] > 0) names <- c(names, paste('sar',1:seasonal$order[1],sep=''))
if(seasonal$order[3] > 0) names <- c(names, paste('sma',1:seasonal$order[3],sep=''))
arima.out <- arima(series, order=order, seasonal=seasonal, include.mean=include.mean, method='ML')
mylist[[1]] <- arima.out
last.arma <- armaGR(arima.out, names, length(series))
mystop <- FALSE
i <- 1
coeff[i,] <- last.arma[[1]][,1]
pval [i,] <- last.arma[[1]][,4]
i <- 2
aic <- arima.out$aic
while(!mystop){
mylist[[i]] <- arima.out
arima.out <- arima(series, order=order, seasonal=seasonal, include.mean=include.mean, method='ML', fixed=last.arma$next.vector)
aic <- c(aic, arima.out$aic)
last.arma <- armaGR(arima.out, names, length(series))
mystop <- !last.arma$continue
coeff[i,] <- last.arma[[1]][,1]
pval [i,] <- last.arma[[1]][,4]
i <- i+1
}
list(coeff, pval, mylist, aic=aic)
}
arimaSelectplot <- function(arimaSelect.out,noms,choix){
noms <- names(arimaSelect.out[[3]][[1]]$coef)
coeff <- arimaSelect.out[[1]]
k <- min(which(is.na(coeff[,1])))-1
coeff <- coeff[1:k,]
pval <- arimaSelect.out[[2]][1:k,]
aic <- arimaSelect.out$aic[1:k]
coeff[coeff==0] <- NA
n <- ncol(coeff)
if(missing(choix)) choix <- k
layout(matrix(c(1,1,1,2,
3,3,3,2,
3,3,3,4,
5,6,7,7),nr=4),
widths=c(10,35,45,15),
heights=c(30,30,15,15))
couleurs <- rainbow(75)[1:50]#(50)
ticks <- pretty(coeff)
par(mar=c(1,1,3,1))
plot(aic,k:1-.5,type='o',pch=21,bg='blue',cex=2,axes=F,lty=2,xpd=NA)
points(aic[choix],k-choix+.5,pch=21,cex=4,bg=2,xpd=NA)
title('aic',line=2)
par(mar=c(3,0,0,0))
plot(0,axes=F,xlab='',ylab='',xlim=range(ticks),ylim=c(.1,1))
rect(xleft = min(ticks) + (0:49)/50*(max(ticks)-min(ticks)),
xright = min(ticks) + (1:50)/50*(max(ticks)-min(ticks)),
ytop = rep(1,50),
ybottom= rep(0,50),col=couleurs,border=NA)
axis(1,ticks)
rect(xleft=min(ticks),xright=max(ticks),ytop=1,ybottom=0)
text(mean(coeff,na.rm=T),.5,'coefficients',cex=2,font=2)
par(mar=c(1,1,3,1))
image(1:n,1:k,t(coeff[k:1,]),axes=F,col=couleurs,zlim=range(ticks))
for(i in 1:n) for(j in 1:k) if(!is.na(coeff[j,i])) {
if(pval[j,i]<.01) symb = 'green'
else if( (pval[j,i]<.05) & (pval[j,i]>=.01)) symb = 'orange'
else if( (pval[j,i]<.1) & (pval[j,i]>=.05)) symb = 'red'
else symb = 'black'
polygon(c(i+.5 ,i+.2 ,i+.5 ,i+.5),
c(k-j+0.5,k-j+0.5,k-j+0.8,k-j+0.5),
col=symb)
if(j==choix) {
rect(xleft=i-.5,
xright=i+.5,
ybottom=k-j+1.5,
ytop=k-j+.5,
lwd=4)
text(i,
k-j+1,
round(coeff[j,i],2),
cex=1.2,
font=2)
}
else{
rect(xleft=i-.5,xright=i+.5,ybottom=k-j+1.5,ytop=k-j+.5)
text(i,k-j+1,round(coeff[j,i],2),cex=1.2,font=1)
}
}
axis(3,1:n,noms)
par(mar=c(0.5,0,0,0.5))
plot(0,axes=F,xlab='',ylab='',type='n',xlim=c(0,8),ylim=c(-.2,.8))
cols <- c('green','orange','red','black')
niv <- c('0','0.01','0.05','0.1')
for(i in 0:3){
polygon(c(1+2*i ,1+2*i ,1+2*i-.5 ,1+2*i),
c(.4 ,.7 , .4 , .4),
col=cols[i+1])
text(2*i,0.5,niv[i+1],cex=1.5)
}
text(8,.5,1,cex=1.5)
text(4,0,'p-value',cex=2)
box()
residus <- arimaSelect.out[[3]][[choix]]$res
par(mar=c(1,2,4,1))
acf(residus,main='')
title('acf',line=.5)
par(mar=c(1,2,4,1))
pacf(residus,main='')
title('pacf',line=.5)
par(mar=c(2,2,4,1))
qqnorm(residus,main='')
title('qq-norm',line=.5)
qqline(residus)
residus
}
if (par2 == 0) x <- log(x)
if (par2 != 0) x <- x^par2
(selection <- arimaSelect(x, order=c(par6,par3,par7), seasonal=list(order=c(par8,par4,par9), period=par5)))
bitmap(file='test1.png')
resid <- arimaSelectplot(selection)
dev.off()
resid
bitmap(file='test2.png')
acf(resid,length(resid)/2, main='Residual Autocorrelation Function')
dev.off()
bitmap(file='test3.png')
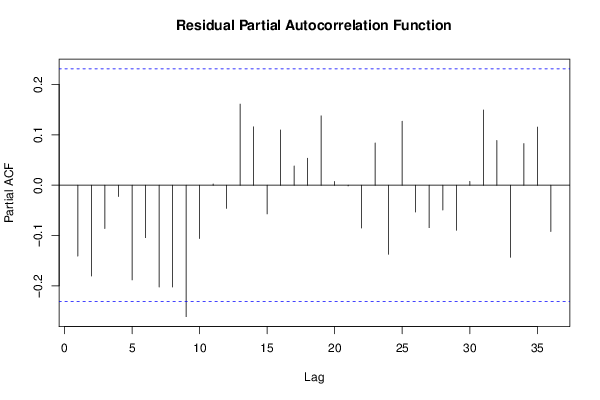
pacf(resid,length(resid)/2, main='Residual Partial Autocorrelation Function')
dev.off()
bitmap(file='test4.png')
cpgram(resid, main='Residual Cumulative Periodogram')
dev.off()
bitmap(file='test5.png')
hist(resid, main='Residual Histogram', xlab='values of Residuals')
dev.off()
bitmap(file='test6.png')
densityplot(~resid,col='black',main='Residual Density Plot', xlab='values of Residuals')
dev.off()
bitmap(file='test7.png')
qqnorm(resid, main='Residual Normal Q-Q Plot')
qqline(resid)
dev.off()
ncols <- length(selection[[1]][1,])
nrows <- length(selection[[2]][,1])-1
load(file='createtable')
a<-table.start()
a<-table.row.start(a)
a<-table.element(a,'ARIMA Parameter Estimation and Backward Selection', ncols+1,TRUE)
a<-table.row.end(a)
a<-table.row.start(a)
a<-table.element(a,'Iteration', header=TRUE)
for (i in 1:ncols) {
a<-table.element(a,names(selection[[3]][[1]]$coef)[i],header=TRUE)
}
a<-table.row.end(a)
for (j in 1:nrows) {
a<-table.row.start(a)
mydum <- 'Estimates ('
mydum <- paste(mydum,j)
mydum <- paste(mydum,')')
a<-table.element(a,mydum, header=TRUE)
for (i in 1:ncols) {
a<-table.element(a,round(selection[[1]][j,i],4))
}
a<-table.row.end(a)
a<-table.row.start(a)
a<-table.element(a,'(p-val)', header=TRUE)
for (i in 1:ncols) {
mydum <- '('
mydum <- paste(mydum,round(selection[[2]][j,i],4),sep='')
mydum <- paste(mydum,')')
a<-table.element(a,mydum)
}
a<-table.row.end(a)
}
a<-table.end(a)
table.save(a,file='mytable.tab')
a<-table.start()
a<-table.row.start(a)
a<-table.element(a,'Estimated ARIMA Residuals', 1,TRUE)
a<-table.row.end(a)
a<-table.row.start(a)
a<-table.element(a,'Value', 1,TRUE)
a<-table.row.end(a)
for (i in (par4*par5+par3):length(resid)) {
a<-table.row.start(a)
a<-table.element(a,resid[i])
a<-table.row.end(a)
}
a<-table.end(a)
table.save(a,file='mytable1.tab')