Free Statistics

of Irreproducible Research!

Author's title

Author*The author of this computation has been verified*
R Software Modulerwasp_arimabackwardselection.wasp
Title produced by softwareARIMA Backward Selection
Date of computationFri, 22 Jan 2016 10:36:04 +0000
Cite this page as followsStatistical Computations at FreeStatistics.org, Office for Research Development and Education, URL https://freestatistics.org/blog/index.php?v=date/2016/Jan/22/t1453458974nmtqiqodu9xa286.htm/, Retrieved Tue, 07 May 2024 23:51:04 +0000
Statistical Computations at FreeStatistics.org, Office for Research Development and Education, URL https://freestatistics.org/blog/index.php?pk=291465, Retrieved Tue, 07 May 2024 23:51:04 +0000
QR Codes:

Original text written by user:
IsPrivate?No (this computation is public)
User-defined keywords
Estimated Impact45
Family? (F = Feedback message, R = changed R code, M = changed R Module, P = changed Parameters, D = changed Data)
-       [ARIMA Backward Selection] [] [2016-01-22 10:36:04] [6b467dc9c4b5eae42d9a994c430e0089] [Current]
Feedback Forum

Post a new message
Dataseries X:
3035
2552
2704
2554
2014
1655
1721
1524
1596
2074
2199
2512
2933
2889
2938
2497
1870
1726
1607
1545
1396
1787
2076
2837
2787
3891
3179
2011
1636
1580
1489
1300
1356
1653
2013
2823
3102
2294
2385
2444
1748
1554
1498
1361
1346
1564
1640
2293
2815
3137
2679
1969
1870
1633
1529
1366
1357
1570
1535
2491
3084
2605
2573
2143
1693
1504
1461
1354
1333
1492
1781
1915


Summary of computational transaction
Raw Inputview raw input (R code)
Raw Outputview raw output of R engine
Computing time4 seconds
R Server'Gwilym Jenkins' @ jenkins.wessa.net

\begin{tabular}{lllllllll}
\hline
Summary of computational transaction \tabularnewline
Raw Input & view raw input (R code)  \tabularnewline
Raw Output & view raw output of R engine  \tabularnewline
Computing time & 4 seconds \tabularnewline
R Server & 'Gwilym Jenkins' @ jenkins.wessa.net \tabularnewline
\hline
\end{tabular}
%Source: https://freestatistics.org/blog/index.php?pk=291465&T=0

[TABLE]
[ROW][C]Summary of computational transaction[/C][/ROW]
[ROW][C]Raw Input[/C][C]view raw input (R code) [/C][/ROW]
[ROW][C]Raw Output[/C][C]view raw output of R engine [/C][/ROW]
[ROW][C]Computing time[/C][C]4 seconds[/C][/ROW]
[ROW][C]R Server[/C][C]'Gwilym Jenkins' @ jenkins.wessa.net[/C][/ROW]
[/TABLE]
Source: https://freestatistics.org/blog/index.php?pk=291465&T=0

Globally Unique Identifier (entire table): ba.freestatistics.org/blog/index.php?pk=291465&T=0

As an alternative you can also use a QR Code:  

The GUIDs for individual cells are displayed in the table below:

Summary of computational transaction
Raw Inputview raw input (R code)
Raw Outputview raw output of R engine
Computing time4 seconds
R Server'Gwilym Jenkins' @ jenkins.wessa.net


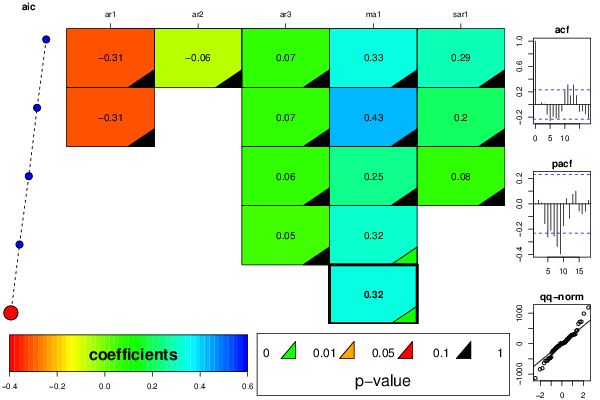
ARIMA Parameter Estimation and Backward Selection
Iterationar1ar2ar3ma1sar1
Estimates ( 1 )-0.3078-0.06230.07010.33390.2936
(p-val)(0.6212 )(0.7923 )(0.5992 )(0.6045 )(0.4445 )
Estimates ( 2 )-0.306100.06870.42590.2016
(p-val)(0.6093 )(NA )(0.6064 )(0.4142 )(0.403 )
Estimates ( 3 )000.06160.24660.0778
(p-val)(NA )(NA )(0.6475 )(0.6 )(0.8717 )
Estimates ( 4 )000.04980.31980
(p-val)(NA )(NA )(0.675 )(0.0064 )(NA )
Estimates ( 5 )0000.32080
(p-val)(NA )(NA )(NA )(0.0083 )(NA )
Estimates ( 6 )NANANANANA
(p-val)(NA )(NA )(NA )(NA )(NA )
Estimates ( 7 )NANANANANA
(p-val)(NA )(NA )(NA )(NA )(NA )
Estimates ( 8 )NANANANANA
(p-val)(NA )(NA )(NA )(NA )(NA )
Estimates ( 9 )NANANANANA
(p-val)(NA )(NA )(NA )(NA )(NA )

\begin{tabular}{lllllllll}
\hline
ARIMA Parameter Estimation and Backward Selection \tabularnewline
Iteration & ar1 & ar2 & ar3 & ma1 & sar1 \tabularnewline
Estimates ( 1 ) & -0.3078 & -0.0623 & 0.0701 & 0.3339 & 0.2936 \tabularnewline
(p-val) & (0.6212 ) & (0.7923 ) & (0.5992 ) & (0.6045 ) & (0.4445 ) \tabularnewline
Estimates ( 2 ) & -0.3061 & 0 & 0.0687 & 0.4259 & 0.2016 \tabularnewline
(p-val) & (0.6093 ) & (NA ) & (0.6064 ) & (0.4142 ) & (0.403 ) \tabularnewline
Estimates ( 3 ) & 0 & 0 & 0.0616 & 0.2466 & 0.0778 \tabularnewline
(p-val) & (NA ) & (NA ) & (0.6475 ) & (0.6 ) & (0.8717 ) \tabularnewline
Estimates ( 4 ) & 0 & 0 & 0.0498 & 0.3198 & 0 \tabularnewline
(p-val) & (NA ) & (NA ) & (0.675 ) & (0.0064 ) & (NA ) \tabularnewline
Estimates ( 5 ) & 0 & 0 & 0 & 0.3208 & 0 \tabularnewline
(p-val) & (NA ) & (NA ) & (NA ) & (0.0083 ) & (NA ) \tabularnewline
Estimates ( 6 ) & NA & NA & NA & NA & NA \tabularnewline
(p-val) & (NA ) & (NA ) & (NA ) & (NA ) & (NA ) \tabularnewline
Estimates ( 7 ) & NA & NA & NA & NA & NA \tabularnewline
(p-val) & (NA ) & (NA ) & (NA ) & (NA ) & (NA ) \tabularnewline
Estimates ( 8 ) & NA & NA & NA & NA & NA \tabularnewline
(p-val) & (NA ) & (NA ) & (NA ) & (NA ) & (NA ) \tabularnewline
Estimates ( 9 ) & NA & NA & NA & NA & NA \tabularnewline
(p-val) & (NA ) & (NA ) & (NA ) & (NA ) & (NA ) \tabularnewline
\hline
\end{tabular}
%Source: https://freestatistics.org/blog/index.php?pk=291465&T=1

[TABLE]
[ROW][C]ARIMA Parameter Estimation and Backward Selection[/C][/ROW]
[ROW][C]Iteration[/C][C]ar1[/C][C]ar2[/C][C]ar3[/C][C]ma1[/C][C]sar1[/C][/ROW]
[ROW][C]Estimates ( 1 )[/C][C]-0.3078[/C][C]-0.0623[/C][C]0.0701[/C][C]0.3339[/C][C]0.2936[/C][/ROW]
[ROW][C](p-val)[/C][C](0.6212 )[/C][C](0.7923 )[/C][C](0.5992 )[/C][C](0.6045 )[/C][C](0.4445 )[/C][/ROW]
[ROW][C]Estimates ( 2 )[/C][C]-0.3061[/C][C]0[/C][C]0.0687[/C][C]0.4259[/C][C]0.2016[/C][/ROW]
[ROW][C](p-val)[/C][C](0.6093 )[/C][C](NA )[/C][C](0.6064 )[/C][C](0.4142 )[/C][C](0.403 )[/C][/ROW]
[ROW][C]Estimates ( 3 )[/C][C]0[/C][C]0[/C][C]0.0616[/C][C]0.2466[/C][C]0.0778[/C][/ROW]
[ROW][C](p-val)[/C][C](NA )[/C][C](NA )[/C][C](0.6475 )[/C][C](0.6 )[/C][C](0.8717 )[/C][/ROW]
[ROW][C]Estimates ( 4 )[/C][C]0[/C][C]0[/C][C]0.0498[/C][C]0.3198[/C][C]0[/C][/ROW]
[ROW][C](p-val)[/C][C](NA )[/C][C](NA )[/C][C](0.675 )[/C][C](0.0064 )[/C][C](NA )[/C][/ROW]
[ROW][C]Estimates ( 5 )[/C][C]0[/C][C]0[/C][C]0[/C][C]0.3208[/C][C]0[/C][/ROW]
[ROW][C](p-val)[/C][C](NA )[/C][C](NA )[/C][C](NA )[/C][C](0.0083 )[/C][C](NA )[/C][/ROW]
[ROW][C]Estimates ( 6 )[/C][C]NA[/C][C]NA[/C][C]NA[/C][C]NA[/C][C]NA[/C][/ROW]
[ROW][C](p-val)[/C][C](NA )[/C][C](NA )[/C][C](NA )[/C][C](NA )[/C][C](NA )[/C][/ROW]
[ROW][C]Estimates ( 7 )[/C][C]NA[/C][C]NA[/C][C]NA[/C][C]NA[/C][C]NA[/C][/ROW]
[ROW][C](p-val)[/C][C](NA )[/C][C](NA )[/C][C](NA )[/C][C](NA )[/C][C](NA )[/C][/ROW]
[ROW][C]Estimates ( 8 )[/C][C]NA[/C][C]NA[/C][C]NA[/C][C]NA[/C][C]NA[/C][/ROW]
[ROW][C](p-val)[/C][C](NA )[/C][C](NA )[/C][C](NA )[/C][C](NA )[/C][C](NA )[/C][/ROW]
[ROW][C]Estimates ( 9 )[/C][C]NA[/C][C]NA[/C][C]NA[/C][C]NA[/C][C]NA[/C][/ROW]
[ROW][C](p-val)[/C][C](NA )[/C][C](NA )[/C][C](NA )[/C][C](NA )[/C][C](NA )[/C][/ROW]
[/TABLE]
Source: https://freestatistics.org/blog/index.php?pk=291465&T=1

Globally Unique Identifier (entire table): ba.freestatistics.org/blog/index.php?pk=291465&T=1

As an alternative you can also use a QR Code:  

The GUIDs for individual cells are displayed in the table below:

ARIMA Parameter Estimation and Backward Selection
Iterationar1ar2ar3ma1sar1
Estimates ( 1 )-0.3078-0.06230.07010.33390.2936
(p-val)(0.6212 )(0.7923 )(0.5992 )(0.6045 )(0.4445 )
Estimates ( 2 )-0.306100.06870.42590.2016
(p-val)(0.6093 )(NA )(0.6064 )(0.4142 )(0.403 )
Estimates ( 3 )000.06160.24660.0778
(p-val)(NA )(NA )(0.6475 )(0.6 )(0.8717 )
Estimates ( 4 )000.04980.31980
(p-val)(NA )(NA )(0.675 )(0.0064 )(NA )
Estimates ( 5 )0000.32080
(p-val)(NA )(NA )(NA )(0.0083 )(NA )
Estimates ( 6 )NANANANANA
(p-val)(NA )(NA )(NA )(NA )(NA )
Estimates ( 7 )NANANANANA
(p-val)(NA )(NA )(NA )(NA )(NA )
Estimates ( 8 )NANANANANA
(p-val)(NA )(NA )(NA )(NA )(NA )
Estimates ( 9 )NANANANANA
(p-val)(NA )(NA )(NA )(NA )(NA )


Estimated ARIMA Residuals
Value
3.03499832315433
-459.478980676216
290.394106539336
-233.51953113484
-441.373808848581
-225.452007071937
145.561039859934
-216.674860198993
159.158399800478
423.817122413105
-0.730640232398803
309.650358806978
298.186003592595
-145.579635430154
79.978369368057
-487.529080306322
-468.900451351332
3.51376608421037
-98.1759943651193
0.600814969537169
-142.025544378432
442.341567139259
150.626637905981
720.245666427142
-299.790837492266
1185.48889760987
-1128.98783693221
-804.466021958083
-172.679023830013
34.6568524908657
-43.9540781086857
-156.280665574323
108.764910382121
266.746326704602
284.101797213217
716.358427556445
35.1304783323681
-837.15106402624
318.405311137412
-56.7099590727094
-637.651839113234
5.38949596615703
-60.6598509256523
-82.9626976026141
21.1861172377826
214.011777194141
14.378148454319
649.148448578913
303.555620808815
221.1418160823
-561.218737584256
-556.503502667435
62.9421873758179
-234.334898161096
6.27460661142618
-160.079559701183
53.9877909733291
200.910804017544
-91.1382469317709
985.593541417898
267.210730584449
-562.710991051049
100.374396521086
-491.611742354623
-268.945747916614
-101.399700874455
10.8274444302251
-88.0669659324994
16.5696007920928
155.841135644461
244.487835405349
56.8589434027742

\begin{tabular}{lllllllll}
\hline
Estimated ARIMA Residuals \tabularnewline
Value \tabularnewline
3.03499832315433 \tabularnewline
-459.478980676216 \tabularnewline
290.394106539336 \tabularnewline
-233.51953113484 \tabularnewline
-441.373808848581 \tabularnewline
-225.452007071937 \tabularnewline
145.561039859934 \tabularnewline
-216.674860198993 \tabularnewline
159.158399800478 \tabularnewline
423.817122413105 \tabularnewline
-0.730640232398803 \tabularnewline
309.650358806978 \tabularnewline
298.186003592595 \tabularnewline
-145.579635430154 \tabularnewline
79.978369368057 \tabularnewline
-487.529080306322 \tabularnewline
-468.900451351332 \tabularnewline
3.51376608421037 \tabularnewline
-98.1759943651193 \tabularnewline
0.600814969537169 \tabularnewline
-142.025544378432 \tabularnewline
442.341567139259 \tabularnewline
150.626637905981 \tabularnewline
720.245666427142 \tabularnewline
-299.790837492266 \tabularnewline
1185.48889760987 \tabularnewline
-1128.98783693221 \tabularnewline
-804.466021958083 \tabularnewline
-172.679023830013 \tabularnewline
34.6568524908657 \tabularnewline
-43.9540781086857 \tabularnewline
-156.280665574323 \tabularnewline
108.764910382121 \tabularnewline
266.746326704602 \tabularnewline
284.101797213217 \tabularnewline
716.358427556445 \tabularnewline
35.1304783323681 \tabularnewline
-837.15106402624 \tabularnewline
318.405311137412 \tabularnewline
-56.7099590727094 \tabularnewline
-637.651839113234 \tabularnewline
5.38949596615703 \tabularnewline
-60.6598509256523 \tabularnewline
-82.9626976026141 \tabularnewline
21.1861172377826 \tabularnewline
214.011777194141 \tabularnewline
14.378148454319 \tabularnewline
649.148448578913 \tabularnewline
303.555620808815 \tabularnewline
221.1418160823 \tabularnewline
-561.218737584256 \tabularnewline
-556.503502667435 \tabularnewline
62.9421873758179 \tabularnewline
-234.334898161096 \tabularnewline
6.27460661142618 \tabularnewline
-160.079559701183 \tabularnewline
53.9877909733291 \tabularnewline
200.910804017544 \tabularnewline
-91.1382469317709 \tabularnewline
985.593541417898 \tabularnewline
267.210730584449 \tabularnewline
-562.710991051049 \tabularnewline
100.374396521086 \tabularnewline
-491.611742354623 \tabularnewline
-268.945747916614 \tabularnewline
-101.399700874455 \tabularnewline
10.8274444302251 \tabularnewline
-88.0669659324994 \tabularnewline
16.5696007920928 \tabularnewline
155.841135644461 \tabularnewline
244.487835405349 \tabularnewline
56.8589434027742 \tabularnewline
\hline
\end{tabular}
%Source: https://freestatistics.org/blog/index.php?pk=291465&T=2

[TABLE]
[ROW][C]Estimated ARIMA Residuals[/C][/ROW]
[ROW][C]Value[/C][/ROW]
[ROW][C]3.03499832315433[/C][/ROW]
[ROW][C]-459.478980676216[/C][/ROW]
[ROW][C]290.394106539336[/C][/ROW]
[ROW][C]-233.51953113484[/C][/ROW]
[ROW][C]-441.373808848581[/C][/ROW]
[ROW][C]-225.452007071937[/C][/ROW]
[ROW][C]145.561039859934[/C][/ROW]
[ROW][C]-216.674860198993[/C][/ROW]
[ROW][C]159.158399800478[/C][/ROW]
[ROW][C]423.817122413105[/C][/ROW]
[ROW][C]-0.730640232398803[/C][/ROW]
[ROW][C]309.650358806978[/C][/ROW]
[ROW][C]298.186003592595[/C][/ROW]
[ROW][C]-145.579635430154[/C][/ROW]
[ROW][C]79.978369368057[/C][/ROW]
[ROW][C]-487.529080306322[/C][/ROW]
[ROW][C]-468.900451351332[/C][/ROW]
[ROW][C]3.51376608421037[/C][/ROW]
[ROW][C]-98.1759943651193[/C][/ROW]
[ROW][C]0.600814969537169[/C][/ROW]
[ROW][C]-142.025544378432[/C][/ROW]
[ROW][C]442.341567139259[/C][/ROW]
[ROW][C]150.626637905981[/C][/ROW]
[ROW][C]720.245666427142[/C][/ROW]
[ROW][C]-299.790837492266[/C][/ROW]
[ROW][C]1185.48889760987[/C][/ROW]
[ROW][C]-1128.98783693221[/C][/ROW]
[ROW][C]-804.466021958083[/C][/ROW]
[ROW][C]-172.679023830013[/C][/ROW]
[ROW][C]34.6568524908657[/C][/ROW]
[ROW][C]-43.9540781086857[/C][/ROW]
[ROW][C]-156.280665574323[/C][/ROW]
[ROW][C]108.764910382121[/C][/ROW]
[ROW][C]266.746326704602[/C][/ROW]
[ROW][C]284.101797213217[/C][/ROW]
[ROW][C]716.358427556445[/C][/ROW]
[ROW][C]35.1304783323681[/C][/ROW]
[ROW][C]-837.15106402624[/C][/ROW]
[ROW][C]318.405311137412[/C][/ROW]
[ROW][C]-56.7099590727094[/C][/ROW]
[ROW][C]-637.651839113234[/C][/ROW]
[ROW][C]5.38949596615703[/C][/ROW]
[ROW][C]-60.6598509256523[/C][/ROW]
[ROW][C]-82.9626976026141[/C][/ROW]
[ROW][C]21.1861172377826[/C][/ROW]
[ROW][C]214.011777194141[/C][/ROW]
[ROW][C]14.378148454319[/C][/ROW]
[ROW][C]649.148448578913[/C][/ROW]
[ROW][C]303.555620808815[/C][/ROW]
[ROW][C]221.1418160823[/C][/ROW]
[ROW][C]-561.218737584256[/C][/ROW]
[ROW][C]-556.503502667435[/C][/ROW]
[ROW][C]62.9421873758179[/C][/ROW]
[ROW][C]-234.334898161096[/C][/ROW]
[ROW][C]6.27460661142618[/C][/ROW]
[ROW][C]-160.079559701183[/C][/ROW]
[ROW][C]53.9877909733291[/C][/ROW]
[ROW][C]200.910804017544[/C][/ROW]
[ROW][C]-91.1382469317709[/C][/ROW]
[ROW][C]985.593541417898[/C][/ROW]
[ROW][C]267.210730584449[/C][/ROW]
[ROW][C]-562.710991051049[/C][/ROW]
[ROW][C]100.374396521086[/C][/ROW]
[ROW][C]-491.611742354623[/C][/ROW]
[ROW][C]-268.945747916614[/C][/ROW]
[ROW][C]-101.399700874455[/C][/ROW]
[ROW][C]10.8274444302251[/C][/ROW]
[ROW][C]-88.0669659324994[/C][/ROW]
[ROW][C]16.5696007920928[/C][/ROW]
[ROW][C]155.841135644461[/C][/ROW]
[ROW][C]244.487835405349[/C][/ROW]
[ROW][C]56.8589434027742[/C][/ROW]
[/TABLE]
Source: https://freestatistics.org/blog/index.php?pk=291465&T=2

Globally Unique Identifier (entire table): ba.freestatistics.org/blog/index.php?pk=291465&T=2

As an alternative you can also use a QR Code:  

The GUIDs for individual cells are displayed in the table below:

Estimated ARIMA Residuals
Value
3.03499832315433
-459.478980676216
290.394106539336
-233.51953113484
-441.373808848581
-225.452007071937
145.561039859934
-216.674860198993
159.158399800478
423.817122413105
-0.730640232398803
309.650358806978
298.186003592595
-145.579635430154
79.978369368057
-487.529080306322
-468.900451351332
3.51376608421037
-98.1759943651193
0.600814969537169
-142.025544378432
442.341567139259
150.626637905981
720.245666427142
-299.790837492266
1185.48889760987
-1128.98783693221
-804.466021958083
-172.679023830013
34.6568524908657
-43.9540781086857
-156.280665574323
108.764910382121
266.746326704602
284.101797213217
716.358427556445
35.1304783323681
-837.15106402624
318.405311137412
-56.7099590727094
-637.651839113234
5.38949596615703
-60.6598509256523
-82.9626976026141
21.1861172377826
214.011777194141
14.378148454319
649.148448578913
303.555620808815
221.1418160823
-561.218737584256
-556.503502667435
62.9421873758179
-234.334898161096
6.27460661142618
-160.079559701183
53.9877909733291
200.910804017544
-91.1382469317709
985.593541417898
267.210730584449
-562.710991051049
100.374396521086
-491.611742354623
-268.945747916614
-101.399700874455
10.8274444302251
-88.0669659324994
16.5696007920928
155.841135644461
244.487835405349
56.8589434027742


Parameters (Session):
Parameters (R input):
par1 = FALSE ; par2 = 1 ; par3 = 0 ; par4 = 1 ; par5 = 1 ; par6 = 3 ; par7 = 1 ; par8 = 1 ; par9 = 0 ;
R code (references can be found in the software module):
par9 <- '0'
par8 <- '1'
par7 <- '1'
par6 <- '3'
par5 <- '1'
par4 <- '1'
par3 <- '0'
par2 <- '0.4'
par1 <- 'FALSE'
library(lattice)
if (par1 == 'TRUE') par1 <- TRUE
if (par1 == 'FALSE') par1 <- FALSE
par2 <- as.numeric(par2) #Box-Cox lambda transformation parameter
par3 <- as.numeric(par3) #degree of non-seasonal differencing
par4 <- as.numeric(par4) #degree of seasonal differencing
par5 <- as.numeric(par5) #seasonal period
par6 <- as.numeric(par6) #degree (p) of the non-seasonal AR(p) polynomial
par7 <- as.numeric(par7) #degree (q) of the non-seasonal MA(q) polynomial
par8 <- as.numeric(par8) #degree (P) of the seasonal AR(P) polynomial
par9 <- as.numeric(par9) #degree (Q) of the seasonal MA(Q) polynomial
armaGR <- function(arima.out, names, n){
try1 <- arima.out$coef
try2 <- sqrt(diag(arima.out$var.coef))
try.data.frame <- data.frame(matrix(NA,ncol=4,nrow=length(names)))
dimnames(try.data.frame) <- list(names,c('coef','std','tstat','pv'))
try.data.frame[,1] <- try1
for(i in 1:length(try2)) try.data.frame[which(rownames(try.data.frame)==names(try2)[i]),2] <- try2[i]
try.data.frame[,3] <- try.data.frame[,1] / try.data.frame[,2]
try.data.frame[,4] <- round((1-pt(abs(try.data.frame[,3]),df=n-(length(try2)+1)))*2,5)
vector <- rep(NA,length(names))
vector[is.na(try.data.frame[,4])] <- 0
maxi <- which.max(try.data.frame[,4])
continue <- max(try.data.frame[,4],na.rm=TRUE) > .05
vector[maxi] <- 0
list(summary=try.data.frame,next.vector=vector,continue=continue)
}
arimaSelect <- function(series, order=c(13,0,0), seasonal=list(order=c(2,0,0),period=12), include.mean=F){
nrc <- order[1]+order[3]+seasonal$order[1]+seasonal$order[3]
coeff <- matrix(NA, nrow=nrc*2, ncol=nrc)
pval <- matrix(NA, nrow=nrc*2, ncol=nrc)
mylist <- rep(list(NULL), nrc)
names <- NULL
if(order[1] > 0) names <- paste('ar',1:order[1],sep='')
if(order[3] > 0) names <- c( names , paste('ma',1:order[3],sep='') )
if(seasonal$order[1] > 0) names <- c(names, paste('sar',1:seasonal$order[1],sep=''))
if(seasonal$order[3] > 0) names <- c(names, paste('sma',1:seasonal$order[3],sep=''))
arima.out <- arima(series, order=order, seasonal=seasonal, include.mean=include.mean, method='ML')
mylist[[1]] <- arima.out
last.arma <- armaGR(arima.out, names, length(series))
mystop <- FALSE
i <- 1
coeff[i,] <- last.arma[[1]][,1]
pval [i,] <- last.arma[[1]][,4]
i <- 2
aic <- arima.out$aic
while(!mystop){
mylist[[i]] <- arima.out
arima.out <- arima(series, order=order, seasonal=seasonal, include.mean=include.mean, method='ML', fixed=last.arma$next.vector)
aic <- c(aic, arima.out$aic)
last.arma <- armaGR(arima.out, names, length(series))
mystop <- !last.arma$continue
coeff[i,] <- last.arma[[1]][,1]
pval [i,] <- last.arma[[1]][,4]
i <- i+1
}
list(coeff, pval, mylist, aic=aic)
}
arimaSelectplot <- function(arimaSelect.out,noms,choix){
noms <- names(arimaSelect.out[[3]][[1]]$coef)
coeff <- arimaSelect.out[[1]]
k <- min(which(is.na(coeff[,1])))-1
coeff <- coeff[1:k,]
pval <- arimaSelect.out[[2]][1:k,]
aic <- arimaSelect.out$aic[1:k]
coeff[coeff==0] <- NA
n <- ncol(coeff)
if(missing(choix)) choix <- k
layout(matrix(c(1,1,1,2,
3,3,3,2,
3,3,3,4,
5,6,7,7),nr=4),
widths=c(10,35,45,15),
heights=c(30,30,15,15))
couleurs <- rainbow(75)[1:50]#(50)
ticks <- pretty(coeff)
par(mar=c(1,1,3,1))
plot(aic,k:1-.5,type='o',pch=21,bg='blue',cex=2,axes=F,lty=2,xpd=NA)
points(aic[choix],k-choix+.5,pch=21,cex=4,bg=2,xpd=NA)
title('aic',line=2)
par(mar=c(3,0,0,0))
plot(0,axes=F,xlab='',ylab='',xlim=range(ticks),ylim=c(.1,1))
rect(xleft = min(ticks) + (0:49)/50*(max(ticks)-min(ticks)),
xright = min(ticks) + (1:50)/50*(max(ticks)-min(ticks)),
ytop = rep(1,50),
ybottom= rep(0,50),col=couleurs,border=NA)
axis(1,ticks)
rect(xleft=min(ticks),xright=max(ticks),ytop=1,ybottom=0)
text(mean(coeff,na.rm=T),.5,'coefficients',cex=2,font=2)
par(mar=c(1,1,3,1))
image(1:n,1:k,t(coeff[k:1,]),axes=F,col=couleurs,zlim=range(ticks))
for(i in 1:n) for(j in 1:k) if(!is.na(coeff[j,i])) {
if(pval[j,i]<.01) symb = 'green'
else if( (pval[j,i]<.05) & (pval[j,i]>=.01)) symb = 'orange'
else if( (pval[j,i]<.1) & (pval[j,i]>=.05)) symb = 'red'
else symb = 'black'
polygon(c(i+.5 ,i+.2 ,i+.5 ,i+.5),
c(k-j+0.5,k-j+0.5,k-j+0.8,k-j+0.5),
col=symb)
if(j==choix) {
rect(xleft=i-.5,
xright=i+.5,
ybottom=k-j+1.5,
ytop=k-j+.5,
lwd=4)
text(i,
k-j+1,
round(coeff[j,i],2),
cex=1.2,
font=2)
}
else{
rect(xleft=i-.5,xright=i+.5,ybottom=k-j+1.5,ytop=k-j+.5)
text(i,k-j+1,round(coeff[j,i],2),cex=1.2,font=1)
}
}
axis(3,1:n,noms)
par(mar=c(0.5,0,0,0.5))
plot(0,axes=F,xlab='',ylab='',type='n',xlim=c(0,8),ylim=c(-.2,.8))
cols <- c('green','orange','red','black')
niv <- c('0','0.01','0.05','0.1')
for(i in 0:3){
polygon(c(1+2*i ,1+2*i ,1+2*i-.5 ,1+2*i),
c(.4 ,.7 , .4 , .4),
col=cols[i+1])
text(2*i,0.5,niv[i+1],cex=1.5)
}
text(8,.5,1,cex=1.5)
text(4,0,'p-value',cex=2)
box()
residus <- arimaSelect.out[[3]][[choix]]$res
par(mar=c(1,2,4,1))
acf(residus,main='')
title('acf',line=.5)
par(mar=c(1,2,4,1))
pacf(residus,main='')
title('pacf',line=.5)
par(mar=c(2,2,4,1))
qqnorm(residus,main='')
title('qq-norm',line=.5)
qqline(residus)
residus
}
if (par2 == 0) x <- log(x)
if (par2 != 0) x <- x^par2
(selection <- arimaSelect(x, order=c(par6,par3,par7), seasonal=list(order=c(par8,par4,par9), period=par5)))
bitmap(file='test1.png')
resid <- arimaSelectplot(selection)
dev.off()
resid
bitmap(file='test2.png')
acf(resid,length(resid)/2, main='Residual Autocorrelation Function')
dev.off()
bitmap(file='test3.png')
pacf(resid,length(resid)/2, main='Residual Partial Autocorrelation Function')
dev.off()
bitmap(file='test4.png')
cpgram(resid, main='Residual Cumulative Periodogram')
dev.off()
bitmap(file='test5.png')
hist(resid, main='Residual Histogram', xlab='values of Residuals')
dev.off()
bitmap(file='test6.png')
densityplot(~resid,col='black',main='Residual Density Plot', xlab='values of Residuals')
dev.off()
bitmap(file='test7.png')
qqnorm(resid, main='Residual Normal Q-Q Plot')
qqline(resid)
dev.off()
ncols <- length(selection[[1]][1,])
nrows <- length(selection[[2]][,1])-1
load(file='createtable')
a<-table.start()
a<-table.row.start(a)
a<-table.element(a,'ARIMA Parameter Estimation and Backward Selection', ncols+1,TRUE)
a<-table.row.end(a)
a<-table.row.start(a)
a<-table.element(a,'Iteration', header=TRUE)
for (i in 1:ncols) {
a<-table.element(a,names(selection[[3]][[1]]$coef)[i],header=TRUE)
}
a<-table.row.end(a)
for (j in 1:nrows) {
a<-table.row.start(a)
mydum <- 'Estimates ('
mydum <- paste(mydum,j)
mydum <- paste(mydum,')')
a<-table.element(a,mydum, header=TRUE)
for (i in 1:ncols) {
a<-table.element(a,round(selection[[1]][j,i],4))
}
a<-table.row.end(a)
a<-table.row.start(a)
a<-table.element(a,'(p-val)', header=TRUE)
for (i in 1:ncols) {
mydum <- '('
mydum <- paste(mydum,round(selection[[2]][j,i],4),sep='')
mydum <- paste(mydum,')')
a<-table.element(a,mydum)
}
a<-table.row.end(a)
}
a<-table.end(a)
table.save(a,file='mytable.tab')
a<-table.start()
a<-table.row.start(a)
a<-table.element(a,'Estimated ARIMA Residuals', 1,TRUE)
a<-table.row.end(a)
a<-table.row.start(a)
a<-table.element(a,'Value', 1,TRUE)
a<-table.row.end(a)
for (i in (par4*par5+par3):length(resid)) {
a<-table.row.start(a)
a<-table.element(a,resid[i])
a<-table.row.end(a)
}
a<-table.end(a)
table.save(a,file='mytable1.tab')