Free Statistics

of Irreproducible Research!

Author's title

Author*The author of this computation has been verified*
R Software Modulerwasp_arimabackwardselection.wasp
Title produced by softwareARIMA Backward Selection
Date of computationFri, 22 Jan 2016 11:15:12 +0000
Cite this page as followsStatistical Computations at FreeStatistics.org, Office for Research Development and Education, URL https://freestatistics.org/blog/index.php?v=date/2016/Jan/22/t1453461321tb5row16cjvseu5.htm/, Retrieved Wed, 08 May 2024 02:06:54 +0000
Statistical Computations at FreeStatistics.org, Office for Research Development and Education, URL https://freestatistics.org/blog/index.php?pk=291757, Retrieved Wed, 08 May 2024 02:06:54 +0000
QR Codes:

Original text written by user:
IsPrivate?No (this computation is public)
User-defined keywords
Estimated Impact67
Family? (F = Feedback message, R = changed R code, M = changed R Module, P = changed Parameters, D = changed Data)
-       [ARIMA Backward Selection] [vraag 11 ] [2016-01-22 11:15:12] [5777355b7aed335e6347b7aed36a2c47] [Current]
Feedback Forum

Post a new message
Dataseries X:
3035
2552
2704
2554
2014
1655
1721
1524
1596
2074
2199
2512
2933
2889
2938
2497
1870
1726
1607
1545
1396
1787
2076
2837
2787
3891
3179
2011
1636
1580
1489
1300
1356
1653
2013
2823
3102
2294
2385
2444
1748
1554
1498
1361
1346
1564
1640
2293
2815
3137
2679
1969
1870
1633
1529
1366
1357
1570
1535
2491
3084
2605
2573
2143
1693
1504
1461
1354
1333
1492
1781
1915


Summary of computational transaction
Raw Inputview raw input (R code)
Raw Outputview raw output of R engine
Computing time4 seconds
R Server'Gertrude Mary Cox' @ cox.wessa.net

\begin{tabular}{lllllllll}
\hline
Summary of computational transaction \tabularnewline
Raw Input & view raw input (R code)  \tabularnewline
Raw Output & view raw output of R engine  \tabularnewline
Computing time & 4 seconds \tabularnewline
R Server & 'Gertrude Mary Cox' @ cox.wessa.net \tabularnewline
\hline
\end{tabular}
%Source: https://freestatistics.org/blog/index.php?pk=291757&T=0

[TABLE]
[ROW][C]Summary of computational transaction[/C][/ROW]
[ROW][C]Raw Input[/C][C]view raw input (R code) [/C][/ROW]
[ROW][C]Raw Output[/C][C]view raw output of R engine [/C][/ROW]
[ROW][C]Computing time[/C][C]4 seconds[/C][/ROW]
[ROW][C]R Server[/C][C]'Gertrude Mary Cox' @ cox.wessa.net[/C][/ROW]
[/TABLE]
Source: https://freestatistics.org/blog/index.php?pk=291757&T=0

Globally Unique Identifier (entire table): ba.freestatistics.org/blog/index.php?pk=291757&T=0

As an alternative you can also use a QR Code:  

The GUIDs for individual cells are displayed in the table below:

Summary of computational transaction
Raw Inputview raw input (R code)
Raw Outputview raw output of R engine
Computing time4 seconds
R Server'Gertrude Mary Cox' @ cox.wessa.net


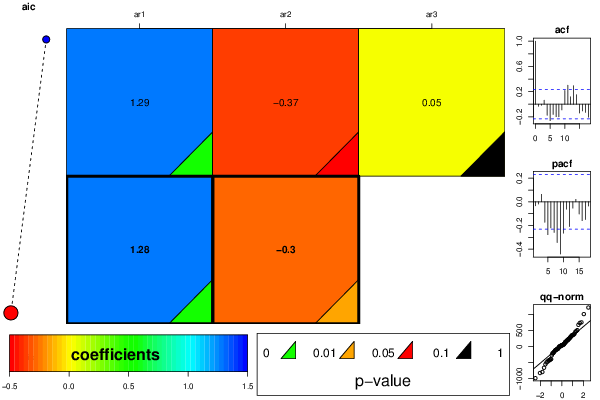
ARIMA Parameter Estimation and Backward Selection
Iterationar1ar2ar3
Estimates ( 1 )1.2947-0.36510.0513
(p-val)(0 )(0.06 )(0.668 )
Estimates ( 2 )1.2785-0.29890
(p-val)(0 )(0.0104 )(NA )
Estimates ( 3 )NANANA
(p-val)(NA )(NA )(NA )
Estimates ( 4 )NANANA
(p-val)(NA )(NA )(NA )
Estimates ( 5 )NANANA
(p-val)(NA )(NA )(NA )

\begin{tabular}{lllllllll}
\hline
ARIMA Parameter Estimation and Backward Selection \tabularnewline
Iteration & ar1 & ar2 & ar3 \tabularnewline
Estimates ( 1 ) & 1.2947 & -0.3651 & 0.0513 \tabularnewline
(p-val) & (0 ) & (0.06 ) & (0.668 ) \tabularnewline
Estimates ( 2 ) & 1.2785 & -0.2989 & 0 \tabularnewline
(p-val) & (0 ) & (0.0104 ) & (NA ) \tabularnewline
Estimates ( 3 ) & NA & NA & NA \tabularnewline
(p-val) & (NA ) & (NA ) & (NA ) \tabularnewline
Estimates ( 4 ) & NA & NA & NA \tabularnewline
(p-val) & (NA ) & (NA ) & (NA ) \tabularnewline
Estimates ( 5 ) & NA & NA & NA \tabularnewline
(p-val) & (NA ) & (NA ) & (NA ) \tabularnewline
\hline
\end{tabular}
%Source: https://freestatistics.org/blog/index.php?pk=291757&T=1

[TABLE]
[ROW][C]ARIMA Parameter Estimation and Backward Selection[/C][/ROW]
[ROW][C]Iteration[/C][C]ar1[/C][C]ar2[/C][C]ar3[/C][/ROW]
[ROW][C]Estimates ( 1 )[/C][C]1.2947[/C][C]-0.3651[/C][C]0.0513[/C][/ROW]
[ROW][C](p-val)[/C][C](0 )[/C][C](0.06 )[/C][C](0.668 )[/C][/ROW]
[ROW][C]Estimates ( 2 )[/C][C]1.2785[/C][C]-0.2989[/C][C]0[/C][/ROW]
[ROW][C](p-val)[/C][C](0 )[/C][C](0.0104 )[/C][C](NA )[/C][/ROW]
[ROW][C]Estimates ( 3 )[/C][C]NA[/C][C]NA[/C][C]NA[/C][/ROW]
[ROW][C](p-val)[/C][C](NA )[/C][C](NA )[/C][C](NA )[/C][/ROW]
[ROW][C]Estimates ( 4 )[/C][C]NA[/C][C]NA[/C][C]NA[/C][/ROW]
[ROW][C](p-val)[/C][C](NA )[/C][C](NA )[/C][C](NA )[/C][/ROW]
[ROW][C]Estimates ( 5 )[/C][C]NA[/C][C]NA[/C][C]NA[/C][/ROW]
[ROW][C](p-val)[/C][C](NA )[/C][C](NA )[/C][C](NA )[/C][/ROW]
[/TABLE]
Source: https://freestatistics.org/blog/index.php?pk=291757&T=1

Globally Unique Identifier (entire table): ba.freestatistics.org/blog/index.php?pk=291757&T=1

As an alternative you can also use a QR Code:  

The GUIDs for individual cells are displayed in the table below:

ARIMA Parameter Estimation and Backward Selection
Iterationar1ar2ar3
Estimates ( 1 )1.2947-0.36510.0513
(p-val)(0 )(0.06 )(0.668 )
Estimates ( 2 )1.2785-0.29890
(p-val)(0 )(0.0104 )(NA )
Estimates ( 3 )NANANA
(p-val)(NA )(NA )(NA )
Estimates ( 4 )NANANA
(p-val)(NA )(NA )(NA )
Estimates ( 5 )NANANA
(p-val)(NA )(NA )(NA )


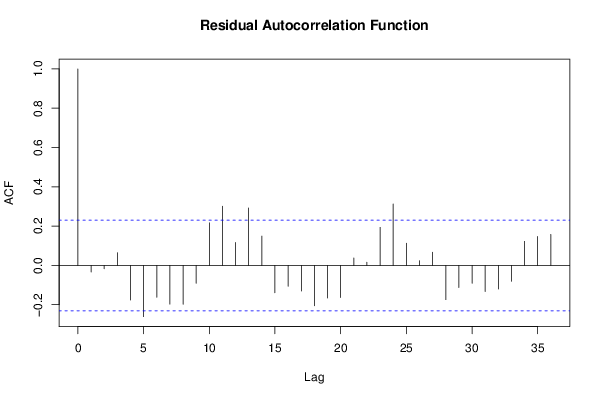
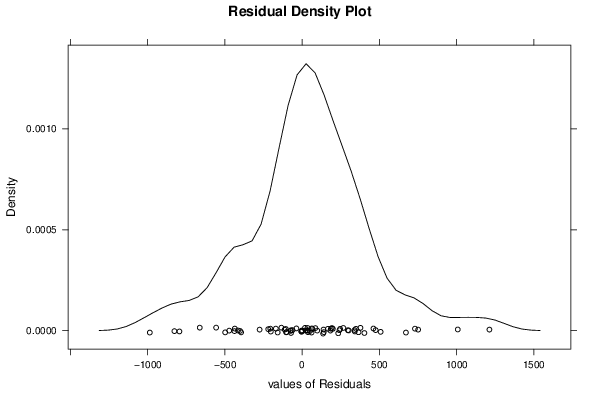
Estimated ARIMA Residuals
Value
508.033960112316
-415.241881869181
347.794774173576
-170.630021329442
-436.154435614545
-158.591716683971
182.714850012956
-203.127124208466
166.436812313937
475.901171204475
18.4354753599364
340.446455705448
377.338735526797
-103.843986240142
139.795688907082
-402.301410346947
-438.196755903259
66.0288557649947
-72.8653288715859
-1.22267884176449
-106.019325267182
461.352715697896
192.904097549117
730.153270297203
-219.62769511185
1212.16011654038
-986.457395472931
-826.95784938717
-6.36810592209213
33.1650148783883
-62.360455872772
-134.760188916581
135.579066487589
295.731356952767
301.351016210839
750.840451242503
97.36603201037
-794.546643626074
402.892824014208
34.7309950768586
-662.988595386747
60.9885981300818
-1.0090555822444
-100.650084466047
51.2230159864789
241.490458883186
36.7981060008692
671.772872178892
364.91444470319
245.630719887021
-472.141698490434
-498.37048689591
138.105575523354
-206.484578176175
-3.38091713959511
-113.195713864704
63.0175242261521
233.484799735418
-72.2098392356438
1007.34150635591
338.9189501072
-556.955886071737
198.700013488876
-395.186631324896
-275.591050163633
-37.3539388673662
22.0791541818617
-75.1832775205648
36.339731215317
185.662911166974
266.627531207708
85.5986092635051

\begin{tabular}{lllllllll}
\hline
Estimated ARIMA Residuals \tabularnewline
Value \tabularnewline
 \tabularnewline
508.033960112316 \tabularnewline
-415.241881869181 \tabularnewline
347.794774173576 \tabularnewline
-170.630021329442 \tabularnewline
-436.154435614545 \tabularnewline
-158.591716683971 \tabularnewline
182.714850012956 \tabularnewline
-203.127124208466 \tabularnewline
166.436812313937 \tabularnewline
475.901171204475 \tabularnewline
18.4354753599364 \tabularnewline
340.446455705448 \tabularnewline
377.338735526797 \tabularnewline
-103.843986240142 \tabularnewline
139.795688907082 \tabularnewline
-402.301410346947 \tabularnewline
-438.196755903259 \tabularnewline
66.0288557649947 \tabularnewline
-72.8653288715859 \tabularnewline
-1.22267884176449 \tabularnewline
-106.019325267182 \tabularnewline
461.352715697896 \tabularnewline
192.904097549117 \tabularnewline
730.153270297203 \tabularnewline
-219.62769511185 \tabularnewline
1212.16011654038 \tabularnewline
-986.457395472931 \tabularnewline
-826.95784938717 \tabularnewline
-6.36810592209213 \tabularnewline
33.1650148783883 \tabularnewline
-62.360455872772 \tabularnewline
-134.760188916581 \tabularnewline
135.579066487589 \tabularnewline
295.731356952767 \tabularnewline
301.351016210839 \tabularnewline
750.840451242503 \tabularnewline
97.36603201037 \tabularnewline
-794.546643626074 \tabularnewline
402.892824014208 \tabularnewline
34.7309950768586 \tabularnewline
-662.988595386747 \tabularnewline
60.9885981300818 \tabularnewline
-1.0090555822444 \tabularnewline
-100.650084466047 \tabularnewline
51.2230159864789 \tabularnewline
241.490458883186 \tabularnewline
36.7981060008692 \tabularnewline
671.772872178892 \tabularnewline
364.91444470319 \tabularnewline
245.630719887021 \tabularnewline
-472.141698490434 \tabularnewline
-498.37048689591 \tabularnewline
138.105575523354 \tabularnewline
-206.484578176175 \tabularnewline
-3.38091713959511 \tabularnewline
-113.195713864704 \tabularnewline
63.0175242261521 \tabularnewline
233.484799735418 \tabularnewline
-72.2098392356438 \tabularnewline
1007.34150635591 \tabularnewline
338.9189501072 \tabularnewline
-556.955886071737 \tabularnewline
198.700013488876 \tabularnewline
-395.186631324896 \tabularnewline
-275.591050163633 \tabularnewline
-37.3539388673662 \tabularnewline
22.0791541818617 \tabularnewline
-75.1832775205648 \tabularnewline
36.339731215317 \tabularnewline
185.662911166974 \tabularnewline
266.627531207708 \tabularnewline
85.5986092635051 \tabularnewline
\hline
\end{tabular}
%Source: https://freestatistics.org/blog/index.php?pk=291757&T=2

[TABLE]
[ROW][C]Estimated ARIMA Residuals[/C][/ROW]
[ROW][C]Value[/C][/ROW]
[ROW][C][/C][/ROW]
[ROW][C]508.033960112316[/C][/ROW]
[ROW][C]-415.241881869181[/C][/ROW]
[ROW][C]347.794774173576[/C][/ROW]
[ROW][C]-170.630021329442[/C][/ROW]
[ROW][C]-436.154435614545[/C][/ROW]
[ROW][C]-158.591716683971[/C][/ROW]
[ROW][C]182.714850012956[/C][/ROW]
[ROW][C]-203.127124208466[/C][/ROW]
[ROW][C]166.436812313937[/C][/ROW]
[ROW][C]475.901171204475[/C][/ROW]
[ROW][C]18.4354753599364[/C][/ROW]
[ROW][C]340.446455705448[/C][/ROW]
[ROW][C]377.338735526797[/C][/ROW]
[ROW][C]-103.843986240142[/C][/ROW]
[ROW][C]139.795688907082[/C][/ROW]
[ROW][C]-402.301410346947[/C][/ROW]
[ROW][C]-438.196755903259[/C][/ROW]
[ROW][C]66.0288557649947[/C][/ROW]
[ROW][C]-72.8653288715859[/C][/ROW]
[ROW][C]-1.22267884176449[/C][/ROW]
[ROW][C]-106.019325267182[/C][/ROW]
[ROW][C]461.352715697896[/C][/ROW]
[ROW][C]192.904097549117[/C][/ROW]
[ROW][C]730.153270297203[/C][/ROW]
[ROW][C]-219.62769511185[/C][/ROW]
[ROW][C]1212.16011654038[/C][/ROW]
[ROW][C]-986.457395472931[/C][/ROW]
[ROW][C]-826.95784938717[/C][/ROW]
[ROW][C]-6.36810592209213[/C][/ROW]
[ROW][C]33.1650148783883[/C][/ROW]
[ROW][C]-62.360455872772[/C][/ROW]
[ROW][C]-134.760188916581[/C][/ROW]
[ROW][C]135.579066487589[/C][/ROW]
[ROW][C]295.731356952767[/C][/ROW]
[ROW][C]301.351016210839[/C][/ROW]
[ROW][C]750.840451242503[/C][/ROW]
[ROW][C]97.36603201037[/C][/ROW]
[ROW][C]-794.546643626074[/C][/ROW]
[ROW][C]402.892824014208[/C][/ROW]
[ROW][C]34.7309950768586[/C][/ROW]
[ROW][C]-662.988595386747[/C][/ROW]
[ROW][C]60.9885981300818[/C][/ROW]
[ROW][C]-1.0090555822444[/C][/ROW]
[ROW][C]-100.650084466047[/C][/ROW]
[ROW][C]51.2230159864789[/C][/ROW]
[ROW][C]241.490458883186[/C][/ROW]
[ROW][C]36.7981060008692[/C][/ROW]
[ROW][C]671.772872178892[/C][/ROW]
[ROW][C]364.91444470319[/C][/ROW]
[ROW][C]245.630719887021[/C][/ROW]
[ROW][C]-472.141698490434[/C][/ROW]
[ROW][C]-498.37048689591[/C][/ROW]
[ROW][C]138.105575523354[/C][/ROW]
[ROW][C]-206.484578176175[/C][/ROW]
[ROW][C]-3.38091713959511[/C][/ROW]
[ROW][C]-113.195713864704[/C][/ROW]
[ROW][C]63.0175242261521[/C][/ROW]
[ROW][C]233.484799735418[/C][/ROW]
[ROW][C]-72.2098392356438[/C][/ROW]
[ROW][C]1007.34150635591[/C][/ROW]
[ROW][C]338.9189501072[/C][/ROW]
[ROW][C]-556.955886071737[/C][/ROW]
[ROW][C]198.700013488876[/C][/ROW]
[ROW][C]-395.186631324896[/C][/ROW]
[ROW][C]-275.591050163633[/C][/ROW]
[ROW][C]-37.3539388673662[/C][/ROW]
[ROW][C]22.0791541818617[/C][/ROW]
[ROW][C]-75.1832775205648[/C][/ROW]
[ROW][C]36.339731215317[/C][/ROW]
[ROW][C]185.662911166974[/C][/ROW]
[ROW][C]266.627531207708[/C][/ROW]
[ROW][C]85.5986092635051[/C][/ROW]
[/TABLE]
Source: https://freestatistics.org/blog/index.php?pk=291757&T=2

Globally Unique Identifier (entire table): ba.freestatistics.org/blog/index.php?pk=291757&T=2

As an alternative you can also use a QR Code:  

The GUIDs for individual cells are displayed in the table below:

Estimated ARIMA Residuals
Value
508.033960112316
-415.241881869181
347.794774173576
-170.630021329442
-436.154435614545
-158.591716683971
182.714850012956
-203.127124208466
166.436812313937
475.901171204475
18.4354753599364
340.446455705448
377.338735526797
-103.843986240142
139.795688907082
-402.301410346947
-438.196755903259
66.0288557649947
-72.8653288715859
-1.22267884176449
-106.019325267182
461.352715697896
192.904097549117
730.153270297203
-219.62769511185
1212.16011654038
-986.457395472931
-826.95784938717
-6.36810592209213
33.1650148783883
-62.360455872772
-134.760188916581
135.579066487589
295.731356952767
301.351016210839
750.840451242503
97.36603201037
-794.546643626074
402.892824014208
34.7309950768586
-662.988595386747
60.9885981300818
-1.0090555822444
-100.650084466047
51.2230159864789
241.490458883186
36.7981060008692
671.772872178892
364.91444470319
245.630719887021
-472.141698490434
-498.37048689591
138.105575523354
-206.484578176175
-3.38091713959511
-113.195713864704
63.0175242261521
233.484799735418
-72.2098392356438
1007.34150635591
338.9189501072
-556.955886071737
198.700013488876
-395.186631324896
-275.591050163633
-37.3539388673662
22.0791541818617
-75.1832775205648
36.339731215317
185.662911166974
266.627531207708
85.5986092635051


Parameters (Session):
par1 = 12 ; par2 = Triple ; par3 = additive ;
Parameters (R input):
par1 = TRUE ; par2 = 1 ; par3 = 0 ; par4 = 0 ; par5 = 1 ; par6 = 3 ; par7 = 0 ; par8 = 0 ; par9 = 0 ;
R code (references can be found in the software module):
par9 <- '0'
par8 <- '0'
par7 <- '0'
par6 <- '1'
par5 <- '1'
par4 <- '0'
par3 <- '0'
par2 <- '1'
par1 <- 'TRUE'
library(lattice)
if (par1 == 'TRUE') par1 <- TRUE
if (par1 == 'FALSE') par1 <- FALSE
par2 <- as.numeric(par2) #Box-Cox lambda transformation parameter
par3 <- as.numeric(par3) #degree of non-seasonal differencing
par4 <- as.numeric(par4) #degree of seasonal differencing
par5 <- as.numeric(par5) #seasonal period
par6 <- as.numeric(par6) #degree (p) of the non-seasonal AR(p) polynomial
par7 <- as.numeric(par7) #degree (q) of the non-seasonal MA(q) polynomial
par8 <- as.numeric(par8) #degree (P) of the seasonal AR(P) polynomial
par9 <- as.numeric(par9) #degree (Q) of the seasonal MA(Q) polynomial
armaGR <- function(arima.out, names, n){
try1 <- arima.out$coef
try2 <- sqrt(diag(arima.out$var.coef))
try.data.frame <- data.frame(matrix(NA,ncol=4,nrow=length(names)))
dimnames(try.data.frame) <- list(names,c('coef','std','tstat','pv'))
try.data.frame[,1] <- try1
for(i in 1:length(try2)) try.data.frame[which(rownames(try.data.frame)==names(try2)[i]),2] <- try2[i]
try.data.frame[,3] <- try.data.frame[,1] / try.data.frame[,2]
try.data.frame[,4] <- round((1-pt(abs(try.data.frame[,3]),df=n-(length(try2)+1)))*2,5)
vector <- rep(NA,length(names))
vector[is.na(try.data.frame[,4])] <- 0
maxi <- which.max(try.data.frame[,4])
continue <- max(try.data.frame[,4],na.rm=TRUE) > .05
vector[maxi] <- 0
list(summary=try.data.frame,next.vector=vector,continue=continue)
}
arimaSelect <- function(series, order=c(13,0,0), seasonal=list(order=c(2,0,0),period=12), include.mean=F){
nrc <- order[1]+order[3]+seasonal$order[1]+seasonal$order[3]
coeff <- matrix(NA, nrow=nrc*2, ncol=nrc)
pval <- matrix(NA, nrow=nrc*2, ncol=nrc)
mylist <- rep(list(NULL), nrc)
names <- NULL
if(order[1] > 0) names <- paste('ar',1:order[1],sep='')
if(order[3] > 0) names <- c( names , paste('ma',1:order[3],sep='') )
if(seasonal$order[1] > 0) names <- c(names, paste('sar',1:seasonal$order[1],sep=''))
if(seasonal$order[3] > 0) names <- c(names, paste('sma',1:seasonal$order[3],sep=''))
arima.out <- arima(series, order=order, seasonal=seasonal, include.mean=include.mean, method='ML')
mylist[[1]] <- arima.out
last.arma <- armaGR(arima.out, names, length(series))
mystop <- FALSE
i <- 1
coeff[i,] <- last.arma[[1]][,1]
pval [i,] <- last.arma[[1]][,4]
i <- 2
aic <- arima.out$aic
while(!mystop){
mylist[[i]] <- arima.out
arima.out <- arima(series, order=order, seasonal=seasonal, include.mean=include.mean, method='ML', fixed=last.arma$next.vector)
aic <- c(aic, arima.out$aic)
last.arma <- armaGR(arima.out, names, length(series))
mystop <- !last.arma$continue
coeff[i,] <- last.arma[[1]][,1]
pval [i,] <- last.arma[[1]][,4]
i <- i+1
}
list(coeff, pval, mylist, aic=aic)
}
arimaSelectplot <- function(arimaSelect.out,noms,choix){
noms <- names(arimaSelect.out[[3]][[1]]$coef)
coeff <- arimaSelect.out[[1]]
k <- min(which(is.na(coeff[,1])))-1
coeff <- coeff[1:k,]
pval <- arimaSelect.out[[2]][1:k,]
aic <- arimaSelect.out$aic[1:k]
coeff[coeff==0] <- NA
n <- ncol(coeff)
if(missing(choix)) choix <- k
layout(matrix(c(1,1,1,2,
3,3,3,2,
3,3,3,4,
5,6,7,7),nr=4),
widths=c(10,35,45,15),
heights=c(30,30,15,15))
couleurs <- rainbow(75)[1:50]#(50)
ticks <- pretty(coeff)
par(mar=c(1,1,3,1))
plot(aic,k:1-.5,type='o',pch=21,bg='blue',cex=2,axes=F,lty=2,xpd=NA)
points(aic[choix],k-choix+.5,pch=21,cex=4,bg=2,xpd=NA)
title('aic',line=2)
par(mar=c(3,0,0,0))
plot(0,axes=F,xlab='',ylab='',xlim=range(ticks),ylim=c(.1,1))
rect(xleft = min(ticks) + (0:49)/50*(max(ticks)-min(ticks)),
xright = min(ticks) + (1:50)/50*(max(ticks)-min(ticks)),
ytop = rep(1,50),
ybottom= rep(0,50),col=couleurs,border=NA)
axis(1,ticks)
rect(xleft=min(ticks),xright=max(ticks),ytop=1,ybottom=0)
text(mean(coeff,na.rm=T),.5,'coefficients',cex=2,font=2)
par(mar=c(1,1,3,1))
image(1:n,1:k,t(coeff[k:1,]),axes=F,col=couleurs,zlim=range(ticks))
for(i in 1:n) for(j in 1:k) if(!is.na(coeff[j,i])) {
if(pval[j,i]<.01) symb = 'green'
else if( (pval[j,i]<.05) & (pval[j,i]>=.01)) symb = 'orange'
else if( (pval[j,i]<.1) & (pval[j,i]>=.05)) symb = 'red'
else symb = 'black'
polygon(c(i+.5 ,i+.2 ,i+.5 ,i+.5),
c(k-j+0.5,k-j+0.5,k-j+0.8,k-j+0.5),
col=symb)
if(j==choix) {
rect(xleft=i-.5,
xright=i+.5,
ybottom=k-j+1.5,
ytop=k-j+.5,
lwd=4)
text(i,
k-j+1,
round(coeff[j,i],2),
cex=1.2,
font=2)
}
else{
rect(xleft=i-.5,xright=i+.5,ybottom=k-j+1.5,ytop=k-j+.5)
text(i,k-j+1,round(coeff[j,i],2),cex=1.2,font=1)
}
}
axis(3,1:n,noms)
par(mar=c(0.5,0,0,0.5))
plot(0,axes=F,xlab='',ylab='',type='n',xlim=c(0,8),ylim=c(-.2,.8))
cols <- c('green','orange','red','black')
niv <- c('0','0.01','0.05','0.1')
for(i in 0:3){
polygon(c(1+2*i ,1+2*i ,1+2*i-.5 ,1+2*i),
c(.4 ,.7 , .4 , .4),
col=cols[i+1])
text(2*i,0.5,niv[i+1],cex=1.5)
}
text(8,.5,1,cex=1.5)
text(4,0,'p-value',cex=2)
box()
residus <- arimaSelect.out[[3]][[choix]]$res
par(mar=c(1,2,4,1))
acf(residus,main='')
title('acf',line=.5)
par(mar=c(1,2,4,1))
pacf(residus,main='')
title('pacf',line=.5)
par(mar=c(2,2,4,1))
qqnorm(residus,main='')
title('qq-norm',line=.5)
qqline(residus)
residus
}
if (par2 == 0) x <- log(x)
if (par2 != 0) x <- x^par2
(selection <- arimaSelect(x, order=c(par6,par3,par7), seasonal=list(order=c(par8,par4,par9), period=par5)))
bitmap(file='test1.png')
resid <- arimaSelectplot(selection)
dev.off()
resid
bitmap(file='test2.png')
acf(resid,length(resid)/2, main='Residual Autocorrelation Function')
dev.off()
bitmap(file='test3.png')
pacf(resid,length(resid)/2, main='Residual Partial Autocorrelation Function')
dev.off()
bitmap(file='test4.png')
cpgram(resid, main='Residual Cumulative Periodogram')
dev.off()
bitmap(file='test5.png')
hist(resid, main='Residual Histogram', xlab='values of Residuals')
dev.off()
bitmap(file='test6.png')
densityplot(~resid,col='black',main='Residual Density Plot', xlab='values of Residuals')
dev.off()
bitmap(file='test7.png')
qqnorm(resid, main='Residual Normal Q-Q Plot')
qqline(resid)
dev.off()
ncols <- length(selection[[1]][1,])
nrows <- length(selection[[2]][,1])-1
load(file='createtable')
a<-table.start()
a<-table.row.start(a)
a<-table.element(a,'ARIMA Parameter Estimation and Backward Selection', ncols+1,TRUE)
a<-table.row.end(a)
a<-table.row.start(a)
a<-table.element(a,'Iteration', header=TRUE)
for (i in 1:ncols) {
a<-table.element(a,names(selection[[3]][[1]]$coef)[i],header=TRUE)
}
a<-table.row.end(a)
for (j in 1:nrows) {
a<-table.row.start(a)
mydum <- 'Estimates ('
mydum <- paste(mydum,j)
mydum <- paste(mydum,')')
a<-table.element(a,mydum, header=TRUE)
for (i in 1:ncols) {
a<-table.element(a,round(selection[[1]][j,i],4))
}
a<-table.row.end(a)
a<-table.row.start(a)
a<-table.element(a,'(p-val)', header=TRUE)
for (i in 1:ncols) {
mydum <- '('
mydum <- paste(mydum,round(selection[[2]][j,i],4),sep='')
mydum <- paste(mydum,')')
a<-table.element(a,mydum)
}
a<-table.row.end(a)
}
a<-table.end(a)
table.save(a,file='mytable.tab')
a<-table.start()
a<-table.row.start(a)
a<-table.element(a,'Estimated ARIMA Residuals', 1,TRUE)
a<-table.row.end(a)
a<-table.row.start(a)
a<-table.element(a,'Value', 1,TRUE)
a<-table.row.end(a)
for (i in (par4*par5+par3):length(resid)) {
a<-table.row.start(a)
a<-table.element(a,resid[i])
a<-table.row.end(a)
}
a<-table.end(a)
table.save(a,file='mytable1.tab')