Free Statistics
of Irreproducible Research!
Description of Statistical Computation | |||||||||||||||||||||||||||||||||||||
|---|---|---|---|---|---|---|---|---|---|---|---|---|---|---|---|---|---|---|---|---|---|---|---|---|---|---|---|---|---|---|---|---|---|---|---|---|---|
| Author's title | |||||||||||||||||||||||||||||||||||||
| Author | *Unverified author* | ||||||||||||||||||||||||||||||||||||
| R Software Module | rwasp_spearman.wasp | ||||||||||||||||||||||||||||||||||||
| Title produced by software | Spearman Rank Correlation | ||||||||||||||||||||||||||||||||||||
| Date of computation | Tue, 26 Jan 2016 17:30:53 +0000 | ||||||||||||||||||||||||||||||||||||
| Cite this page as follows | Statistical Computations at FreeStatistics.org, Office for Research Development and Education, URL https://freestatistics.org/blog/index.php?v=date/2016/Jan/26/t1453829510jp2jsi3uxo7h79n.htm/, Retrieved Sun, 28 Apr 2024 23:31:57 +0000 | ||||||||||||||||||||||||||||||||||||
| Statistical Computations at FreeStatistics.org, Office for Research Development and Education, URL https://freestatistics.org/blog/index.php?pk=291808, Retrieved Sun, 28 Apr 2024 23:31:57 +0000 | |||||||||||||||||||||||||||||||||||||
| QR Codes: | |||||||||||||||||||||||||||||||||||||
|
| |||||||||||||||||||||||||||||||||||||
| Original text written by user: | |||||||||||||||||||||||||||||||||||||
| IsPrivate? | No (this computation is public) | ||||||||||||||||||||||||||||||||||||
| User-defined keywords | |||||||||||||||||||||||||||||||||||||
| Estimated Impact | 165 | ||||||||||||||||||||||||||||||||||||
Tree of Dependent Computations | |||||||||||||||||||||||||||||||||||||
| Family? (F = Feedback message, R = changed R code, M = changed R Module, P = changed Parameters, D = changed Data) | |||||||||||||||||||||||||||||||||||||
| - [Spearman Rank Correlation] [VWC CH4] [2016-01-26 17:30:53] [d41d8cd98f00b204e9800998ecf8427e] [Current] | |||||||||||||||||||||||||||||||||||||
| Feedback Forum | |||||||||||||||||||||||||||||||||||||
Post a new message | |||||||||||||||||||||||||||||||||||||
Dataset | |||||||||||||||||||||||||||||||||||||
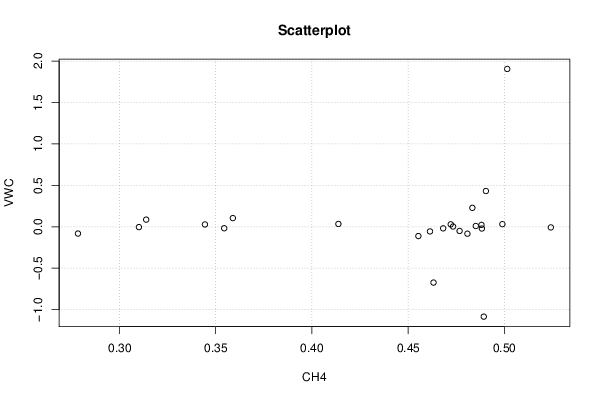
| Dataseries X: | |||||||||||||||||||||||||||||||||||||
0.310084596 0.278403759 0.488085568 0.524136573 0.413733736 0.4681831 0.476715297 0.488284498 0.473341212 0.485132292 0.354395181 0.472117215 0.313855946 0.463167042 0.35890907 0.455290318 0.344383836 0.461334035 0.48928383 0.50146836 0.480779797 0.498951763 0.483351648 0.490403205 | |||||||||||||||||||||||||||||||||||||
| Dataseries Y: | |||||||||||||||||||||||||||||||||||||
-0.00362546 -0.081538157 0.02321837 -0.007356826 0.034326162 -0.018621966 -0.049985063 -0.020844341 0.003152273 0.009700787 -0.017549096 0.030149978 0.086366074 -0.673017327 0.10498804 -0.1117681 0.028627252 -0.055901968 -1.084365526 1.90499258 -0.08324419 0.03202561 0.228846121 0.431890398 | |||||||||||||||||||||||||||||||||||||
Tables (Output of Computation) | |||||||||||||||||||||||||||||||||||||
| |||||||||||||||||||||||||||||||||||||
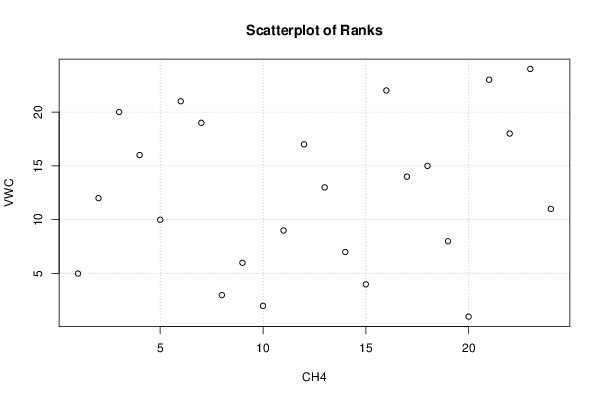
Figures (Output of Computation) | |||||||||||||||||||||||||||||||||||||
Input Parameters & R Code | |||||||||||||||||||||||||||||||||||||
| Parameters (Session): | |||||||||||||||||||||||||||||||||||||
| Parameters (R input): | |||||||||||||||||||||||||||||||||||||
| R code (references can be found in the software module): | |||||||||||||||||||||||||||||||||||||
k <- cor.test(x,y,method='spearman') | |||||||||||||||||||||||||||||||||||||