Free Statistics
of Irreproducible Research!
Description of Statistical Computation | |||||||||||||||||||||||||||||||||||||||||
|---|---|---|---|---|---|---|---|---|---|---|---|---|---|---|---|---|---|---|---|---|---|---|---|---|---|---|---|---|---|---|---|---|---|---|---|---|---|---|---|---|---|
| Author's title | |||||||||||||||||||||||||||||||||||||||||
| Author | *Unverified author* | ||||||||||||||||||||||||||||||||||||||||
| R Software Module | rwasp_univariatedataseries.wasp | ||||||||||||||||||||||||||||||||||||||||
| Title produced by software | Univariate Data Series | ||||||||||||||||||||||||||||||||||||||||
| Date of computation | Mon, 11 Jul 2016 18:21:44 +0100 | ||||||||||||||||||||||||||||||||||||||||
| Cite this page as follows | Statistical Computations at FreeStatistics.org, Office for Research Development and Education, URL https://freestatistics.org/blog/index.php?v=date/2016/Jul/11/t146825800948dsb79ujnur9xz.htm/, Retrieved Mon, 06 May 2024 16:43:50 +0000 | ||||||||||||||||||||||||||||||||||||||||
| Statistical Computations at FreeStatistics.org, Office for Research Development and Education, URL https://freestatistics.org/blog/index.php?pk=295826, Retrieved Mon, 06 May 2024 16:43:50 +0000 | |||||||||||||||||||||||||||||||||||||||||
| QR Codes: | |||||||||||||||||||||||||||||||||||||||||
|
| |||||||||||||||||||||||||||||||||||||||||
| Original text written by user: | |||||||||||||||||||||||||||||||||||||||||
| IsPrivate? | No (this computation is public) | ||||||||||||||||||||||||||||||||||||||||
| User-defined keywords | |||||||||||||||||||||||||||||||||||||||||
| Estimated Impact | 149 | ||||||||||||||||||||||||||||||||||||||||
Tree of Dependent Computations | |||||||||||||||||||||||||||||||||||||||||
| Family? (F = Feedback message, R = changed R code, M = changed R Module, P = changed Parameters, D = changed Data) | |||||||||||||||||||||||||||||||||||||||||
| - [Univariate Data Series] [reeks A stap 1] [2016-07-11 17:21:44] [d41d8cd98f00b204e9800998ecf8427e] [Current] - R PD [Univariate Data Series] [reeks A stap 2] [2016-07-11 17:30:36] [74be16979710d4c4e7c6647856088456] - R PD [Univariate Data Series] [reeks A stap 2] [2016-07-11 17:30:36] [74be16979710d4c4e7c6647856088456] - RMP [Histogram] [Reeks A stap 3] [2016-07-11 17:36:24] [74be16979710d4c4e7c6647856088456] - RMP [Kernel Density Estimation] [Reeks A stap 6] [2016-07-11 17:51:48] [74be16979710d4c4e7c6647856088456] - RMP [Quartiles] [reeks A stap 8] [2016-07-11 17:56:11] [74be16979710d4c4e7c6647856088456] - RMP [Notched Boxplots] [reeks A stap 9] [2016-07-11 18:02:33] [74be16979710d4c4e7c6647856088456] - RMP [Harrell-Davis Quantiles] [reeks A stap 11] [2016-07-11 18:07:56] [74be16979710d4c4e7c6647856088456] - RMP [Harrell-Davis Quantiles] [reeks A stap 12+13] [2016-07-11 18:16:58] [74be16979710d4c4e7c6647856088456] - RMP [Central Tendency] [reeks A stap 14] [2016-07-11 18:20:20] [74be16979710d4c4e7c6647856088456] - RMP [Mean Plot] [reeks A stap 18] [2016-07-11 18:33:58] [74be16979710d4c4e7c6647856088456] - RMP [(Partial) Autocorrelation Function] [reeks A stap 20] [2016-07-11 18:39:14] [74be16979710d4c4e7c6647856088456] - RMP [Standard Deviation Plot] [reeks A stap 23&24] [2016-07-11 18:43:19] [74be16979710d4c4e7c6647856088456] - RMP [Standard Deviation-Mean Plot] [reeks A stap 26] [2016-07-11 18:48:27] [74be16979710d4c4e7c6647856088456] - PD [Univariate Data Series] [Reeks B stap 1 ] [2016-07-11 19:01:12] [74be16979710d4c4e7c6647856088456] - RMPD [Histogram] [Reeks B stap 2] [2016-07-11 19:08:37] [74be16979710d4c4e7c6647856088456] | |||||||||||||||||||||||||||||||||||||||||
| Feedback Forum | |||||||||||||||||||||||||||||||||||||||||
Post a new message | |||||||||||||||||||||||||||||||||||||||||
Dataset | |||||||||||||||||||||||||||||||||||||||||
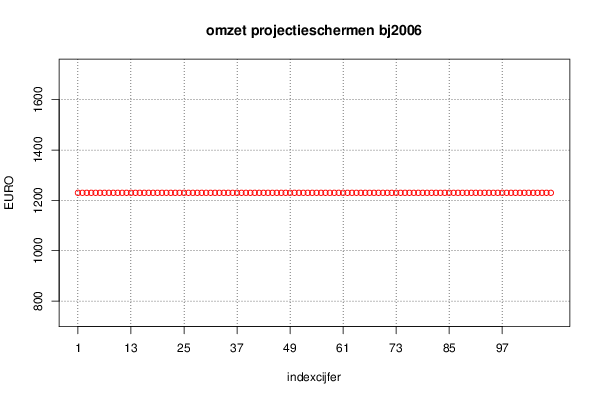
| Dataseries X: | |||||||||||||||||||||||||||||||||||||||||
1230 1230 1230 1230 1230 1230 1230 1230 1230 1230 1230 1230 1230 1230 1230 1230 1230 1230 1230 1230 1230 1230 1230 1230 1230 1230 1230 1230 1230 1230 1230 1230 1230 1230 1230 1230 1230 1230 1230 1230 1230 1230 1230 1230 1230 1230 1230 1230 1230 1230 1230 1230 1230 1230 1230 1230 1230 1230 1230 1230 1230 1230 1230 1230 1230 1230 1230 1230 1230 1230 1230 1230 1230 1230 1230 1230 1230 1230 1230 1230 1230 1230 1230 1230 1230 1230 1230 1230 1230 1230 1230 1230 1230 1230 1230 1230 1230 1230 1230 1230 1230 1230 1230 1230 1230 1230 1230 1230 | |||||||||||||||||||||||||||||||||||||||||
Tables (Output of Computation) | |||||||||||||||||||||||||||||||||||||||||
| |||||||||||||||||||||||||||||||||||||||||
Figures (Output of Computation) | |||||||||||||||||||||||||||||||||||||||||
Input Parameters & R Code | |||||||||||||||||||||||||||||||||||||||||
| Parameters (Session): | |||||||||||||||||||||||||||||||||||||||||
| par1 = omzet projectieschermen op jaarbasis ; par2 = niet gekend ; par3 = omzet projectieschermen op jaarbasis 2006-2015 ; par4 = 12 ; | |||||||||||||||||||||||||||||||||||||||||
| Parameters (R input): | |||||||||||||||||||||||||||||||||||||||||
| par1 = omzet projectieschermen op jaarbasis ; par2 = niet gekend ; par3 = omzet projectieschermen op jaarbasis 2006-2015 ; par4 = 12 ; | |||||||||||||||||||||||||||||||||||||||||
| R code (references can be found in the software module): | |||||||||||||||||||||||||||||||||||||||||
if (par4 != 'No season') { | |||||||||||||||||||||||||||||||||||||||||