Free Statistics

of Irreproducible Research!

Author's title

Author*Unverified author*
R Software Modulerwasp_autocorrelation.wasp
Title produced by software(Partial) Autocorrelation Function
Date of computationMon, 11 Jul 2016 19:39:14 +0100
Cite this page as followsStatistical Computations at FreeStatistics.org, Office for Research Development and Education, URL https://freestatistics.org/blog/index.php?v=date/2016/Jul/11/t1468262389kcbc2m49atwu5d9.htm/, Retrieved Mon, 06 May 2024 19:39:25 +0000
Statistical Computations at FreeStatistics.org, Office for Research Development and Education, URL https://freestatistics.org/blog/index.php?pk=295837, Retrieved Mon, 06 May 2024 19:39:25 +0000
QR Codes:

Original text written by user:
IsPrivate?No (this computation is public)
User-defined keywords
Estimated Impact158
Family? (F = Feedback message, R = changed R code, M = changed R Module, P = changed Parameters, D = changed Data)
-     [Univariate Data Series] [reeks A stap 1] [2016-07-11 17:21:44] [74be16979710d4c4e7c6647856088456]
- R PD  [Univariate Data Series] [reeks A stap 2] [2016-07-11 17:30:36] [74be16979710d4c4e7c6647856088456]
- RMP     [Histogram] [Reeks A stap 3] [2016-07-11 17:36:24] [74be16979710d4c4e7c6647856088456]
- RMP       [Notched Boxplots] [reeks A stap 9] [2016-07-11 18:02:33] [74be16979710d4c4e7c6647856088456]
- RMP           [(Partial) Autocorrelation Function] [reeks A stap 20] [2016-07-11 18:39:14] [d41d8cd98f00b204e9800998ecf8427e] [Current]
Feedback Forum

Post a new message
Dataseries X:
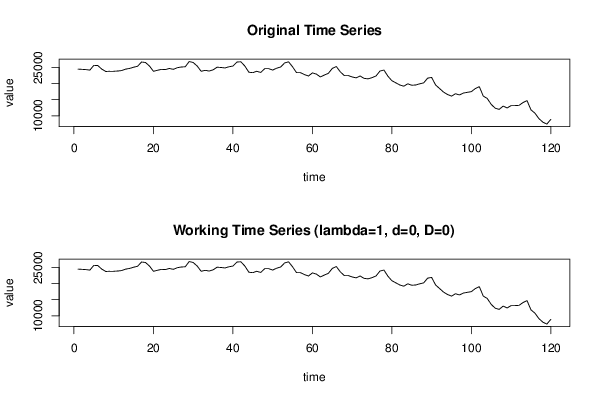
24514
24442
24364
24222
25689
25618
24514
23780
23851
23851
23922
24072
24514
24735
25105
25397
26722
26573
25468
23851
24143
24442
24364
24735
24442
24955
25176
25247
26872
26573
25468
23851
24143
23922
24293
25105
25027
24884
25247
25468
26722
26793
25468
23559
23409
23851
23481
24663
24663
24222
24806
25176
26430
26793
25247
23409
23409
22818
22376
23338
22968
22084
22676
23189
24735
25326
23702
22526
22526
22084
21792
22376
21643
21493
21864
22376
23922
24222
22305
20909
20246
19584
19213
19947
19506
19584
19947
20246
21714
21935
19584
18480
17375
16635
16122
16855
16492
17076
17297
17518
18480
19064
16122
15388
13543
12367
11997
13030
12439
13179
13179
13251
14134
14725
11854
10821
9126
8022
7437
8905


Summary of computational transaction
Raw Inputview raw input (R code)
Raw Outputview raw output of R engine
Computing time2 seconds
R Server'Sir Maurice George Kendall' @ kendall.wessa.net

\begin{tabular}{lllllllll}
\hline
Summary of computational transaction \tabularnewline
Raw Input & view raw input (R code)  \tabularnewline
Raw Output & view raw output of R engine  \tabularnewline
Computing time & 2 seconds \tabularnewline
R Server & 'Sir Maurice George Kendall' @ kendall.wessa.net \tabularnewline
\hline
\end{tabular}
%Source: https://freestatistics.org/blog/index.php?pk=295837&T=0

[TABLE]
[ROW][C]Summary of computational transaction[/C][/ROW]
[ROW][C]Raw Input[/C][C]view raw input (R code) [/C][/ROW]
[ROW][C]Raw Output[/C][C]view raw output of R engine [/C][/ROW]
[ROW][C]Computing time[/C][C]2 seconds[/C][/ROW]
[ROW][C]R Server[/C][C]'Sir Maurice George Kendall' @ kendall.wessa.net[/C][/ROW]
[/TABLE]
Source: https://freestatistics.org/blog/index.php?pk=295837&T=0

Globally Unique Identifier (entire table): ba.freestatistics.org/blog/index.php?pk=295837&T=0

As an alternative you can also use a QR Code:  

The GUIDs for individual cells are displayed in the table below:

Summary of computational transaction
Raw Inputview raw input (R code)
Raw Outputview raw output of R engine
Computing time2 seconds
R Server'Sir Maurice George Kendall' @ kendall.wessa.net


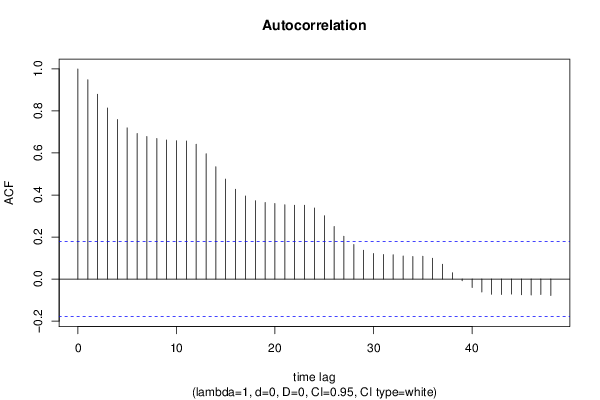
Autocorrelation Function
Time lag kACF(k)T-STATP-value
10.94877910.39340
20.879439.63370
30.8144898.92230
40.7597048.32210
50.7195987.88280
60.6930557.5920
70.6787847.43570
80.6691167.32980
90.661727.24880
100.6585227.21370
110.6572797.20010
120.6419097.03180
130.5961646.53060
140.5345445.85560
150.475845.21260
160.4273754.68174e-06
170.395074.32781.6e-05
180.3730934.0874e-05
190.3644983.99295.6e-05
200.3592733.93567e-05
210.3535523.8738.8e-05
220.3510073.84519.7e-05
230.3510593.84579.7e-05
240.3383613.70660.00016
250.3011073.29850.00064
260.2504082.74310.00351
270.2034622.22880.013844
280.1641721.79840.037313
290.1373891.5050.067473
300.1215811.33190.092717
310.1169381.2810.101333
320.1154981.26520.104123
330.1099511.20440.115393
340.1078061.1810.119978
350.1082271.18560.119067
360.0987271.08150.140823
370.0701580.76850.221839
380.0300710.32940.371208
39-0.007873-0.08620.465707
40-0.039851-0.43650.331614
41-0.061315-0.67170.251542
42-0.072497-0.79420.214335
43-0.073226-0.80220.212025
44-0.071593-0.78430.217216
45-0.074852-0.820.206931
46-0.076152-0.83420.202913
47-0.073325-0.80320.211714
48-0.078486-0.85980.195814

\begin{tabular}{lllllllll}
\hline
Autocorrelation Function \tabularnewline
Time lag k & ACF(k) & T-STAT & P-value \tabularnewline
1 & 0.948779 & 10.3934 & 0 \tabularnewline
2 & 0.87943 & 9.6337 & 0 \tabularnewline
3 & 0.814489 & 8.9223 & 0 \tabularnewline
4 & 0.759704 & 8.3221 & 0 \tabularnewline
5 & 0.719598 & 7.8828 & 0 \tabularnewline
6 & 0.693055 & 7.592 & 0 \tabularnewline
7 & 0.678784 & 7.4357 & 0 \tabularnewline
8 & 0.669116 & 7.3298 & 0 \tabularnewline
9 & 0.66172 & 7.2488 & 0 \tabularnewline
10 & 0.658522 & 7.2137 & 0 \tabularnewline
11 & 0.657279 & 7.2001 & 0 \tabularnewline
12 & 0.641909 & 7.0318 & 0 \tabularnewline
13 & 0.596164 & 6.5306 & 0 \tabularnewline
14 & 0.534544 & 5.8556 & 0 \tabularnewline
15 & 0.47584 & 5.2126 & 0 \tabularnewline
16 & 0.427375 & 4.6817 & 4e-06 \tabularnewline
17 & 0.39507 & 4.3278 & 1.6e-05 \tabularnewline
18 & 0.373093 & 4.087 & 4e-05 \tabularnewline
19 & 0.364498 & 3.9929 & 5.6e-05 \tabularnewline
20 & 0.359273 & 3.9356 & 7e-05 \tabularnewline
21 & 0.353552 & 3.873 & 8.8e-05 \tabularnewline
22 & 0.351007 & 3.8451 & 9.7e-05 \tabularnewline
23 & 0.351059 & 3.8457 & 9.7e-05 \tabularnewline
24 & 0.338361 & 3.7066 & 0.00016 \tabularnewline
25 & 0.301107 & 3.2985 & 0.00064 \tabularnewline
26 & 0.250408 & 2.7431 & 0.00351 \tabularnewline
27 & 0.203462 & 2.2288 & 0.013844 \tabularnewline
28 & 0.164172 & 1.7984 & 0.037313 \tabularnewline
29 & 0.137389 & 1.505 & 0.067473 \tabularnewline
30 & 0.121581 & 1.3319 & 0.092717 \tabularnewline
31 & 0.116938 & 1.281 & 0.101333 \tabularnewline
32 & 0.115498 & 1.2652 & 0.104123 \tabularnewline
33 & 0.109951 & 1.2044 & 0.115393 \tabularnewline
34 & 0.107806 & 1.181 & 0.119978 \tabularnewline
35 & 0.108227 & 1.1856 & 0.119067 \tabularnewline
36 & 0.098727 & 1.0815 & 0.140823 \tabularnewline
37 & 0.070158 & 0.7685 & 0.221839 \tabularnewline
38 & 0.030071 & 0.3294 & 0.371208 \tabularnewline
39 & -0.007873 & -0.0862 & 0.465707 \tabularnewline
40 & -0.039851 & -0.4365 & 0.331614 \tabularnewline
41 & -0.061315 & -0.6717 & 0.251542 \tabularnewline
42 & -0.072497 & -0.7942 & 0.214335 \tabularnewline
43 & -0.073226 & -0.8022 & 0.212025 \tabularnewline
44 & -0.071593 & -0.7843 & 0.217216 \tabularnewline
45 & -0.074852 & -0.82 & 0.206931 \tabularnewline
46 & -0.076152 & -0.8342 & 0.202913 \tabularnewline
47 & -0.073325 & -0.8032 & 0.211714 \tabularnewline
48 & -0.078486 & -0.8598 & 0.195814 \tabularnewline
\hline
\end{tabular}
%Source: https://freestatistics.org/blog/index.php?pk=295837&T=1

[TABLE]
[ROW][C]Autocorrelation Function[/C][/ROW]
[ROW][C]Time lag k[/C][C]ACF(k)[/C][C]T-STAT[/C][C]P-value[/C][/ROW]
[ROW][C]1[/C][C]0.948779[/C][C]10.3934[/C][C]0[/C][/ROW]
[ROW][C]2[/C][C]0.87943[/C][C]9.6337[/C][C]0[/C][/ROW]
[ROW][C]3[/C][C]0.814489[/C][C]8.9223[/C][C]0[/C][/ROW]
[ROW][C]4[/C][C]0.759704[/C][C]8.3221[/C][C]0[/C][/ROW]
[ROW][C]5[/C][C]0.719598[/C][C]7.8828[/C][C]0[/C][/ROW]
[ROW][C]6[/C][C]0.693055[/C][C]7.592[/C][C]0[/C][/ROW]
[ROW][C]7[/C][C]0.678784[/C][C]7.4357[/C][C]0[/C][/ROW]
[ROW][C]8[/C][C]0.669116[/C][C]7.3298[/C][C]0[/C][/ROW]
[ROW][C]9[/C][C]0.66172[/C][C]7.2488[/C][C]0[/C][/ROW]
[ROW][C]10[/C][C]0.658522[/C][C]7.2137[/C][C]0[/C][/ROW]
[ROW][C]11[/C][C]0.657279[/C][C]7.2001[/C][C]0[/C][/ROW]
[ROW][C]12[/C][C]0.641909[/C][C]7.0318[/C][C]0[/C][/ROW]
[ROW][C]13[/C][C]0.596164[/C][C]6.5306[/C][C]0[/C][/ROW]
[ROW][C]14[/C][C]0.534544[/C][C]5.8556[/C][C]0[/C][/ROW]
[ROW][C]15[/C][C]0.47584[/C][C]5.2126[/C][C]0[/C][/ROW]
[ROW][C]16[/C][C]0.427375[/C][C]4.6817[/C][C]4e-06[/C][/ROW]
[ROW][C]17[/C][C]0.39507[/C][C]4.3278[/C][C]1.6e-05[/C][/ROW]
[ROW][C]18[/C][C]0.373093[/C][C]4.087[/C][C]4e-05[/C][/ROW]
[ROW][C]19[/C][C]0.364498[/C][C]3.9929[/C][C]5.6e-05[/C][/ROW]
[ROW][C]20[/C][C]0.359273[/C][C]3.9356[/C][C]7e-05[/C][/ROW]
[ROW][C]21[/C][C]0.353552[/C][C]3.873[/C][C]8.8e-05[/C][/ROW]
[ROW][C]22[/C][C]0.351007[/C][C]3.8451[/C][C]9.7e-05[/C][/ROW]
[ROW][C]23[/C][C]0.351059[/C][C]3.8457[/C][C]9.7e-05[/C][/ROW]
[ROW][C]24[/C][C]0.338361[/C][C]3.7066[/C][C]0.00016[/C][/ROW]
[ROW][C]25[/C][C]0.301107[/C][C]3.2985[/C][C]0.00064[/C][/ROW]
[ROW][C]26[/C][C]0.250408[/C][C]2.7431[/C][C]0.00351[/C][/ROW]
[ROW][C]27[/C][C]0.203462[/C][C]2.2288[/C][C]0.013844[/C][/ROW]
[ROW][C]28[/C][C]0.164172[/C][C]1.7984[/C][C]0.037313[/C][/ROW]
[ROW][C]29[/C][C]0.137389[/C][C]1.505[/C][C]0.067473[/C][/ROW]
[ROW][C]30[/C][C]0.121581[/C][C]1.3319[/C][C]0.092717[/C][/ROW]
[ROW][C]31[/C][C]0.116938[/C][C]1.281[/C][C]0.101333[/C][/ROW]
[ROW][C]32[/C][C]0.115498[/C][C]1.2652[/C][C]0.104123[/C][/ROW]
[ROW][C]33[/C][C]0.109951[/C][C]1.2044[/C][C]0.115393[/C][/ROW]
[ROW][C]34[/C][C]0.107806[/C][C]1.181[/C][C]0.119978[/C][/ROW]
[ROW][C]35[/C][C]0.108227[/C][C]1.1856[/C][C]0.119067[/C][/ROW]
[ROW][C]36[/C][C]0.098727[/C][C]1.0815[/C][C]0.140823[/C][/ROW]
[ROW][C]37[/C][C]0.070158[/C][C]0.7685[/C][C]0.221839[/C][/ROW]
[ROW][C]38[/C][C]0.030071[/C][C]0.3294[/C][C]0.371208[/C][/ROW]
[ROW][C]39[/C][C]-0.007873[/C][C]-0.0862[/C][C]0.465707[/C][/ROW]
[ROW][C]40[/C][C]-0.039851[/C][C]-0.4365[/C][C]0.331614[/C][/ROW]
[ROW][C]41[/C][C]-0.061315[/C][C]-0.6717[/C][C]0.251542[/C][/ROW]
[ROW][C]42[/C][C]-0.072497[/C][C]-0.7942[/C][C]0.214335[/C][/ROW]
[ROW][C]43[/C][C]-0.073226[/C][C]-0.8022[/C][C]0.212025[/C][/ROW]
[ROW][C]44[/C][C]-0.071593[/C][C]-0.7843[/C][C]0.217216[/C][/ROW]
[ROW][C]45[/C][C]-0.074852[/C][C]-0.82[/C][C]0.206931[/C][/ROW]
[ROW][C]46[/C][C]-0.076152[/C][C]-0.8342[/C][C]0.202913[/C][/ROW]
[ROW][C]47[/C][C]-0.073325[/C][C]-0.8032[/C][C]0.211714[/C][/ROW]
[ROW][C]48[/C][C]-0.078486[/C][C]-0.8598[/C][C]0.195814[/C][/ROW]
[/TABLE]
Source: https://freestatistics.org/blog/index.php?pk=295837&T=1

Globally Unique Identifier (entire table): ba.freestatistics.org/blog/index.php?pk=295837&T=1

As an alternative you can also use a QR Code:  

The GUIDs for individual cells are displayed in the table below:

Autocorrelation Function
Time lag kACF(k)T-STATP-value
10.94877910.39340
20.879439.63370
30.8144898.92230
40.7597048.32210
50.7195987.88280
60.6930557.5920
70.6787847.43570
80.6691167.32980
90.661727.24880
100.6585227.21370
110.6572797.20010
120.6419097.03180
130.5961646.53060
140.5345445.85560
150.475845.21260
160.4273754.68174e-06
170.395074.32781.6e-05
180.3730934.0874e-05
190.3644983.99295.6e-05
200.3592733.93567e-05
210.3535523.8738.8e-05
220.3510073.84519.7e-05
230.3510593.84579.7e-05
240.3383613.70660.00016
250.3011073.29850.00064
260.2504082.74310.00351
270.2034622.22880.013844
280.1641721.79840.037313
290.1373891.5050.067473
300.1215811.33190.092717
310.1169381.2810.101333
320.1154981.26520.104123
330.1099511.20440.115393
340.1078061.1810.119978
350.1082271.18560.119067
360.0987271.08150.140823
370.0701580.76850.221839
380.0300710.32940.371208
39-0.007873-0.08620.465707
40-0.039851-0.43650.331614
41-0.061315-0.67170.251542
42-0.072497-0.79420.214335
43-0.073226-0.80220.212025
44-0.071593-0.78430.217216
45-0.074852-0.820.206931
46-0.076152-0.83420.202913
47-0.073325-0.80320.211714
48-0.078486-0.85980.195814


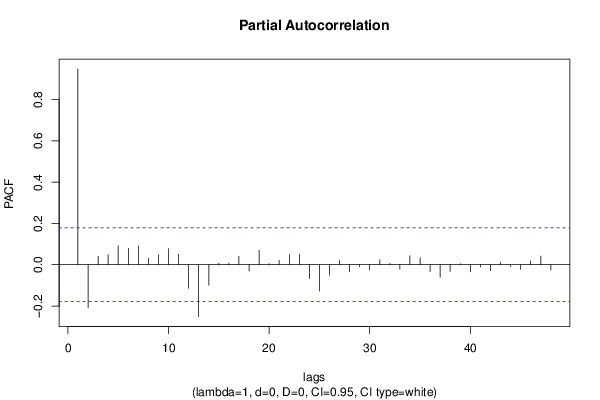
Partial Autocorrelation Function
Time lag kPACF(k)T-STATP-value
10.94877910.39340
2-0.207885-2.27730.012271
30.0406760.44560.328349
40.0484770.5310.298187
50.0917791.00540.158366
60.0793970.86980.193086
70.0908510.99520.160816
80.0313690.34360.365862
90.0479570.52530.300156
100.0773190.8470.199343
110.050780.55630.289531
12-0.114158-1.25050.106768
13-0.251562-2.75570.003385
14-0.099168-1.08630.139756
150.0075170.08230.467256
160.0067770.07420.470471
170.0402260.44070.330129
18-0.030356-0.33250.370034
190.0698320.7650.222894
200.0049310.0540.478506
210.0203480.22290.411996
220.0492370.53940.295317
230.0513390.56240.287448
24-0.066646-0.73010.233384
25-0.127502-1.39670.082539
26-0.050398-0.55210.290959
270.0222230.24340.404041
28-0.033614-0.36820.356677
29-0.009017-0.09880.46074
30-0.025916-0.28390.388488
310.0243350.26660.395124
320.0059430.06510.474102
33-0.021241-0.23270.408204
340.0430220.47130.319146
350.0340920.37350.354732
36-0.033339-0.36520.357797
37-0.060576-0.66360.254118
38-0.032125-0.35190.362759
390.0046410.05080.479771
40-0.033806-0.37030.355897
41-0.01137-0.12460.450542
42-0.028974-0.31740.37575
430.0126760.13890.444898
44-0.007843-0.08590.465837
45-0.021646-0.23710.406486
460.0179310.19640.422304
470.04180.45790.323927
48-0.025908-0.28380.388525

\begin{tabular}{lllllllll}
\hline
Partial Autocorrelation Function \tabularnewline
Time lag k & PACF(k) & T-STAT & P-value \tabularnewline
1 & 0.948779 & 10.3934 & 0 \tabularnewline
2 & -0.207885 & -2.2773 & 0.012271 \tabularnewline
3 & 0.040676 & 0.4456 & 0.328349 \tabularnewline
4 & 0.048477 & 0.531 & 0.298187 \tabularnewline
5 & 0.091779 & 1.0054 & 0.158366 \tabularnewline
6 & 0.079397 & 0.8698 & 0.193086 \tabularnewline
7 & 0.090851 & 0.9952 & 0.160816 \tabularnewline
8 & 0.031369 & 0.3436 & 0.365862 \tabularnewline
9 & 0.047957 & 0.5253 & 0.300156 \tabularnewline
10 & 0.077319 & 0.847 & 0.199343 \tabularnewline
11 & 0.05078 & 0.5563 & 0.289531 \tabularnewline
12 & -0.114158 & -1.2505 & 0.106768 \tabularnewline
13 & -0.251562 & -2.7557 & 0.003385 \tabularnewline
14 & -0.099168 & -1.0863 & 0.139756 \tabularnewline
15 & 0.007517 & 0.0823 & 0.467256 \tabularnewline
16 & 0.006777 & 0.0742 & 0.470471 \tabularnewline
17 & 0.040226 & 0.4407 & 0.330129 \tabularnewline
18 & -0.030356 & -0.3325 & 0.370034 \tabularnewline
19 & 0.069832 & 0.765 & 0.222894 \tabularnewline
20 & 0.004931 & 0.054 & 0.478506 \tabularnewline
21 & 0.020348 & 0.2229 & 0.411996 \tabularnewline
22 & 0.049237 & 0.5394 & 0.295317 \tabularnewline
23 & 0.051339 & 0.5624 & 0.287448 \tabularnewline
24 & -0.066646 & -0.7301 & 0.233384 \tabularnewline
25 & -0.127502 & -1.3967 & 0.082539 \tabularnewline
26 & -0.050398 & -0.5521 & 0.290959 \tabularnewline
27 & 0.022223 & 0.2434 & 0.404041 \tabularnewline
28 & -0.033614 & -0.3682 & 0.356677 \tabularnewline
29 & -0.009017 & -0.0988 & 0.46074 \tabularnewline
30 & -0.025916 & -0.2839 & 0.388488 \tabularnewline
31 & 0.024335 & 0.2666 & 0.395124 \tabularnewline
32 & 0.005943 & 0.0651 & 0.474102 \tabularnewline
33 & -0.021241 & -0.2327 & 0.408204 \tabularnewline
34 & 0.043022 & 0.4713 & 0.319146 \tabularnewline
35 & 0.034092 & 0.3735 & 0.354732 \tabularnewline
36 & -0.033339 & -0.3652 & 0.357797 \tabularnewline
37 & -0.060576 & -0.6636 & 0.254118 \tabularnewline
38 & -0.032125 & -0.3519 & 0.362759 \tabularnewline
39 & 0.004641 & 0.0508 & 0.479771 \tabularnewline
40 & -0.033806 & -0.3703 & 0.355897 \tabularnewline
41 & -0.01137 & -0.1246 & 0.450542 \tabularnewline
42 & -0.028974 & -0.3174 & 0.37575 \tabularnewline
43 & 0.012676 & 0.1389 & 0.444898 \tabularnewline
44 & -0.007843 & -0.0859 & 0.465837 \tabularnewline
45 & -0.021646 & -0.2371 & 0.406486 \tabularnewline
46 & 0.017931 & 0.1964 & 0.422304 \tabularnewline
47 & 0.0418 & 0.4579 & 0.323927 \tabularnewline
48 & -0.025908 & -0.2838 & 0.388525 \tabularnewline
\hline
\end{tabular}
%Source: https://freestatistics.org/blog/index.php?pk=295837&T=2

[TABLE]
[ROW][C]Partial Autocorrelation Function[/C][/ROW]
[ROW][C]Time lag k[/C][C]PACF(k)[/C][C]T-STAT[/C][C]P-value[/C][/ROW]
[ROW][C]1[/C][C]0.948779[/C][C]10.3934[/C][C]0[/C][/ROW]
[ROW][C]2[/C][C]-0.207885[/C][C]-2.2773[/C][C]0.012271[/C][/ROW]
[ROW][C]3[/C][C]0.040676[/C][C]0.4456[/C][C]0.328349[/C][/ROW]
[ROW][C]4[/C][C]0.048477[/C][C]0.531[/C][C]0.298187[/C][/ROW]
[ROW][C]5[/C][C]0.091779[/C][C]1.0054[/C][C]0.158366[/C][/ROW]
[ROW][C]6[/C][C]0.079397[/C][C]0.8698[/C][C]0.193086[/C][/ROW]
[ROW][C]7[/C][C]0.090851[/C][C]0.9952[/C][C]0.160816[/C][/ROW]
[ROW][C]8[/C][C]0.031369[/C][C]0.3436[/C][C]0.365862[/C][/ROW]
[ROW][C]9[/C][C]0.047957[/C][C]0.5253[/C][C]0.300156[/C][/ROW]
[ROW][C]10[/C][C]0.077319[/C][C]0.847[/C][C]0.199343[/C][/ROW]
[ROW][C]11[/C][C]0.05078[/C][C]0.5563[/C][C]0.289531[/C][/ROW]
[ROW][C]12[/C][C]-0.114158[/C][C]-1.2505[/C][C]0.106768[/C][/ROW]
[ROW][C]13[/C][C]-0.251562[/C][C]-2.7557[/C][C]0.003385[/C][/ROW]
[ROW][C]14[/C][C]-0.099168[/C][C]-1.0863[/C][C]0.139756[/C][/ROW]
[ROW][C]15[/C][C]0.007517[/C][C]0.0823[/C][C]0.467256[/C][/ROW]
[ROW][C]16[/C][C]0.006777[/C][C]0.0742[/C][C]0.470471[/C][/ROW]
[ROW][C]17[/C][C]0.040226[/C][C]0.4407[/C][C]0.330129[/C][/ROW]
[ROW][C]18[/C][C]-0.030356[/C][C]-0.3325[/C][C]0.370034[/C][/ROW]
[ROW][C]19[/C][C]0.069832[/C][C]0.765[/C][C]0.222894[/C][/ROW]
[ROW][C]20[/C][C]0.004931[/C][C]0.054[/C][C]0.478506[/C][/ROW]
[ROW][C]21[/C][C]0.020348[/C][C]0.2229[/C][C]0.411996[/C][/ROW]
[ROW][C]22[/C][C]0.049237[/C][C]0.5394[/C][C]0.295317[/C][/ROW]
[ROW][C]23[/C][C]0.051339[/C][C]0.5624[/C][C]0.287448[/C][/ROW]
[ROW][C]24[/C][C]-0.066646[/C][C]-0.7301[/C][C]0.233384[/C][/ROW]
[ROW][C]25[/C][C]-0.127502[/C][C]-1.3967[/C][C]0.082539[/C][/ROW]
[ROW][C]26[/C][C]-0.050398[/C][C]-0.5521[/C][C]0.290959[/C][/ROW]
[ROW][C]27[/C][C]0.022223[/C][C]0.2434[/C][C]0.404041[/C][/ROW]
[ROW][C]28[/C][C]-0.033614[/C][C]-0.3682[/C][C]0.356677[/C][/ROW]
[ROW][C]29[/C][C]-0.009017[/C][C]-0.0988[/C][C]0.46074[/C][/ROW]
[ROW][C]30[/C][C]-0.025916[/C][C]-0.2839[/C][C]0.388488[/C][/ROW]
[ROW][C]31[/C][C]0.024335[/C][C]0.2666[/C][C]0.395124[/C][/ROW]
[ROW][C]32[/C][C]0.005943[/C][C]0.0651[/C][C]0.474102[/C][/ROW]
[ROW][C]33[/C][C]-0.021241[/C][C]-0.2327[/C][C]0.408204[/C][/ROW]
[ROW][C]34[/C][C]0.043022[/C][C]0.4713[/C][C]0.319146[/C][/ROW]
[ROW][C]35[/C][C]0.034092[/C][C]0.3735[/C][C]0.354732[/C][/ROW]
[ROW][C]36[/C][C]-0.033339[/C][C]-0.3652[/C][C]0.357797[/C][/ROW]
[ROW][C]37[/C][C]-0.060576[/C][C]-0.6636[/C][C]0.254118[/C][/ROW]
[ROW][C]38[/C][C]-0.032125[/C][C]-0.3519[/C][C]0.362759[/C][/ROW]
[ROW][C]39[/C][C]0.004641[/C][C]0.0508[/C][C]0.479771[/C][/ROW]
[ROW][C]40[/C][C]-0.033806[/C][C]-0.3703[/C][C]0.355897[/C][/ROW]
[ROW][C]41[/C][C]-0.01137[/C][C]-0.1246[/C][C]0.450542[/C][/ROW]
[ROW][C]42[/C][C]-0.028974[/C][C]-0.3174[/C][C]0.37575[/C][/ROW]
[ROW][C]43[/C][C]0.012676[/C][C]0.1389[/C][C]0.444898[/C][/ROW]
[ROW][C]44[/C][C]-0.007843[/C][C]-0.0859[/C][C]0.465837[/C][/ROW]
[ROW][C]45[/C][C]-0.021646[/C][C]-0.2371[/C][C]0.406486[/C][/ROW]
[ROW][C]46[/C][C]0.017931[/C][C]0.1964[/C][C]0.422304[/C][/ROW]
[ROW][C]47[/C][C]0.0418[/C][C]0.4579[/C][C]0.323927[/C][/ROW]
[ROW][C]48[/C][C]-0.025908[/C][C]-0.2838[/C][C]0.388525[/C][/ROW]
[/TABLE]
Source: https://freestatistics.org/blog/index.php?pk=295837&T=2

Globally Unique Identifier (entire table): ba.freestatistics.org/blog/index.php?pk=295837&T=2

As an alternative you can also use a QR Code:  

The GUIDs for individual cells are displayed in the table below:

Partial Autocorrelation Function
Time lag kPACF(k)T-STATP-value
10.94877910.39340
2-0.207885-2.27730.012271
30.0406760.44560.328349
40.0484770.5310.298187
50.0917791.00540.158366
60.0793970.86980.193086
70.0908510.99520.160816
80.0313690.34360.365862
90.0479570.52530.300156
100.0773190.8470.199343
110.050780.55630.289531
12-0.114158-1.25050.106768
13-0.251562-2.75570.003385
14-0.099168-1.08630.139756
150.0075170.08230.467256
160.0067770.07420.470471
170.0402260.44070.330129
18-0.030356-0.33250.370034
190.0698320.7650.222894
200.0049310.0540.478506
210.0203480.22290.411996
220.0492370.53940.295317
230.0513390.56240.287448
24-0.066646-0.73010.233384
25-0.127502-1.39670.082539
26-0.050398-0.55210.290959
270.0222230.24340.404041
28-0.033614-0.36820.356677
29-0.009017-0.09880.46074
30-0.025916-0.28390.388488
310.0243350.26660.395124
320.0059430.06510.474102
33-0.021241-0.23270.408204
340.0430220.47130.319146
350.0340920.37350.354732
36-0.033339-0.36520.357797
37-0.060576-0.66360.254118
38-0.032125-0.35190.362759
390.0046410.05080.479771
40-0.033806-0.37030.355897
41-0.01137-0.12460.450542
42-0.028974-0.31740.37575
430.0126760.13890.444898
44-0.007843-0.08590.465837
45-0.021646-0.23710.406486
460.0179310.19640.422304
470.04180.45790.323927
48-0.025908-0.28380.388525


Parameters (Session):
par1 = 0.1 ; par2 = 0.9 ; par3 = 0.10 ;
Parameters (R input):
par1 = 48 ; par2 = 1 ; par3 = 0 ; par4 = 0 ; par5 = 12 ; par6 = White Noise ; par7 = 0.95 ; par8 = ;
R code (references can be found in the software module):
if (par1 == 'Default') {
par1 = 10*log10(length(x))
} else {
par1 <- as.numeric(par1)
}
par2 <- as.numeric(par2)
par3 <- as.numeric(par3)
par4 <- as.numeric(par4)
par5 <- as.numeric(par5)
if (par6 == 'White Noise') par6 <- 'white' else par6 <- 'ma'
par7 <- as.numeric(par7)
if (par8 != '') par8 <- as.numeric(par8)
x <- na.omit(x)
ox <- x
if (par8 == '') {
if (par2 == 0) {
x <- log(x)
} else {
x <- (x ^ par2 - 1) / par2
}
} else {
x <- log(x,base=par8)
}
if (par3 > 0) x <- diff(x,lag=1,difference=par3)
if (par4 > 0) x <- diff(x,lag=par5,difference=par4)
bitmap(file='picts.png')
op <- par(mfrow=c(2,1))
plot(ox,type='l',main='Original Time Series',xlab='time',ylab='value')
if (par8=='') {
mytitle <- paste('Working Time Series (lambda=',par2,', d=',par3,', D=',par4,')',sep='')
mysub <- paste('(lambda=',par2,', d=',par3,', D=',par4,', CI=', par7, ', CI type=',par6,')',sep='')
} else {
mytitle <- paste('Working Time Series (base=',par8,', d=',par3,', D=',par4,')',sep='')
mysub <- paste('(base=',par8,', d=',par3,', D=',par4,', CI=', par7, ', CI type=',par6,')',sep='')
}
plot(x,type='l', main=mytitle,xlab='time',ylab='value')
par(op)
dev.off()
bitmap(file='pic1.png')
racf <- acf(x, par1, main='Autocorrelation', xlab='time lag', ylab='ACF', ci.type=par6, ci=par7, sub=mysub)
dev.off()
bitmap(file='pic2.png')
rpacf <- pacf(x,par1,main='Partial Autocorrelation',xlab='lags',ylab='PACF',sub=mysub)
dev.off()
(myacf <- c(racf$acf))
(mypacf <- c(rpacf$acf))
lengthx <- length(x)
sqrtn <- sqrt(lengthx)
load(file='createtable')
a<-table.start()
a<-table.row.start(a)
a<-table.element(a,'Autocorrelation Function',4,TRUE)
a<-table.row.end(a)
a<-table.row.start(a)
a<-table.element(a,'Time lag k',header=TRUE)
a<-table.element(a,hyperlink('basics.htm','ACF(k)','click here for more information about the Autocorrelation Function'),header=TRUE)
a<-table.element(a,'T-STAT',header=TRUE)
a<-table.element(a,'P-value',header=TRUE)
a<-table.row.end(a)
for (i in 2:(par1+1)) {
a<-table.row.start(a)
a<-table.element(a,i-1,header=TRUE)
a<-table.element(a,round(myacf[i],6))
mytstat <- myacf[i]*sqrtn
a<-table.element(a,round(mytstat,4))
a<-table.element(a,round(1-pt(abs(mytstat),lengthx),6))
a<-table.row.end(a)
}
a<-table.end(a)
table.save(a,file='mytable.tab')
a<-table.start()
a<-table.row.start(a)
a<-table.element(a,'Partial Autocorrelation Function',4,TRUE)
a<-table.row.end(a)
a<-table.row.start(a)
a<-table.element(a,'Time lag k',header=TRUE)
a<-table.element(a,hyperlink('basics.htm','PACF(k)','click here for more information about the Partial Autocorrelation Function'),header=TRUE)
a<-table.element(a,'T-STAT',header=TRUE)
a<-table.element(a,'P-value',header=TRUE)
a<-table.row.end(a)
for (i in 1:par1) {
a<-table.row.start(a)
a<-table.element(a,i,header=TRUE)
a<-table.element(a,round(mypacf[i],6))
mytstat <- mypacf[i]*sqrtn
a<-table.element(a,round(mytstat,4))
a<-table.element(a,round(1-pt(abs(mytstat),lengthx),6))
a<-table.row.end(a)
}
a<-table.end(a)
table.save(a,file='mytable1.tab')