Free Statistics

of Irreproducible Research!

Author's title

Author*Unverified author*
R Software Modulerwasp_autocorrelation.wasp
Title produced by software(Partial) Autocorrelation Function
Date of computationSun, 17 Jul 2016 23:27:44 +0100
Cite this page as followsStatistical Computations at FreeStatistics.org, Office for Research Development and Education, URL https://freestatistics.org/blog/index.php?v=date/2016/Jul/17/t1468794519nbxxelce4mc8t2c.htm/, Retrieved Thu, 02 May 2024 00:52:32 +0000
Statistical Computations at FreeStatistics.org, Office for Research Development and Education, URL https://freestatistics.org/blog/index.php?pk=295872, Retrieved Thu, 02 May 2024 00:52:32 +0000
QR Codes:

Original text written by user:
IsPrivate?No (this computation is public)
User-defined keywords
Estimated Impact130
Family? (F = Feedback message, R = changed R code, M = changed R Module, P = changed Parameters, D = changed Data)
-       [(Partial) Autocorrelation Function] [reeks A: stap 22a] [2016-07-17 22:27:44] [d41d8cd98f00b204e9800998ecf8427e] [Current]
Feedback Forum

Post a new message
Dataseries X:
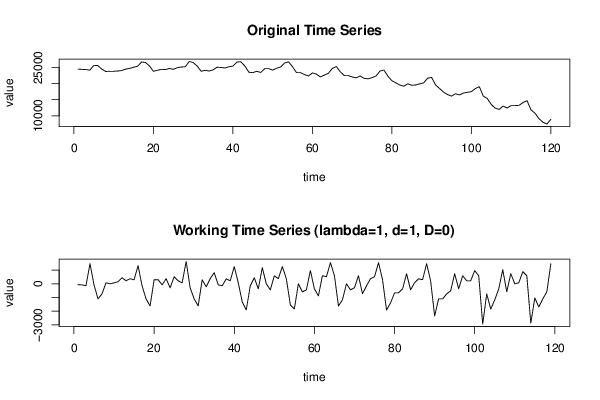
24514
24442
24364
24222
25689
25618
24514
23780
23851
23851
23922
24072
24514
24735
25105
25397
26722
26573
25468
23851
24143
24442
24364
24735
24442
24955
25176
25247
26872
26573
25468
23851
24143
23922
24293
25105
25027
24884
25247
25468
26722
26793
25468
23559
23409
23851
23481
24663
24663
24222
24806
25176
26430
26793
25247
23409
23409
22818
22376
23338
22968
22084
22676
23189
24735
25326
23702
22526
22526
22084
21792
22376
21643
21493
21864
22376
23922
24222
22305
20909
20246
19584
19213
19947
19506
19584
19947
20246
21714
21935
19584
18480
17375
16635
16122
16855
16492
17076
17297
17518
18480
19064
16122
15388
13543
12367
11997
13030
12439
13179
13179
13251
14134
14725
11854
10821
9126
8022
7437
8905


Summary of computational transaction
Raw Inputview raw input (R code)
Raw Outputview raw output of R engine
Computing time1 seconds
R Server'Gertrude Mary Cox' @ cox.wessa.net

\begin{tabular}{lllllllll}
\hline
Summary of computational transaction \tabularnewline
Raw Input & view raw input (R code)  \tabularnewline
Raw Output & view raw output of R engine  \tabularnewline
Computing time & 1 seconds \tabularnewline
R Server & 'Gertrude Mary Cox' @ cox.wessa.net \tabularnewline
\hline
\end{tabular}
%Source: https://freestatistics.org/blog/index.php?pk=295872&T=0

[TABLE]
[ROW][C]Summary of computational transaction[/C][/ROW]
[ROW][C]Raw Input[/C][C]view raw input (R code) [/C][/ROW]
[ROW][C]Raw Output[/C][C]view raw output of R engine [/C][/ROW]
[ROW][C]Computing time[/C][C]1 seconds[/C][/ROW]
[ROW][C]R Server[/C][C]'Gertrude Mary Cox' @ cox.wessa.net[/C][/ROW]
[/TABLE]
Source: https://freestatistics.org/blog/index.php?pk=295872&T=0

Globally Unique Identifier (entire table): ba.freestatistics.org/blog/index.php?pk=295872&T=0

As an alternative you can also use a QR Code:  

The GUIDs for individual cells are displayed in the table below:

Summary of computational transaction
Raw Inputview raw input (R code)
Raw Outputview raw output of R engine
Computing time1 seconds
R Server'Gertrude Mary Cox' @ cox.wessa.net


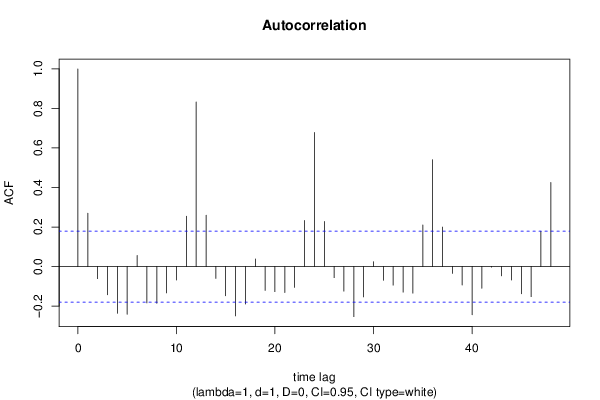
Autocorrelation Function
Time lag kACF(k)T-STATP-value
10.2697132.94220.001959
2-0.061353-0.66930.252307
3-0.143238-1.56250.060408
4-0.236664-2.58170.005522
5-0.241398-2.63330.004789
60.0560950.61190.270877
7-0.184129-2.00860.023421
8-0.185605-2.02470.022568
9-0.13342-1.45540.074091
10-0.068637-0.74870.227745
110.2542682.77370.003218
120.8325839.08240
130.2595292.83110.002724
14-0.060207-0.65680.256295
15-0.147572-1.60980.055043
16-0.249725-2.72420.003709
17-0.189637-2.06870.02037
180.0383870.41880.338074
19-0.120784-1.31760.095085
20-0.12701-1.38550.084244
21-0.131917-1.4390.076382
22-0.105659-1.15260.125692
230.2333872.54590.006088
240.6784737.40130
250.2275692.48250.007221
26-0.056326-0.61440.270049
27-0.124487-1.3580.088518
28-0.253696-2.76750.003276
29-0.153635-1.6760.048186
300.0245610.26790.394608
31-0.069331-0.75630.22548
32-0.094253-1.02820.152974
33-0.129504-1.41270.080174
34-0.134832-1.47080.071986
350.2103892.29510.01174
360.5400845.89160
370.1993852.1750.015803
38-0.034646-0.37790.353071
39-0.093396-1.01880.155175
40-0.243918-2.66080.004435
41-0.109595-1.19550.117127
42-0.002939-0.03210.487237
43-0.047195-0.51480.30381
44-0.068313-0.74520.228807
45-0.13802-1.50560.067407
46-0.152322-1.66160.049609
470.1783451.94550.027035
480.4254284.64094e-06

\begin{tabular}{lllllllll}
\hline
Autocorrelation Function \tabularnewline
Time lag k & ACF(k) & T-STAT & P-value \tabularnewline
1 & 0.269713 & 2.9422 & 0.001959 \tabularnewline
2 & -0.061353 & -0.6693 & 0.252307 \tabularnewline
3 & -0.143238 & -1.5625 & 0.060408 \tabularnewline
4 & -0.236664 & -2.5817 & 0.005522 \tabularnewline
5 & -0.241398 & -2.6333 & 0.004789 \tabularnewline
6 & 0.056095 & 0.6119 & 0.270877 \tabularnewline
7 & -0.184129 & -2.0086 & 0.023421 \tabularnewline
8 & -0.185605 & -2.0247 & 0.022568 \tabularnewline
9 & -0.13342 & -1.4554 & 0.074091 \tabularnewline
10 & -0.068637 & -0.7487 & 0.227745 \tabularnewline
11 & 0.254268 & 2.7737 & 0.003218 \tabularnewline
12 & 0.832583 & 9.0824 & 0 \tabularnewline
13 & 0.259529 & 2.8311 & 0.002724 \tabularnewline
14 & -0.060207 & -0.6568 & 0.256295 \tabularnewline
15 & -0.147572 & -1.6098 & 0.055043 \tabularnewline
16 & -0.249725 & -2.7242 & 0.003709 \tabularnewline
17 & -0.189637 & -2.0687 & 0.02037 \tabularnewline
18 & 0.038387 & 0.4188 & 0.338074 \tabularnewline
19 & -0.120784 & -1.3176 & 0.095085 \tabularnewline
20 & -0.12701 & -1.3855 & 0.084244 \tabularnewline
21 & -0.131917 & -1.439 & 0.076382 \tabularnewline
22 & -0.105659 & -1.1526 & 0.125692 \tabularnewline
23 & 0.233387 & 2.5459 & 0.006088 \tabularnewline
24 & 0.678473 & 7.4013 & 0 \tabularnewline
25 & 0.227569 & 2.4825 & 0.007221 \tabularnewline
26 & -0.056326 & -0.6144 & 0.270049 \tabularnewline
27 & -0.124487 & -1.358 & 0.088518 \tabularnewline
28 & -0.253696 & -2.7675 & 0.003276 \tabularnewline
29 & -0.153635 & -1.676 & 0.048186 \tabularnewline
30 & 0.024561 & 0.2679 & 0.394608 \tabularnewline
31 & -0.069331 & -0.7563 & 0.22548 \tabularnewline
32 & -0.094253 & -1.0282 & 0.152974 \tabularnewline
33 & -0.129504 & -1.4127 & 0.080174 \tabularnewline
34 & -0.134832 & -1.4708 & 0.071986 \tabularnewline
35 & 0.210389 & 2.2951 & 0.01174 \tabularnewline
36 & 0.540084 & 5.8916 & 0 \tabularnewline
37 & 0.199385 & 2.175 & 0.015803 \tabularnewline
38 & -0.034646 & -0.3779 & 0.353071 \tabularnewline
39 & -0.093396 & -1.0188 & 0.155175 \tabularnewline
40 & -0.243918 & -2.6608 & 0.004435 \tabularnewline
41 & -0.109595 & -1.1955 & 0.117127 \tabularnewline
42 & -0.002939 & -0.0321 & 0.487237 \tabularnewline
43 & -0.047195 & -0.5148 & 0.30381 \tabularnewline
44 & -0.068313 & -0.7452 & 0.228807 \tabularnewline
45 & -0.13802 & -1.5056 & 0.067407 \tabularnewline
46 & -0.152322 & -1.6616 & 0.049609 \tabularnewline
47 & 0.178345 & 1.9455 & 0.027035 \tabularnewline
48 & 0.425428 & 4.6409 & 4e-06 \tabularnewline
\hline
\end{tabular}
%Source: https://freestatistics.org/blog/index.php?pk=295872&T=1

[TABLE]
[ROW][C]Autocorrelation Function[/C][/ROW]
[ROW][C]Time lag k[/C][C]ACF(k)[/C][C]T-STAT[/C][C]P-value[/C][/ROW]
[ROW][C]1[/C][C]0.269713[/C][C]2.9422[/C][C]0.001959[/C][/ROW]
[ROW][C]2[/C][C]-0.061353[/C][C]-0.6693[/C][C]0.252307[/C][/ROW]
[ROW][C]3[/C][C]-0.143238[/C][C]-1.5625[/C][C]0.060408[/C][/ROW]
[ROW][C]4[/C][C]-0.236664[/C][C]-2.5817[/C][C]0.005522[/C][/ROW]
[ROW][C]5[/C][C]-0.241398[/C][C]-2.6333[/C][C]0.004789[/C][/ROW]
[ROW][C]6[/C][C]0.056095[/C][C]0.6119[/C][C]0.270877[/C][/ROW]
[ROW][C]7[/C][C]-0.184129[/C][C]-2.0086[/C][C]0.023421[/C][/ROW]
[ROW][C]8[/C][C]-0.185605[/C][C]-2.0247[/C][C]0.022568[/C][/ROW]
[ROW][C]9[/C][C]-0.13342[/C][C]-1.4554[/C][C]0.074091[/C][/ROW]
[ROW][C]10[/C][C]-0.068637[/C][C]-0.7487[/C][C]0.227745[/C][/ROW]
[ROW][C]11[/C][C]0.254268[/C][C]2.7737[/C][C]0.003218[/C][/ROW]
[ROW][C]12[/C][C]0.832583[/C][C]9.0824[/C][C]0[/C][/ROW]
[ROW][C]13[/C][C]0.259529[/C][C]2.8311[/C][C]0.002724[/C][/ROW]
[ROW][C]14[/C][C]-0.060207[/C][C]-0.6568[/C][C]0.256295[/C][/ROW]
[ROW][C]15[/C][C]-0.147572[/C][C]-1.6098[/C][C]0.055043[/C][/ROW]
[ROW][C]16[/C][C]-0.249725[/C][C]-2.7242[/C][C]0.003709[/C][/ROW]
[ROW][C]17[/C][C]-0.189637[/C][C]-2.0687[/C][C]0.02037[/C][/ROW]
[ROW][C]18[/C][C]0.038387[/C][C]0.4188[/C][C]0.338074[/C][/ROW]
[ROW][C]19[/C][C]-0.120784[/C][C]-1.3176[/C][C]0.095085[/C][/ROW]
[ROW][C]20[/C][C]-0.12701[/C][C]-1.3855[/C][C]0.084244[/C][/ROW]
[ROW][C]21[/C][C]-0.131917[/C][C]-1.439[/C][C]0.076382[/C][/ROW]
[ROW][C]22[/C][C]-0.105659[/C][C]-1.1526[/C][C]0.125692[/C][/ROW]
[ROW][C]23[/C][C]0.233387[/C][C]2.5459[/C][C]0.006088[/C][/ROW]
[ROW][C]24[/C][C]0.678473[/C][C]7.4013[/C][C]0[/C][/ROW]
[ROW][C]25[/C][C]0.227569[/C][C]2.4825[/C][C]0.007221[/C][/ROW]
[ROW][C]26[/C][C]-0.056326[/C][C]-0.6144[/C][C]0.270049[/C][/ROW]
[ROW][C]27[/C][C]-0.124487[/C][C]-1.358[/C][C]0.088518[/C][/ROW]
[ROW][C]28[/C][C]-0.253696[/C][C]-2.7675[/C][C]0.003276[/C][/ROW]
[ROW][C]29[/C][C]-0.153635[/C][C]-1.676[/C][C]0.048186[/C][/ROW]
[ROW][C]30[/C][C]0.024561[/C][C]0.2679[/C][C]0.394608[/C][/ROW]
[ROW][C]31[/C][C]-0.069331[/C][C]-0.7563[/C][C]0.22548[/C][/ROW]
[ROW][C]32[/C][C]-0.094253[/C][C]-1.0282[/C][C]0.152974[/C][/ROW]
[ROW][C]33[/C][C]-0.129504[/C][C]-1.4127[/C][C]0.080174[/C][/ROW]
[ROW][C]34[/C][C]-0.134832[/C][C]-1.4708[/C][C]0.071986[/C][/ROW]
[ROW][C]35[/C][C]0.210389[/C][C]2.2951[/C][C]0.01174[/C][/ROW]
[ROW][C]36[/C][C]0.540084[/C][C]5.8916[/C][C]0[/C][/ROW]
[ROW][C]37[/C][C]0.199385[/C][C]2.175[/C][C]0.015803[/C][/ROW]
[ROW][C]38[/C][C]-0.034646[/C][C]-0.3779[/C][C]0.353071[/C][/ROW]
[ROW][C]39[/C][C]-0.093396[/C][C]-1.0188[/C][C]0.155175[/C][/ROW]
[ROW][C]40[/C][C]-0.243918[/C][C]-2.6608[/C][C]0.004435[/C][/ROW]
[ROW][C]41[/C][C]-0.109595[/C][C]-1.1955[/C][C]0.117127[/C][/ROW]
[ROW][C]42[/C][C]-0.002939[/C][C]-0.0321[/C][C]0.487237[/C][/ROW]
[ROW][C]43[/C][C]-0.047195[/C][C]-0.5148[/C][C]0.30381[/C][/ROW]
[ROW][C]44[/C][C]-0.068313[/C][C]-0.7452[/C][C]0.228807[/C][/ROW]
[ROW][C]45[/C][C]-0.13802[/C][C]-1.5056[/C][C]0.067407[/C][/ROW]
[ROW][C]46[/C][C]-0.152322[/C][C]-1.6616[/C][C]0.049609[/C][/ROW]
[ROW][C]47[/C][C]0.178345[/C][C]1.9455[/C][C]0.027035[/C][/ROW]
[ROW][C]48[/C][C]0.425428[/C][C]4.6409[/C][C]4e-06[/C][/ROW]
[/TABLE]
Source: https://freestatistics.org/blog/index.php?pk=295872&T=1

Globally Unique Identifier (entire table): ba.freestatistics.org/blog/index.php?pk=295872&T=1

As an alternative you can also use a QR Code:  

The GUIDs for individual cells are displayed in the table below:

Autocorrelation Function
Time lag kACF(k)T-STATP-value
10.2697132.94220.001959
2-0.061353-0.66930.252307
3-0.143238-1.56250.060408
4-0.236664-2.58170.005522
5-0.241398-2.63330.004789
60.0560950.61190.270877
7-0.184129-2.00860.023421
8-0.185605-2.02470.022568
9-0.13342-1.45540.074091
10-0.068637-0.74870.227745
110.2542682.77370.003218
120.8325839.08240
130.2595292.83110.002724
14-0.060207-0.65680.256295
15-0.147572-1.60980.055043
16-0.249725-2.72420.003709
17-0.189637-2.06870.02037
180.0383870.41880.338074
19-0.120784-1.31760.095085
20-0.12701-1.38550.084244
21-0.131917-1.4390.076382
22-0.105659-1.15260.125692
230.2333872.54590.006088
240.6784737.40130
250.2275692.48250.007221
26-0.056326-0.61440.270049
27-0.124487-1.3580.088518
28-0.253696-2.76750.003276
29-0.153635-1.6760.048186
300.0245610.26790.394608
31-0.069331-0.75630.22548
32-0.094253-1.02820.152974
33-0.129504-1.41270.080174
34-0.134832-1.47080.071986
350.2103892.29510.01174
360.5400845.89160
370.1993852.1750.015803
38-0.034646-0.37790.353071
39-0.093396-1.01880.155175
40-0.243918-2.66080.004435
41-0.109595-1.19550.117127
42-0.002939-0.03210.487237
43-0.047195-0.51480.30381
44-0.068313-0.74520.228807
45-0.13802-1.50560.067407
46-0.152322-1.66160.049609
470.1783451.94550.027035
480.4254284.64094e-06


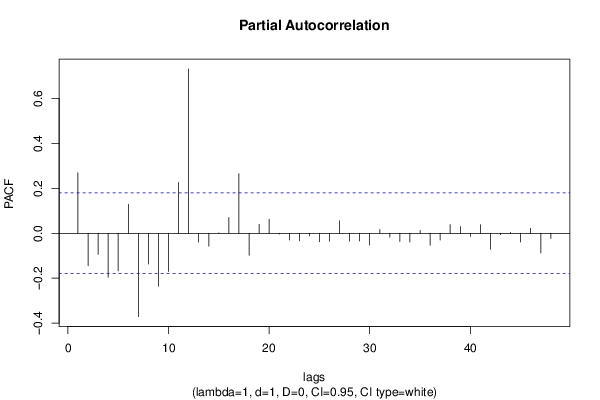
Partial Autocorrelation Function
Time lag kPACF(k)T-STATP-value
10.2697132.94220.001959
2-0.144618-1.57760.058657
3-0.093948-1.02490.153755
4-0.195749-2.13540.017391
5-0.167708-1.82950.034916
60.1288771.40590.081182
7-0.371384-4.05134.6e-05
8-0.136721-1.49150.069245
9-0.236106-2.57560.005615
10-0.170199-1.85670.032917
110.2263072.46870.00749
120.7315887.98070
13-0.03944-0.43020.333901
14-0.057279-0.62480.266638
150.0008270.0090.496407
160.0699360.76290.223512
170.2646852.88740.002308
18-0.097929-1.06830.143779
190.0396960.4330.332889
200.062250.67910.249207
21-0.003586-0.03910.484432
22-0.03023-0.32980.371078
23-0.033664-0.36720.357048
24-0.011731-0.1280.449193
25-0.03789-0.41330.340053
26-0.035423-0.38640.349938
270.056010.6110.271185
28-0.03524-0.38440.350674
29-0.034341-0.37460.354305
30-0.052692-0.57480.283254
310.0166750.18190.427984
32-0.017303-0.18880.425303
33-0.036957-0.40320.343779
34-0.038911-0.42450.335994
350.0119150.130.448401
36-0.05347-0.58330.280402
37-0.030121-0.32860.371526
380.0383690.41860.338149
390.0296220.32310.373581
40-0.014056-0.15330.439199
410.0380560.41510.339391
42-0.071498-0.780.218483
43-0.006318-0.06890.472583
440.0042680.04660.481471
45-0.039142-0.4270.33508
460.0219090.2390.405757
47-0.088063-0.96070.169336
48-0.022992-0.25080.401195

\begin{tabular}{lllllllll}
\hline
Partial Autocorrelation Function \tabularnewline
Time lag k & PACF(k) & T-STAT & P-value \tabularnewline
1 & 0.269713 & 2.9422 & 0.001959 \tabularnewline
2 & -0.144618 & -1.5776 & 0.058657 \tabularnewline
3 & -0.093948 & -1.0249 & 0.153755 \tabularnewline
4 & -0.195749 & -2.1354 & 0.017391 \tabularnewline
5 & -0.167708 & -1.8295 & 0.034916 \tabularnewline
6 & 0.128877 & 1.4059 & 0.081182 \tabularnewline
7 & -0.371384 & -4.0513 & 4.6e-05 \tabularnewline
8 & -0.136721 & -1.4915 & 0.069245 \tabularnewline
9 & -0.236106 & -2.5756 & 0.005615 \tabularnewline
10 & -0.170199 & -1.8567 & 0.032917 \tabularnewline
11 & 0.226307 & 2.4687 & 0.00749 \tabularnewline
12 & 0.731588 & 7.9807 & 0 \tabularnewline
13 & -0.03944 & -0.4302 & 0.333901 \tabularnewline
14 & -0.057279 & -0.6248 & 0.266638 \tabularnewline
15 & 0.000827 & 0.009 & 0.496407 \tabularnewline
16 & 0.069936 & 0.7629 & 0.223512 \tabularnewline
17 & 0.264685 & 2.8874 & 0.002308 \tabularnewline
18 & -0.097929 & -1.0683 & 0.143779 \tabularnewline
19 & 0.039696 & 0.433 & 0.332889 \tabularnewline
20 & 0.06225 & 0.6791 & 0.249207 \tabularnewline
21 & -0.003586 & -0.0391 & 0.484432 \tabularnewline
22 & -0.03023 & -0.3298 & 0.371078 \tabularnewline
23 & -0.033664 & -0.3672 & 0.357048 \tabularnewline
24 & -0.011731 & -0.128 & 0.449193 \tabularnewline
25 & -0.03789 & -0.4133 & 0.340053 \tabularnewline
26 & -0.035423 & -0.3864 & 0.349938 \tabularnewline
27 & 0.05601 & 0.611 & 0.271185 \tabularnewline
28 & -0.03524 & -0.3844 & 0.350674 \tabularnewline
29 & -0.034341 & -0.3746 & 0.354305 \tabularnewline
30 & -0.052692 & -0.5748 & 0.283254 \tabularnewline
31 & 0.016675 & 0.1819 & 0.427984 \tabularnewline
32 & -0.017303 & -0.1888 & 0.425303 \tabularnewline
33 & -0.036957 & -0.4032 & 0.343779 \tabularnewline
34 & -0.038911 & -0.4245 & 0.335994 \tabularnewline
35 & 0.011915 & 0.13 & 0.448401 \tabularnewline
36 & -0.05347 & -0.5833 & 0.280402 \tabularnewline
37 & -0.030121 & -0.3286 & 0.371526 \tabularnewline
38 & 0.038369 & 0.4186 & 0.338149 \tabularnewline
39 & 0.029622 & 0.3231 & 0.373581 \tabularnewline
40 & -0.014056 & -0.1533 & 0.439199 \tabularnewline
41 & 0.038056 & 0.4151 & 0.339391 \tabularnewline
42 & -0.071498 & -0.78 & 0.218483 \tabularnewline
43 & -0.006318 & -0.0689 & 0.472583 \tabularnewline
44 & 0.004268 & 0.0466 & 0.481471 \tabularnewline
45 & -0.039142 & -0.427 & 0.33508 \tabularnewline
46 & 0.021909 & 0.239 & 0.405757 \tabularnewline
47 & -0.088063 & -0.9607 & 0.169336 \tabularnewline
48 & -0.022992 & -0.2508 & 0.401195 \tabularnewline
\hline
\end{tabular}
%Source: https://freestatistics.org/blog/index.php?pk=295872&T=2

[TABLE]
[ROW][C]Partial Autocorrelation Function[/C][/ROW]
[ROW][C]Time lag k[/C][C]PACF(k)[/C][C]T-STAT[/C][C]P-value[/C][/ROW]
[ROW][C]1[/C][C]0.269713[/C][C]2.9422[/C][C]0.001959[/C][/ROW]
[ROW][C]2[/C][C]-0.144618[/C][C]-1.5776[/C][C]0.058657[/C][/ROW]
[ROW][C]3[/C][C]-0.093948[/C][C]-1.0249[/C][C]0.153755[/C][/ROW]
[ROW][C]4[/C][C]-0.195749[/C][C]-2.1354[/C][C]0.017391[/C][/ROW]
[ROW][C]5[/C][C]-0.167708[/C][C]-1.8295[/C][C]0.034916[/C][/ROW]
[ROW][C]6[/C][C]0.128877[/C][C]1.4059[/C][C]0.081182[/C][/ROW]
[ROW][C]7[/C][C]-0.371384[/C][C]-4.0513[/C][C]4.6e-05[/C][/ROW]
[ROW][C]8[/C][C]-0.136721[/C][C]-1.4915[/C][C]0.069245[/C][/ROW]
[ROW][C]9[/C][C]-0.236106[/C][C]-2.5756[/C][C]0.005615[/C][/ROW]
[ROW][C]10[/C][C]-0.170199[/C][C]-1.8567[/C][C]0.032917[/C][/ROW]
[ROW][C]11[/C][C]0.226307[/C][C]2.4687[/C][C]0.00749[/C][/ROW]
[ROW][C]12[/C][C]0.731588[/C][C]7.9807[/C][C]0[/C][/ROW]
[ROW][C]13[/C][C]-0.03944[/C][C]-0.4302[/C][C]0.333901[/C][/ROW]
[ROW][C]14[/C][C]-0.057279[/C][C]-0.6248[/C][C]0.266638[/C][/ROW]
[ROW][C]15[/C][C]0.000827[/C][C]0.009[/C][C]0.496407[/C][/ROW]
[ROW][C]16[/C][C]0.069936[/C][C]0.7629[/C][C]0.223512[/C][/ROW]
[ROW][C]17[/C][C]0.264685[/C][C]2.8874[/C][C]0.002308[/C][/ROW]
[ROW][C]18[/C][C]-0.097929[/C][C]-1.0683[/C][C]0.143779[/C][/ROW]
[ROW][C]19[/C][C]0.039696[/C][C]0.433[/C][C]0.332889[/C][/ROW]
[ROW][C]20[/C][C]0.06225[/C][C]0.6791[/C][C]0.249207[/C][/ROW]
[ROW][C]21[/C][C]-0.003586[/C][C]-0.0391[/C][C]0.484432[/C][/ROW]
[ROW][C]22[/C][C]-0.03023[/C][C]-0.3298[/C][C]0.371078[/C][/ROW]
[ROW][C]23[/C][C]-0.033664[/C][C]-0.3672[/C][C]0.357048[/C][/ROW]
[ROW][C]24[/C][C]-0.011731[/C][C]-0.128[/C][C]0.449193[/C][/ROW]
[ROW][C]25[/C][C]-0.03789[/C][C]-0.4133[/C][C]0.340053[/C][/ROW]
[ROW][C]26[/C][C]-0.035423[/C][C]-0.3864[/C][C]0.349938[/C][/ROW]
[ROW][C]27[/C][C]0.05601[/C][C]0.611[/C][C]0.271185[/C][/ROW]
[ROW][C]28[/C][C]-0.03524[/C][C]-0.3844[/C][C]0.350674[/C][/ROW]
[ROW][C]29[/C][C]-0.034341[/C][C]-0.3746[/C][C]0.354305[/C][/ROW]
[ROW][C]30[/C][C]-0.052692[/C][C]-0.5748[/C][C]0.283254[/C][/ROW]
[ROW][C]31[/C][C]0.016675[/C][C]0.1819[/C][C]0.427984[/C][/ROW]
[ROW][C]32[/C][C]-0.017303[/C][C]-0.1888[/C][C]0.425303[/C][/ROW]
[ROW][C]33[/C][C]-0.036957[/C][C]-0.4032[/C][C]0.343779[/C][/ROW]
[ROW][C]34[/C][C]-0.038911[/C][C]-0.4245[/C][C]0.335994[/C][/ROW]
[ROW][C]35[/C][C]0.011915[/C][C]0.13[/C][C]0.448401[/C][/ROW]
[ROW][C]36[/C][C]-0.05347[/C][C]-0.5833[/C][C]0.280402[/C][/ROW]
[ROW][C]37[/C][C]-0.030121[/C][C]-0.3286[/C][C]0.371526[/C][/ROW]
[ROW][C]38[/C][C]0.038369[/C][C]0.4186[/C][C]0.338149[/C][/ROW]
[ROW][C]39[/C][C]0.029622[/C][C]0.3231[/C][C]0.373581[/C][/ROW]
[ROW][C]40[/C][C]-0.014056[/C][C]-0.1533[/C][C]0.439199[/C][/ROW]
[ROW][C]41[/C][C]0.038056[/C][C]0.4151[/C][C]0.339391[/C][/ROW]
[ROW][C]42[/C][C]-0.071498[/C][C]-0.78[/C][C]0.218483[/C][/ROW]
[ROW][C]43[/C][C]-0.006318[/C][C]-0.0689[/C][C]0.472583[/C][/ROW]
[ROW][C]44[/C][C]0.004268[/C][C]0.0466[/C][C]0.481471[/C][/ROW]
[ROW][C]45[/C][C]-0.039142[/C][C]-0.427[/C][C]0.33508[/C][/ROW]
[ROW][C]46[/C][C]0.021909[/C][C]0.239[/C][C]0.405757[/C][/ROW]
[ROW][C]47[/C][C]-0.088063[/C][C]-0.9607[/C][C]0.169336[/C][/ROW]
[ROW][C]48[/C][C]-0.022992[/C][C]-0.2508[/C][C]0.401195[/C][/ROW]
[/TABLE]
Source: https://freestatistics.org/blog/index.php?pk=295872&T=2

Globally Unique Identifier (entire table): ba.freestatistics.org/blog/index.php?pk=295872&T=2

As an alternative you can also use a QR Code:  

The GUIDs for individual cells are displayed in the table below:

Partial Autocorrelation Function
Time lag kPACF(k)T-STATP-value
10.2697132.94220.001959
2-0.144618-1.57760.058657
3-0.093948-1.02490.153755
4-0.195749-2.13540.017391
5-0.167708-1.82950.034916
60.1288771.40590.081182
7-0.371384-4.05134.6e-05
8-0.136721-1.49150.069245
9-0.236106-2.57560.005615
10-0.170199-1.85670.032917
110.2263072.46870.00749
120.7315887.98070
13-0.03944-0.43020.333901
14-0.057279-0.62480.266638
150.0008270.0090.496407
160.0699360.76290.223512
170.2646852.88740.002308
18-0.097929-1.06830.143779
190.0396960.4330.332889
200.062250.67910.249207
21-0.003586-0.03910.484432
22-0.03023-0.32980.371078
23-0.033664-0.36720.357048
24-0.011731-0.1280.449193
25-0.03789-0.41330.340053
26-0.035423-0.38640.349938
270.056010.6110.271185
28-0.03524-0.38440.350674
29-0.034341-0.37460.354305
30-0.052692-0.57480.283254
310.0166750.18190.427984
32-0.017303-0.18880.425303
33-0.036957-0.40320.343779
34-0.038911-0.42450.335994
350.0119150.130.448401
36-0.05347-0.58330.280402
37-0.030121-0.32860.371526
380.0383690.41860.338149
390.0296220.32310.373581
40-0.014056-0.15330.439199
410.0380560.41510.339391
42-0.071498-0.780.218483
43-0.006318-0.06890.472583
440.0042680.04660.481471
45-0.039142-0.4270.33508
460.0219090.2390.405757
47-0.088063-0.96070.169336
48-0.022992-0.25080.401195


Parameters (Session):
par1 = 48 ; par2 = 1 ; par3 = 1 ; par4 = 0 ; par5 = 12 ; par6 = White Noise ; par7 = 0.95 ;
Parameters (R input):
par1 = 48 ; par2 = 1 ; par3 = 1 ; par4 = 0 ; par5 = 12 ; par6 = White Noise ; par7 = 0.95 ; par8 = ;
R code (references can be found in the software module):
if (par1 == 'Default') {
par1 = 10*log10(length(x))
} else {
par1 <- as.numeric(par1)
}
par2 <- as.numeric(par2)
par3 <- as.numeric(par3)
par4 <- as.numeric(par4)
par5 <- as.numeric(par5)
if (par6 == 'White Noise') par6 <- 'white' else par6 <- 'ma'
par7 <- as.numeric(par7)
if (par8 != '') par8 <- as.numeric(par8)
x <- na.omit(x)
ox <- x
if (par8 == '') {
if (par2 == 0) {
x <- log(x)
} else {
x <- (x ^ par2 - 1) / par2
}
} else {
x <- log(x,base=par8)
}
if (par3 > 0) x <- diff(x,lag=1,difference=par3)
if (par4 > 0) x <- diff(x,lag=par5,difference=par4)
bitmap(file='picts.png')
op <- par(mfrow=c(2,1))
plot(ox,type='l',main='Original Time Series',xlab='time',ylab='value')
if (par8=='') {
mytitle <- paste('Working Time Series (lambda=',par2,', d=',par3,', D=',par4,')',sep='')
mysub <- paste('(lambda=',par2,', d=',par3,', D=',par4,', CI=', par7, ', CI type=',par6,')',sep='')
} else {
mytitle <- paste('Working Time Series (base=',par8,', d=',par3,', D=',par4,')',sep='')
mysub <- paste('(base=',par8,', d=',par3,', D=',par4,', CI=', par7, ', CI type=',par6,')',sep='')
}
plot(x,type='l', main=mytitle,xlab='time',ylab='value')
par(op)
dev.off()
bitmap(file='pic1.png')
racf <- acf(x, par1, main='Autocorrelation', xlab='time lag', ylab='ACF', ci.type=par6, ci=par7, sub=mysub)
dev.off()
bitmap(file='pic2.png')
rpacf <- pacf(x,par1,main='Partial Autocorrelation',xlab='lags',ylab='PACF',sub=mysub)
dev.off()
(myacf <- c(racf$acf))
(mypacf <- c(rpacf$acf))
lengthx <- length(x)
sqrtn <- sqrt(lengthx)
load(file='createtable')
a<-table.start()
a<-table.row.start(a)
a<-table.element(a,'Autocorrelation Function',4,TRUE)
a<-table.row.end(a)
a<-table.row.start(a)
a<-table.element(a,'Time lag k',header=TRUE)
a<-table.element(a,hyperlink('basics.htm','ACF(k)','click here for more information about the Autocorrelation Function'),header=TRUE)
a<-table.element(a,'T-STAT',header=TRUE)
a<-table.element(a,'P-value',header=TRUE)
a<-table.row.end(a)
for (i in 2:(par1+1)) {
a<-table.row.start(a)
a<-table.element(a,i-1,header=TRUE)
a<-table.element(a,round(myacf[i],6))
mytstat <- myacf[i]*sqrtn
a<-table.element(a,round(mytstat,4))
a<-table.element(a,round(1-pt(abs(mytstat),lengthx),6))
a<-table.row.end(a)
}
a<-table.end(a)
table.save(a,file='mytable.tab')
a<-table.start()
a<-table.row.start(a)
a<-table.element(a,'Partial Autocorrelation Function',4,TRUE)
a<-table.row.end(a)
a<-table.row.start(a)
a<-table.element(a,'Time lag k',header=TRUE)
a<-table.element(a,hyperlink('basics.htm','PACF(k)','click here for more information about the Partial Autocorrelation Function'),header=TRUE)
a<-table.element(a,'T-STAT',header=TRUE)
a<-table.element(a,'P-value',header=TRUE)
a<-table.row.end(a)
for (i in 1:par1) {
a<-table.row.start(a)
a<-table.element(a,i,header=TRUE)
a<-table.element(a,round(mypacf[i],6))
mytstat <- mypacf[i]*sqrtn
a<-table.element(a,round(mytstat,4))
a<-table.element(a,round(1-pt(abs(mytstat),lengthx),6))
a<-table.row.end(a)
}
a<-table.end(a)
table.save(a,file='mytable1.tab')