Free Statistics

of Irreproducible Research!

Author's title

Author*Unverified author*
R Software Modulerwasp_smp.wasp
Title produced by softwareStandard Deviation-Mean Plot
Date of computationMon, 18 Jul 2016 09:45:34 +0100
Cite this page as followsStatistical Computations at FreeStatistics.org, Office for Research Development and Education, URL https://freestatistics.org/blog/index.php?v=date/2016/Jul/18/t146883158204bl3zgedtde8mh.htm/, Retrieved Fri, 03 May 2024 07:21:39 +0000
Statistical Computations at FreeStatistics.org, Office for Research Development and Education, URL https://freestatistics.org/blog/index.php?pk=295887, Retrieved Fri, 03 May 2024 07:21:39 +0000
QR Codes:

Original text written by user:
IsPrivate?No (this computation is public)
User-defined keywords
Estimated Impact152
Family? (F = Feedback message, R = changed R code, M = changed R Module, P = changed Parameters, D = changed Data)
-     [Univariate Data Series] [] [2016-07-18 07:02:10] [53ea9856f51a263258ed46ae39fddedd]
- RMPD    [Standard Deviation-Mean Plot] [] [2016-07-18 08:45:34] [b94c13d84d922b33c8d74b1e5b1d38c1] [Current]
Feedback Forum

Post a new message
Dataseries X:
1943
1932
1922
1901
2108
2098
1943
1839
1850
1850
1860
1881
1839
1819
1757
1664
1922
1839
1633
1674
1633
1736
1591
1684
1602
1581
1416
1354
1664
1602
1405
1529
1426
1509
1426
1571
1447
1426
1230
1168
1612
1509
1333
1498
1374
1333
1312
1416
1240
1240
1095
1044
1560
1426
1302
1405
1261
1199
1250
1405
1199
1281
1178
1137
1591
1498
1250
1374
1312
1354
1426
1622
1488
1540
1457
1395
1860
1746
1467
1426
1343
1374
1354
1529
1343
1405
1364
1323
1829
1726
1447
1343
1188
1199
1178
1323
1064
1054
1013
899
1467
1405
1095
1002
847
816
713
858
486
444
403
331
940
889
568
506
351
362
300
403


Summary of computational transaction
Raw Inputview raw input (R code)
Raw Outputview raw output of R engine
Computing time1 seconds
R Server'Gertrude Mary Cox' @ cox.wessa.net

\begin{tabular}{lllllllll}
\hline
Summary of computational transaction \tabularnewline
Raw Input & view raw input (R code)  \tabularnewline
Raw Output & view raw output of R engine  \tabularnewline
Computing time & 1 seconds \tabularnewline
R Server & 'Gertrude Mary Cox' @ cox.wessa.net \tabularnewline
\hline
\end{tabular}
%Source: https://freestatistics.org/blog/index.php?pk=295887&T=0

[TABLE]
[ROW][C]Summary of computational transaction[/C][/ROW]
[ROW][C]Raw Input[/C][C]view raw input (R code) [/C][/ROW]
[ROW][C]Raw Output[/C][C]view raw output of R engine [/C][/ROW]
[ROW][C]Computing time[/C][C]1 seconds[/C][/ROW]
[ROW][C]R Server[/C][C]'Gertrude Mary Cox' @ cox.wessa.net[/C][/ROW]
[/TABLE]
Source: https://freestatistics.org/blog/index.php?pk=295887&T=0

Globally Unique Identifier (entire table): ba.freestatistics.org/blog/index.php?pk=295887&T=0

As an alternative you can also use a QR Code:  

The GUIDs for individual cells are displayed in the table below:

Summary of computational transaction
Raw Inputview raw input (R code)
Raw Outputview raw output of R engine
Computing time1 seconds
R Server'Gertrude Mary Cox' @ cox.wessa.net


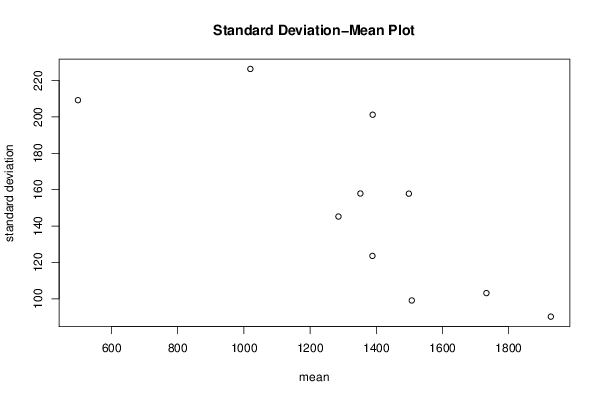
Standard Deviation-Mean Plot
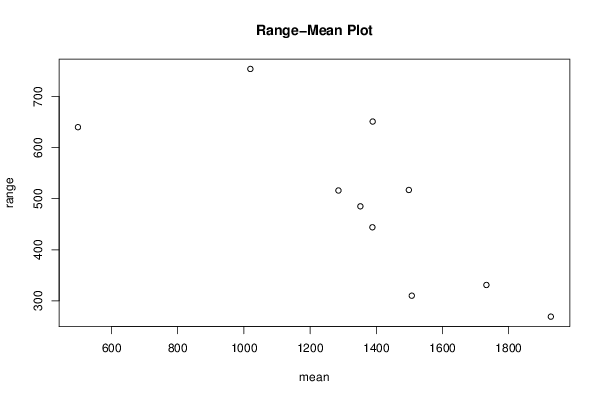
SectionMeanStandard DeviationRange
11927.2590.1747041732174269
21732.58333333333103.123454993018331
31507.0833333333399.0752315927221310
41388.16666666667123.587167128258444
51285.58333333333145.233015488486516
61351.83333333333157.899757230128485
71498.25157.81008436495517
81389201.219012295287651
91019.41666666667226.394449953388754
10498.583333333333209.222134381503640

\begin{tabular}{lllllllll}
\hline
Standard Deviation-Mean Plot \tabularnewline
Section & Mean & Standard Deviation & Range \tabularnewline
1 & 1927.25 & 90.1747041732174 & 269 \tabularnewline
2 & 1732.58333333333 & 103.123454993018 & 331 \tabularnewline
3 & 1507.08333333333 & 99.0752315927221 & 310 \tabularnewline
4 & 1388.16666666667 & 123.587167128258 & 444 \tabularnewline
5 & 1285.58333333333 & 145.233015488486 & 516 \tabularnewline
6 & 1351.83333333333 & 157.899757230128 & 485 \tabularnewline
7 & 1498.25 & 157.81008436495 & 517 \tabularnewline
8 & 1389 & 201.219012295287 & 651 \tabularnewline
9 & 1019.41666666667 & 226.394449953388 & 754 \tabularnewline
10 & 498.583333333333 & 209.222134381503 & 640 \tabularnewline
\hline
\end{tabular}
%Source: https://freestatistics.org/blog/index.php?pk=295887&T=1

[TABLE]
[ROW][C]Standard Deviation-Mean Plot[/C][/ROW]
[ROW][C]Section[/C][C]Mean[/C][C]Standard Deviation[/C][C]Range[/C][/ROW]
[ROW][C]1[/C][C]1927.25[/C][C]90.1747041732174[/C][C]269[/C][/ROW]
[ROW][C]2[/C][C]1732.58333333333[/C][C]103.123454993018[/C][C]331[/C][/ROW]
[ROW][C]3[/C][C]1507.08333333333[/C][C]99.0752315927221[/C][C]310[/C][/ROW]
[ROW][C]4[/C][C]1388.16666666667[/C][C]123.587167128258[/C][C]444[/C][/ROW]
[ROW][C]5[/C][C]1285.58333333333[/C][C]145.233015488486[/C][C]516[/C][/ROW]
[ROW][C]6[/C][C]1351.83333333333[/C][C]157.899757230128[/C][C]485[/C][/ROW]
[ROW][C]7[/C][C]1498.25[/C][C]157.81008436495[/C][C]517[/C][/ROW]
[ROW][C]8[/C][C]1389[/C][C]201.219012295287[/C][C]651[/C][/ROW]
[ROW][C]9[/C][C]1019.41666666667[/C][C]226.394449953388[/C][C]754[/C][/ROW]
[ROW][C]10[/C][C]498.583333333333[/C][C]209.222134381503[/C][C]640[/C][/ROW]
[/TABLE]
Source: https://freestatistics.org/blog/index.php?pk=295887&T=1

Globally Unique Identifier (entire table): ba.freestatistics.org/blog/index.php?pk=295887&T=1

As an alternative you can also use a QR Code:  

The GUIDs for individual cells are displayed in the table below:

Standard Deviation-Mean Plot
SectionMeanStandard DeviationRange
11927.2590.1747041732174269
21732.58333333333103.123454993018331
31507.0833333333399.0752315927221310
41388.16666666667123.587167128258444
51285.58333333333145.233015488486516
61351.83333333333157.899757230128485
71498.25157.81008436495517
81389201.219012295287651
91019.41666666667226.394449953388754
10498.583333333333209.222134381503640


Regression: S.E.(k) = alpha + beta * Mean(k)
alpha284.515166058026
beta-0.0979141879339823
S.D.0.0271510365572308
T-STAT-3.60627807809813
p-value0.00691894502810646

\begin{tabular}{lllllllll}
\hline
Regression: S.E.(k) = alpha + beta * Mean(k) \tabularnewline
alpha & 284.515166058026 \tabularnewline
beta & -0.0979141879339823 \tabularnewline
S.D. & 0.0271510365572308 \tabularnewline
T-STAT & -3.60627807809813 \tabularnewline
p-value & 0.00691894502810646 \tabularnewline
\hline
\end{tabular}
%Source: https://freestatistics.org/blog/index.php?pk=295887&T=2

[TABLE]
[ROW][C]Regression: S.E.(k) = alpha + beta * Mean(k)[/C][/ROW]
[ROW][C]alpha[/C][C]284.515166058026[/C][/ROW]
[ROW][C]beta[/C][C]-0.0979141879339823[/C][/ROW]
[ROW][C]S.D.[/C][C]0.0271510365572308[/C][/ROW]
[ROW][C]T-STAT[/C][C]-3.60627807809813[/C][/ROW]
[ROW][C]p-value[/C][C]0.00691894502810646[/C][/ROW]
[/TABLE]
Source: https://freestatistics.org/blog/index.php?pk=295887&T=2

Globally Unique Identifier (entire table): ba.freestatistics.org/blog/index.php?pk=295887&T=2

As an alternative you can also use a QR Code:  

The GUIDs for individual cells are displayed in the table below:

Regression: S.E.(k) = alpha + beta * Mean(k)
alpha284.515166058026
beta-0.0979141879339823
S.D.0.0271510365572308
T-STAT-3.60627807809813
p-value0.00691894502810646


Regression: ln S.E.(k) = alpha + beta * ln Mean(k)
alpha9.35232077060154
beta-0.611486919832253
S.D.0.22058561550257
T-STAT-2.77210695919167
p-value0.0242177863492112
Lambda1.61148691983225

\begin{tabular}{lllllllll}
\hline
Regression: ln S.E.(k) = alpha + beta * ln Mean(k) \tabularnewline
alpha & 9.35232077060154 \tabularnewline
beta & -0.611486919832253 \tabularnewline
S.D. & 0.22058561550257 \tabularnewline
T-STAT & -2.77210695919167 \tabularnewline
p-value & 0.0242177863492112 \tabularnewline
Lambda & 1.61148691983225 \tabularnewline
\hline
\end{tabular}
%Source: https://freestatistics.org/blog/index.php?pk=295887&T=3

[TABLE]
[ROW][C]Regression: ln S.E.(k) = alpha + beta * ln Mean(k)[/C][/ROW]
[ROW][C]alpha[/C][C]9.35232077060154[/C][/ROW]
[ROW][C]beta[/C][C]-0.611486919832253[/C][/ROW]
[ROW][C]S.D.[/C][C]0.22058561550257[/C][/ROW]
[ROW][C]T-STAT[/C][C]-2.77210695919167[/C][/ROW]
[ROW][C]p-value[/C][C]0.0242177863492112[/C][/ROW]
[ROW][C]Lambda[/C][C]1.61148691983225[/C][/ROW]
[/TABLE]
Source: https://freestatistics.org/blog/index.php?pk=295887&T=3

Globally Unique Identifier (entire table): ba.freestatistics.org/blog/index.php?pk=295887&T=3

As an alternative you can also use a QR Code:  

The GUIDs for individual cells are displayed in the table below:

Regression: ln S.E.(k) = alpha + beta * ln Mean(k)
alpha9.35232077060154
beta-0.611486919832253
S.D.0.22058561550257
T-STAT-2.77210695919167
p-value0.0242177863492112
Lambda1.61148691983225


Parameters (Session):
par1 = 12 ;
Parameters (R input):
par1 = 12 ;
R code (references can be found in the software module):
par1 <- as.numeric(par1)
(n <- length(x))
(np <- floor(n / par1))
arr <- array(NA,dim=c(par1,np))
j <- 0
k <- 1
for (i in 1:(np*par1))
{
j = j + 1
arr[j,k] <- x[i]
if (j == par1) {
j = 0
k=k+1
}
}
arr
arr.mean <- array(NA,dim=np)
arr.sd <- array(NA,dim=np)
arr.range <- array(NA,dim=np)
for (j in 1:np)
{
arr.mean[j] <- mean(arr[,j],na.rm=TRUE)
arr.sd[j] <- sd(arr[,j],na.rm=TRUE)
arr.range[j] <- max(arr[,j],na.rm=TRUE) - min(arr[,j],na.rm=TRUE)
}
arr.mean
arr.sd
arr.range
(lm1 <- lm(arr.sd~arr.mean))
(lnlm1 <- lm(log(arr.sd)~log(arr.mean)))
(lm2 <- lm(arr.range~arr.mean))
bitmap(file='test1.png')
plot(arr.mean,arr.sd,main='Standard Deviation-Mean Plot',xlab='mean',ylab='standard deviation')
dev.off()
bitmap(file='test2.png')
plot(arr.mean,arr.range,main='Range-Mean Plot',xlab='mean',ylab='range')
dev.off()
load(file='createtable')
a<-table.start()
a<-table.row.start(a)
a<-table.element(a,'Standard Deviation-Mean Plot',4,TRUE)
a<-table.row.end(a)
a<-table.row.start(a)
a<-table.element(a,'Section',header=TRUE)
a<-table.element(a,'Mean',header=TRUE)
a<-table.element(a,'Standard Deviation',header=TRUE)
a<-table.element(a,'Range',header=TRUE)
a<-table.row.end(a)
for (j in 1:np) {
a<-table.row.start(a)
a<-table.element(a,j,header=TRUE)
a<-table.element(a,arr.mean[j])
a<-table.element(a,arr.sd[j] )
a<-table.element(a,arr.range[j] )
a<-table.row.end(a)
}
a<-table.end(a)
table.save(a,file='mytable.tab')
a<-table.start()
a<-table.row.start(a)
a<-table.element(a,'Regression: S.E.(k) = alpha + beta * Mean(k)',2,TRUE)
a<-table.row.end(a)
a<-table.row.start(a)
a<-table.element(a,'alpha',header=TRUE)
a<-table.element(a,lm1$coefficients[[1]])
a<-table.row.end(a)
a<-table.row.start(a)
a<-table.element(a,'beta',header=TRUE)
a<-table.element(a,lm1$coefficients[[2]])
a<-table.row.end(a)
a<-table.row.start(a)
a<-table.element(a,'S.D.',header=TRUE)
a<-table.element(a,summary(lm1)$coefficients[2,2])
a<-table.row.end(a)
a<-table.row.start(a)
a<-table.element(a,'T-STAT',header=TRUE)
a<-table.element(a,summary(lm1)$coefficients[2,3])
a<-table.row.end(a)
a<-table.row.start(a)
a<-table.element(a,'p-value',header=TRUE)
a<-table.element(a,summary(lm1)$coefficients[2,4])
a<-table.row.end(a)
a<-table.end(a)
table.save(a,file='mytable1.tab')
a<-table.start()
a<-table.row.start(a)
a<-table.element(a,'Regression: ln S.E.(k) = alpha + beta * ln Mean(k)',2,TRUE)
a<-table.row.end(a)
a<-table.row.start(a)
a<-table.element(a,'alpha',header=TRUE)
a<-table.element(a,lnlm1$coefficients[[1]])
a<-table.row.end(a)
a<-table.row.start(a)
a<-table.element(a,'beta',header=TRUE)
a<-table.element(a,lnlm1$coefficients[[2]])
a<-table.row.end(a)
a<-table.row.start(a)
a<-table.element(a,'S.D.',header=TRUE)
a<-table.element(a,summary(lnlm1)$coefficients[2,2])
a<-table.row.end(a)
a<-table.row.start(a)
a<-table.element(a,'T-STAT',header=TRUE)
a<-table.element(a,summary(lnlm1)$coefficients[2,3])
a<-table.row.end(a)
a<-table.row.start(a)
a<-table.element(a,'p-value',header=TRUE)
a<-table.element(a,summary(lnlm1)$coefficients[2,4])
a<-table.row.end(a)
a<-table.row.start(a)
a<-table.element(a,'Lambda',header=TRUE)
a<-table.element(a,1-lnlm1$coefficients[[2]])
a<-table.row.end(a)
a<-table.end(a)
table.save(a,file='mytable2.tab')