Free Statistics
of Irreproducible Research!
Description of Statistical Computation | |||||||||||||||||||||||||||||||||||||
|---|---|---|---|---|---|---|---|---|---|---|---|---|---|---|---|---|---|---|---|---|---|---|---|---|---|---|---|---|---|---|---|---|---|---|---|---|---|
| Author's title | |||||||||||||||||||||||||||||||||||||
| Author | *Unverified author* | ||||||||||||||||||||||||||||||||||||
| R Software Module | rwasp_spearman.wasp | ||||||||||||||||||||||||||||||||||||
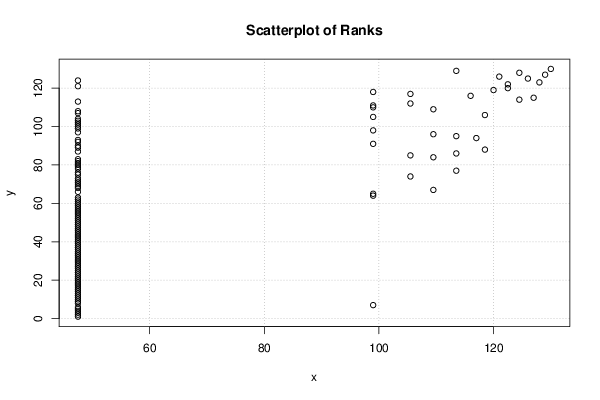
| Title produced by software | Spearman Rank Correlation | ||||||||||||||||||||||||||||||||||||
| Date of computation | Wed, 20 Jul 2016 17:53:52 +0100 | ||||||||||||||||||||||||||||||||||||
| Cite this page as follows | Statistical Computations at FreeStatistics.org, Office for Research Development and Education, URL https://freestatistics.org/blog/index.php?v=date/2016/Jul/20/t14690345635z1ymdlphi94tay.htm/, Retrieved Fri, 03 May 2024 16:36:50 +0000 | ||||||||||||||||||||||||||||||||||||
| Statistical Computations at FreeStatistics.org, Office for Research Development and Education, URL https://freestatistics.org/blog/index.php?pk=295902, Retrieved Fri, 03 May 2024 16:36:50 +0000 | |||||||||||||||||||||||||||||||||||||
| QR Codes: | |||||||||||||||||||||||||||||||||||||
|
| |||||||||||||||||||||||||||||||||||||
| Original text written by user: | PIB en millones seg�n la estimaci�n para el a�o 2016 del International Monetary Fund | ||||||||||||||||||||||||||||||||||||
| IsPrivate? | No (this computation is public) | ||||||||||||||||||||||||||||||||||||
| User-defined keywords | |||||||||||||||||||||||||||||||||||||
| Estimated Impact | 159 | ||||||||||||||||||||||||||||||||||||
Tree of Dependent Computations | |||||||||||||||||||||||||||||||||||||
| Family? (F = Feedback message, R = changed R code, M = changed R Module, P = changed Parameters, D = changed Data) | |||||||||||||||||||||||||||||||||||||
| - [Spearman Rank Correlation] [Correlaci�n n�m v...] [2016-07-20 16:53:52] [d41d8cd98f00b204e9800998ecf8427e] [Current] | |||||||||||||||||||||||||||||||||||||
| Feedback Forum | |||||||||||||||||||||||||||||||||||||
Post a new message | |||||||||||||||||||||||||||||||||||||
Dataset | |||||||||||||||||||||||||||||||||||||
| Dataseries X: | |||||||||||||||||||||||||||||||||||||
7 14 3 15 5 4 1 3 49 4 1 1 20 2 13 21 4 13 14 8 1 1 1 7 4 3 3 12 1 6 1 2 2 2 191 1 0 0 0 0 0 0 0 0 0 0 0 0 0 0 0 0 0 0 0 0 0 0 0 0 0 0 0 0 0 0 0 0 0 0 0 0 0 0 0 0 0 0 0 0 0 0 0 0 0 0 0 0 0 0 0 0 0 0 0 0 0 0 0 0 0 0 0 0 0 0 0 0 0 0 0 0 0 0 0 0 0 0 0 0 0 0 0 0 0 0 0 0 0 0 | |||||||||||||||||||||||||||||||||||||
| Dataseries Y: | |||||||||||||||||||||||||||||||||||||
404293 1138085 494121 3101247 1631943 482347 422422 332477 3934664 258702 149692 1092634 1615074 224999 2703378 2756748 8642758 2170909 4901102 1848518 17793 815646 1091700 832623 356209 168187 1005449 3684643 1720027 473413 160998 1665332 1099030 339481 18558129 552298 3010746 2227176 1108111 982380 971967 741031 723518 667443 647823 578651 576547 515745 471877 429120 414566 413846 389149 319818 289791 288382 285976 281939 287533 258444 257417 223024 187947 184438 183358 171363 169445 167692 141861 138461 136855 126968 125862 114701 97502 91096 88600 87196 83057 82725 82355 79884 78621 75535 74888 74391 73463 72644 70091 64799 63964 62709 60977 55730 54205 52947 49081 44306 41057 40532 37549 37322 36687 35832 34844 34575 33187 32650 31333 30878 29037 28102 28058 25341 25323 24647 24566 23306 22948 20095 19053 18901 18745 18595 15382 15154 10849 9166 2680 2097 | |||||||||||||||||||||||||||||||||||||
Tables (Output of Computation) | |||||||||||||||||||||||||||||||||||||
| |||||||||||||||||||||||||||||||||||||
Figures (Output of Computation) | |||||||||||||||||||||||||||||||||||||
Input Parameters & R Code | |||||||||||||||||||||||||||||||||||||
| Parameters (Session): | |||||||||||||||||||||||||||||||||||||
| Parameters (R input): | |||||||||||||||||||||||||||||||||||||
| R code (references can be found in the software module): | |||||||||||||||||||||||||||||||||||||
k <- cor.test(x,y,method='spearman') | |||||||||||||||||||||||||||||||||||||