Free Statistics

of Irreproducible Research!

Author's title

Author*Unverified author*
R Software Modulerwasp_autocorrelation.wasp
Title produced by software(Partial) Autocorrelation Function
Date of computationFri, 22 Jul 2016 08:34:14 +0100
Cite this page as followsStatistical Computations at FreeStatistics.org, Office for Research Development and Education, URL https://freestatistics.org/blog/index.php?v=date/2016/Jul/22/t1469172885ic1a2jcmmmpjpig.htm/, Retrieved Sun, 28 Apr 2024 22:58:14 +0000
Statistical Computations at FreeStatistics.org, Office for Research Development and Education, URL https://freestatistics.org/blog/index.php?pk=295922, Retrieved Sun, 28 Apr 2024 22:58:14 +0000
QR Codes:

Original text written by user:
IsPrivate?No (this computation is public)
User-defined keywords
Estimated Impact102
Family? (F = Feedback message, R = changed R code, M = changed R Module, P = changed Parameters, D = changed Data)
-       [(Partial) Autocorrelation Function] [] [2016-07-22 07:34:14] [d41d8cd98f00b204e9800998ecf8427e] [Current]
Feedback Forum

Post a new message
Dataseries X:
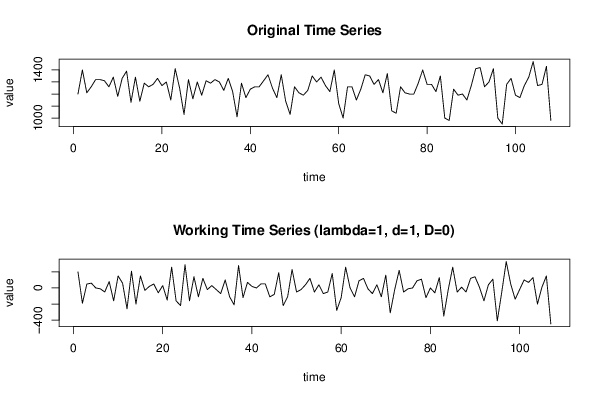
1200
1400
1210
1260
1320
1320
1310
1260
1340
1180
1330
1390
1130
1340
1140
1290
1260
1280
1330
1270
1300
1150
1410
1250
1030
1320
1160
1300
1190
1310
1290
1320
1300
1230
1330
1220
1010
1290
1170
1240
1260
1260
1310
1360
1250
1170
1360
1140
1030
1260
1210
1190
1230
1350
1300
1340
1270
1220
1400
1120
1000
1260
1260
1150
1240
1360
1350
1280
1320
1210
1370
1060
1040
1260
1210
1200
1200
1290
1400
1280
1280
1220
1350
1000
980
1240
1190
1200
1150
1270
1410
1420
1260
1300
1410
1000
950
1280
1330
1190
1170
1270
1340
1470
1270
1280
1430
980


Summary of computational transaction
Raw Inputview raw input (R code)
Raw Outputview raw output of R engine
Computing time2 seconds
R Server'Sir Maurice George Kendall' @ kendall.wessa.net

\begin{tabular}{lllllllll}
\hline
Summary of computational transaction \tabularnewline
Raw Input & view raw input (R code)  \tabularnewline
Raw Output & view raw output of R engine  \tabularnewline
Computing time & 2 seconds \tabularnewline
R Server & 'Sir Maurice George Kendall' @ kendall.wessa.net \tabularnewline
\hline
\end{tabular}
%Source: https://freestatistics.org/blog/index.php?pk=295922&T=0

[TABLE]
[ROW][C]Summary of computational transaction[/C][/ROW]
[ROW][C]Raw Input[/C][C]view raw input (R code) [/C][/ROW]
[ROW][C]Raw Output[/C][C]view raw output of R engine [/C][/ROW]
[ROW][C]Computing time[/C][C]2 seconds[/C][/ROW]
[ROW][C]R Server[/C][C]'Sir Maurice George Kendall' @ kendall.wessa.net[/C][/ROW]
[/TABLE]
Source: https://freestatistics.org/blog/index.php?pk=295922&T=0

Globally Unique Identifier (entire table): ba.freestatistics.org/blog/index.php?pk=295922&T=0

As an alternative you can also use a QR Code:  

The GUIDs for individual cells are displayed in the table below:

Summary of computational transaction
Raw Inputview raw input (R code)
Raw Outputview raw output of R engine
Computing time2 seconds
R Server'Sir Maurice George Kendall' @ kendall.wessa.net


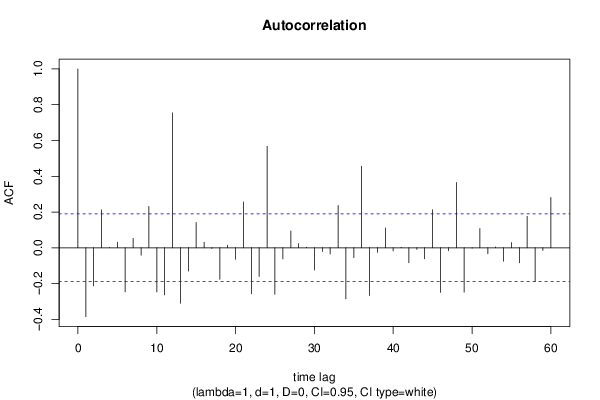
Autocorrelation Function
Time lag kACF(k)T-STATP-value
1-0.38501-3.98266.2e-05
2-0.212872-2.2020.014907
30.2121282.19430.015189
40.0006740.0070.497225
50.0310080.32070.374514
6-0.246642-2.55130.006073
70.0525490.54360.293935
8-0.041054-0.42470.335967
90.2312.38950.009311
10-0.246997-2.5550.006013
11-0.263431-2.72490.003757
120.7544347.80390
13-0.309997-3.20660.000886
14-0.129642-1.3410.091375
150.1416461.46520.0729
160.0307710.31830.375439
17-0.003644-0.03770.485001
18-0.17617-1.82230.0356
190.0140910.14580.442195
20-0.064027-0.66230.254601
210.2557412.64540.004694
22-0.257032-2.65880.004523
23-0.159889-1.65390.050539
240.5672765.8680
25-0.260251-2.69210.004122
26-0.062035-0.64170.261221
270.0939060.97140.166777
280.0238280.24650.402891
290.0028640.02960.488211
30-0.124559-1.28840.100185
31-0.020826-0.21540.414922
32-0.034743-0.35940.360007
330.2363142.44450.00807
34-0.284747-2.94550.001979
35-0.054807-0.56690.285976
360.4556514.71334e-06
37-0.266624-2.7580.003421
38-0.025654-0.26540.395618
390.1111231.14950.126464
40-0.01746-0.18060.428511
410.0022920.02370.490565
42-0.083204-0.86070.195671
43-0.009075-0.09390.462694
44-0.061444-0.63560.263202
450.2126732.19990.014982
46-0.249434-2.58020.005615
47-0.016468-0.17030.43253
480.3649963.77550.000131
49-0.248087-2.56620.005832
50-0.001944-0.02010.491996
510.1070781.10760.135254
52-0.03358-0.34740.364504
530.0040540.04190.483314
54-0.075434-0.78030.21847
550.0291960.3020.381618
56-0.083639-0.86520.19444
570.1758481.8190.035855
58-0.188847-1.95340.026689
59-0.014794-0.1530.43933
600.2809562.90620.002223

\begin{tabular}{lllllllll}
\hline
Autocorrelation Function \tabularnewline
Time lag k & ACF(k) & T-STAT & P-value \tabularnewline
1 & -0.38501 & -3.9826 & 6.2e-05 \tabularnewline
2 & -0.212872 & -2.202 & 0.014907 \tabularnewline
3 & 0.212128 & 2.1943 & 0.015189 \tabularnewline
4 & 0.000674 & 0.007 & 0.497225 \tabularnewline
5 & 0.031008 & 0.3207 & 0.374514 \tabularnewline
6 & -0.246642 & -2.5513 & 0.006073 \tabularnewline
7 & 0.052549 & 0.5436 & 0.293935 \tabularnewline
8 & -0.041054 & -0.4247 & 0.335967 \tabularnewline
9 & 0.231 & 2.3895 & 0.009311 \tabularnewline
10 & -0.246997 & -2.555 & 0.006013 \tabularnewline
11 & -0.263431 & -2.7249 & 0.003757 \tabularnewline
12 & 0.754434 & 7.8039 & 0 \tabularnewline
13 & -0.309997 & -3.2066 & 0.000886 \tabularnewline
14 & -0.129642 & -1.341 & 0.091375 \tabularnewline
15 & 0.141646 & 1.4652 & 0.0729 \tabularnewline
16 & 0.030771 & 0.3183 & 0.375439 \tabularnewline
17 & -0.003644 & -0.0377 & 0.485001 \tabularnewline
18 & -0.17617 & -1.8223 & 0.0356 \tabularnewline
19 & 0.014091 & 0.1458 & 0.442195 \tabularnewline
20 & -0.064027 & -0.6623 & 0.254601 \tabularnewline
21 & 0.255741 & 2.6454 & 0.004694 \tabularnewline
22 & -0.257032 & -2.6588 & 0.004523 \tabularnewline
23 & -0.159889 & -1.6539 & 0.050539 \tabularnewline
24 & 0.567276 & 5.868 & 0 \tabularnewline
25 & -0.260251 & -2.6921 & 0.004122 \tabularnewline
26 & -0.062035 & -0.6417 & 0.261221 \tabularnewline
27 & 0.093906 & 0.9714 & 0.166777 \tabularnewline
28 & 0.023828 & 0.2465 & 0.402891 \tabularnewline
29 & 0.002864 & 0.0296 & 0.488211 \tabularnewline
30 & -0.124559 & -1.2884 & 0.100185 \tabularnewline
31 & -0.020826 & -0.2154 & 0.414922 \tabularnewline
32 & -0.034743 & -0.3594 & 0.360007 \tabularnewline
33 & 0.236314 & 2.4445 & 0.00807 \tabularnewline
34 & -0.284747 & -2.9455 & 0.001979 \tabularnewline
35 & -0.054807 & -0.5669 & 0.285976 \tabularnewline
36 & 0.455651 & 4.7133 & 4e-06 \tabularnewline
37 & -0.266624 & -2.758 & 0.003421 \tabularnewline
38 & -0.025654 & -0.2654 & 0.395618 \tabularnewline
39 & 0.111123 & 1.1495 & 0.126464 \tabularnewline
40 & -0.01746 & -0.1806 & 0.428511 \tabularnewline
41 & 0.002292 & 0.0237 & 0.490565 \tabularnewline
42 & -0.083204 & -0.8607 & 0.195671 \tabularnewline
43 & -0.009075 & -0.0939 & 0.462694 \tabularnewline
44 & -0.061444 & -0.6356 & 0.263202 \tabularnewline
45 & 0.212673 & 2.1999 & 0.014982 \tabularnewline
46 & -0.249434 & -2.5802 & 0.005615 \tabularnewline
47 & -0.016468 & -0.1703 & 0.43253 \tabularnewline
48 & 0.364996 & 3.7755 & 0.000131 \tabularnewline
49 & -0.248087 & -2.5662 & 0.005832 \tabularnewline
50 & -0.001944 & -0.0201 & 0.491996 \tabularnewline
51 & 0.107078 & 1.1076 & 0.135254 \tabularnewline
52 & -0.03358 & -0.3474 & 0.364504 \tabularnewline
53 & 0.004054 & 0.0419 & 0.483314 \tabularnewline
54 & -0.075434 & -0.7803 & 0.21847 \tabularnewline
55 & 0.029196 & 0.302 & 0.381618 \tabularnewline
56 & -0.083639 & -0.8652 & 0.19444 \tabularnewline
57 & 0.175848 & 1.819 & 0.035855 \tabularnewline
58 & -0.188847 & -1.9534 & 0.026689 \tabularnewline
59 & -0.014794 & -0.153 & 0.43933 \tabularnewline
60 & 0.280956 & 2.9062 & 0.002223 \tabularnewline
\hline
\end{tabular}
%Source: https://freestatistics.org/blog/index.php?pk=295922&T=1

[TABLE]
[ROW][C]Autocorrelation Function[/C][/ROW]
[ROW][C]Time lag k[/C][C]ACF(k)[/C][C]T-STAT[/C][C]P-value[/C][/ROW]
[ROW][C]1[/C][C]-0.38501[/C][C]-3.9826[/C][C]6.2e-05[/C][/ROW]
[ROW][C]2[/C][C]-0.212872[/C][C]-2.202[/C][C]0.014907[/C][/ROW]
[ROW][C]3[/C][C]0.212128[/C][C]2.1943[/C][C]0.015189[/C][/ROW]
[ROW][C]4[/C][C]0.000674[/C][C]0.007[/C][C]0.497225[/C][/ROW]
[ROW][C]5[/C][C]0.031008[/C][C]0.3207[/C][C]0.374514[/C][/ROW]
[ROW][C]6[/C][C]-0.246642[/C][C]-2.5513[/C][C]0.006073[/C][/ROW]
[ROW][C]7[/C][C]0.052549[/C][C]0.5436[/C][C]0.293935[/C][/ROW]
[ROW][C]8[/C][C]-0.041054[/C][C]-0.4247[/C][C]0.335967[/C][/ROW]
[ROW][C]9[/C][C]0.231[/C][C]2.3895[/C][C]0.009311[/C][/ROW]
[ROW][C]10[/C][C]-0.246997[/C][C]-2.555[/C][C]0.006013[/C][/ROW]
[ROW][C]11[/C][C]-0.263431[/C][C]-2.7249[/C][C]0.003757[/C][/ROW]
[ROW][C]12[/C][C]0.754434[/C][C]7.8039[/C][C]0[/C][/ROW]
[ROW][C]13[/C][C]-0.309997[/C][C]-3.2066[/C][C]0.000886[/C][/ROW]
[ROW][C]14[/C][C]-0.129642[/C][C]-1.341[/C][C]0.091375[/C][/ROW]
[ROW][C]15[/C][C]0.141646[/C][C]1.4652[/C][C]0.0729[/C][/ROW]
[ROW][C]16[/C][C]0.030771[/C][C]0.3183[/C][C]0.375439[/C][/ROW]
[ROW][C]17[/C][C]-0.003644[/C][C]-0.0377[/C][C]0.485001[/C][/ROW]
[ROW][C]18[/C][C]-0.17617[/C][C]-1.8223[/C][C]0.0356[/C][/ROW]
[ROW][C]19[/C][C]0.014091[/C][C]0.1458[/C][C]0.442195[/C][/ROW]
[ROW][C]20[/C][C]-0.064027[/C][C]-0.6623[/C][C]0.254601[/C][/ROW]
[ROW][C]21[/C][C]0.255741[/C][C]2.6454[/C][C]0.004694[/C][/ROW]
[ROW][C]22[/C][C]-0.257032[/C][C]-2.6588[/C][C]0.004523[/C][/ROW]
[ROW][C]23[/C][C]-0.159889[/C][C]-1.6539[/C][C]0.050539[/C][/ROW]
[ROW][C]24[/C][C]0.567276[/C][C]5.868[/C][C]0[/C][/ROW]
[ROW][C]25[/C][C]-0.260251[/C][C]-2.6921[/C][C]0.004122[/C][/ROW]
[ROW][C]26[/C][C]-0.062035[/C][C]-0.6417[/C][C]0.261221[/C][/ROW]
[ROW][C]27[/C][C]0.093906[/C][C]0.9714[/C][C]0.166777[/C][/ROW]
[ROW][C]28[/C][C]0.023828[/C][C]0.2465[/C][C]0.402891[/C][/ROW]
[ROW][C]29[/C][C]0.002864[/C][C]0.0296[/C][C]0.488211[/C][/ROW]
[ROW][C]30[/C][C]-0.124559[/C][C]-1.2884[/C][C]0.100185[/C][/ROW]
[ROW][C]31[/C][C]-0.020826[/C][C]-0.2154[/C][C]0.414922[/C][/ROW]
[ROW][C]32[/C][C]-0.034743[/C][C]-0.3594[/C][C]0.360007[/C][/ROW]
[ROW][C]33[/C][C]0.236314[/C][C]2.4445[/C][C]0.00807[/C][/ROW]
[ROW][C]34[/C][C]-0.284747[/C][C]-2.9455[/C][C]0.001979[/C][/ROW]
[ROW][C]35[/C][C]-0.054807[/C][C]-0.5669[/C][C]0.285976[/C][/ROW]
[ROW][C]36[/C][C]0.455651[/C][C]4.7133[/C][C]4e-06[/C][/ROW]
[ROW][C]37[/C][C]-0.266624[/C][C]-2.758[/C][C]0.003421[/C][/ROW]
[ROW][C]38[/C][C]-0.025654[/C][C]-0.2654[/C][C]0.395618[/C][/ROW]
[ROW][C]39[/C][C]0.111123[/C][C]1.1495[/C][C]0.126464[/C][/ROW]
[ROW][C]40[/C][C]-0.01746[/C][C]-0.1806[/C][C]0.428511[/C][/ROW]
[ROW][C]41[/C][C]0.002292[/C][C]0.0237[/C][C]0.490565[/C][/ROW]
[ROW][C]42[/C][C]-0.083204[/C][C]-0.8607[/C][C]0.195671[/C][/ROW]
[ROW][C]43[/C][C]-0.009075[/C][C]-0.0939[/C][C]0.462694[/C][/ROW]
[ROW][C]44[/C][C]-0.061444[/C][C]-0.6356[/C][C]0.263202[/C][/ROW]
[ROW][C]45[/C][C]0.212673[/C][C]2.1999[/C][C]0.014982[/C][/ROW]
[ROW][C]46[/C][C]-0.249434[/C][C]-2.5802[/C][C]0.005615[/C][/ROW]
[ROW][C]47[/C][C]-0.016468[/C][C]-0.1703[/C][C]0.43253[/C][/ROW]
[ROW][C]48[/C][C]0.364996[/C][C]3.7755[/C][C]0.000131[/C][/ROW]
[ROW][C]49[/C][C]-0.248087[/C][C]-2.5662[/C][C]0.005832[/C][/ROW]
[ROW][C]50[/C][C]-0.001944[/C][C]-0.0201[/C][C]0.491996[/C][/ROW]
[ROW][C]51[/C][C]0.107078[/C][C]1.1076[/C][C]0.135254[/C][/ROW]
[ROW][C]52[/C][C]-0.03358[/C][C]-0.3474[/C][C]0.364504[/C][/ROW]
[ROW][C]53[/C][C]0.004054[/C][C]0.0419[/C][C]0.483314[/C][/ROW]
[ROW][C]54[/C][C]-0.075434[/C][C]-0.7803[/C][C]0.21847[/C][/ROW]
[ROW][C]55[/C][C]0.029196[/C][C]0.302[/C][C]0.381618[/C][/ROW]
[ROW][C]56[/C][C]-0.083639[/C][C]-0.8652[/C][C]0.19444[/C][/ROW]
[ROW][C]57[/C][C]0.175848[/C][C]1.819[/C][C]0.035855[/C][/ROW]
[ROW][C]58[/C][C]-0.188847[/C][C]-1.9534[/C][C]0.026689[/C][/ROW]
[ROW][C]59[/C][C]-0.014794[/C][C]-0.153[/C][C]0.43933[/C][/ROW]
[ROW][C]60[/C][C]0.280956[/C][C]2.9062[/C][C]0.002223[/C][/ROW]
[/TABLE]
Source: https://freestatistics.org/blog/index.php?pk=295922&T=1

Globally Unique Identifier (entire table): ba.freestatistics.org/blog/index.php?pk=295922&T=1

As an alternative you can also use a QR Code:  

The GUIDs for individual cells are displayed in the table below:

Autocorrelation Function
Time lag kACF(k)T-STATP-value
1-0.38501-3.98266.2e-05
2-0.212872-2.2020.014907
30.2121282.19430.015189
40.0006740.0070.497225
50.0310080.32070.374514
6-0.246642-2.55130.006073
70.0525490.54360.293935
8-0.041054-0.42470.335967
90.2312.38950.009311
10-0.246997-2.5550.006013
11-0.263431-2.72490.003757
120.7544347.80390
13-0.309997-3.20660.000886
14-0.129642-1.3410.091375
150.1416461.46520.0729
160.0307710.31830.375439
17-0.003644-0.03770.485001
18-0.17617-1.82230.0356
190.0140910.14580.442195
20-0.064027-0.66230.254601
210.2557412.64540.004694
22-0.257032-2.65880.004523
23-0.159889-1.65390.050539
240.5672765.8680
25-0.260251-2.69210.004122
26-0.062035-0.64170.261221
270.0939060.97140.166777
280.0238280.24650.402891
290.0028640.02960.488211
30-0.124559-1.28840.100185
31-0.020826-0.21540.414922
32-0.034743-0.35940.360007
330.2363142.44450.00807
34-0.284747-2.94550.001979
35-0.054807-0.56690.285976
360.4556514.71334e-06
37-0.266624-2.7580.003421
38-0.025654-0.26540.395618
390.1111231.14950.126464
40-0.01746-0.18060.428511
410.0022920.02370.490565
42-0.083204-0.86070.195671
43-0.009075-0.09390.462694
44-0.061444-0.63560.263202
450.2126732.19990.014982
46-0.249434-2.58020.005615
47-0.016468-0.17030.43253
480.3649963.77550.000131
49-0.248087-2.56620.005832
50-0.001944-0.02010.491996
510.1070781.10760.135254
52-0.03358-0.34740.364504
530.0040540.04190.483314
54-0.075434-0.78030.21847
550.0291960.3020.381618
56-0.083639-0.86520.19444
570.1758481.8190.035855
58-0.188847-1.95340.026689
59-0.014794-0.1530.43933
600.2809562.90620.002223


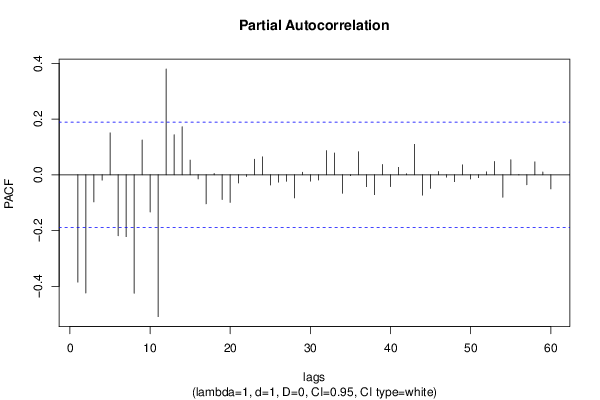
Partial Autocorrelation Function
Time lag kPACF(k)T-STATP-value
1-0.38501-3.98266.2e-05
2-0.423948-4.38531.4e-05
3-0.09704-1.00380.158872
4-0.019125-0.19780.421778
50.1505231.5570.061209
6-0.218594-2.26120.012886
7-0.221857-2.29490.011845
8-0.424908-4.39531.3e-05
90.124641.28930.10004
10-0.133181-1.37760.085595
11-0.508864-5.26370
120.3798123.92887.6e-05
130.1440721.49030.069544
140.1722781.78210.038788
150.0527580.54570.293191
16-0.014605-0.15110.440099
17-0.104172-1.07760.141826
180.0048060.04970.480222
19-0.088342-0.91380.181434
20-0.099045-1.02450.153949
21-0.029624-0.30640.379934
22-0.006347-0.06570.473886
230.0558110.57730.28247
240.0643730.66590.253461
25-0.036337-0.37590.353877
26-0.026307-0.27210.393025
27-0.023296-0.2410.405016
28-0.082912-0.85760.196502
290.0094110.09740.461314
30-0.022809-0.23590.406965
31-0.018885-0.19530.422745
320.0868360.89820.185537
330.0784620.81160.209406
34-0.066206-0.68480.247462
35-0.002918-0.03020.487987
360.082720.85570.197048
37-0.042435-0.4390.33079
38-0.071138-0.73590.231713
390.0372440.38530.350408
40-0.042278-0.43730.331379
410.0266330.27550.391733
420.0036410.03770.485013
430.1092681.13030.130443
44-0.072907-0.75420.226205
45-0.048616-0.50290.308037
460.0121530.12570.450098
47-0.00824-0.08520.466115
48-0.024443-0.25280.400437
490.0357430.36970.356159
50-0.014965-0.15480.438636
51-0.010103-0.10450.458483
520.0106830.11050.456108
530.0476180.49260.311663
54-0.08074-0.83520.202739
550.0542190.56080.288039
56-0.000655-0.00680.497303
57-0.03572-0.36950.356244
580.0464070.480.316092
590.0098310.10170.459596
60-0.050523-0.52260.301161

\begin{tabular}{lllllllll}
\hline
Partial Autocorrelation Function \tabularnewline
Time lag k & PACF(k) & T-STAT & P-value \tabularnewline
1 & -0.38501 & -3.9826 & 6.2e-05 \tabularnewline
2 & -0.423948 & -4.3853 & 1.4e-05 \tabularnewline
3 & -0.09704 & -1.0038 & 0.158872 \tabularnewline
4 & -0.019125 & -0.1978 & 0.421778 \tabularnewline
5 & 0.150523 & 1.557 & 0.061209 \tabularnewline
6 & -0.218594 & -2.2612 & 0.012886 \tabularnewline
7 & -0.221857 & -2.2949 & 0.011845 \tabularnewline
8 & -0.424908 & -4.3953 & 1.3e-05 \tabularnewline
9 & 0.12464 & 1.2893 & 0.10004 \tabularnewline
10 & -0.133181 & -1.3776 & 0.085595 \tabularnewline
11 & -0.508864 & -5.2637 & 0 \tabularnewline
12 & 0.379812 & 3.9288 & 7.6e-05 \tabularnewline
13 & 0.144072 & 1.4903 & 0.069544 \tabularnewline
14 & 0.172278 & 1.7821 & 0.038788 \tabularnewline
15 & 0.052758 & 0.5457 & 0.293191 \tabularnewline
16 & -0.014605 & -0.1511 & 0.440099 \tabularnewline
17 & -0.104172 & -1.0776 & 0.141826 \tabularnewline
18 & 0.004806 & 0.0497 & 0.480222 \tabularnewline
19 & -0.088342 & -0.9138 & 0.181434 \tabularnewline
20 & -0.099045 & -1.0245 & 0.153949 \tabularnewline
21 & -0.029624 & -0.3064 & 0.379934 \tabularnewline
22 & -0.006347 & -0.0657 & 0.473886 \tabularnewline
23 & 0.055811 & 0.5773 & 0.28247 \tabularnewline
24 & 0.064373 & 0.6659 & 0.253461 \tabularnewline
25 & -0.036337 & -0.3759 & 0.353877 \tabularnewline
26 & -0.026307 & -0.2721 & 0.393025 \tabularnewline
27 & -0.023296 & -0.241 & 0.405016 \tabularnewline
28 & -0.082912 & -0.8576 & 0.196502 \tabularnewline
29 & 0.009411 & 0.0974 & 0.461314 \tabularnewline
30 & -0.022809 & -0.2359 & 0.406965 \tabularnewline
31 & -0.018885 & -0.1953 & 0.422745 \tabularnewline
32 & 0.086836 & 0.8982 & 0.185537 \tabularnewline
33 & 0.078462 & 0.8116 & 0.209406 \tabularnewline
34 & -0.066206 & -0.6848 & 0.247462 \tabularnewline
35 & -0.002918 & -0.0302 & 0.487987 \tabularnewline
36 & 0.08272 & 0.8557 & 0.197048 \tabularnewline
37 & -0.042435 & -0.439 & 0.33079 \tabularnewline
38 & -0.071138 & -0.7359 & 0.231713 \tabularnewline
39 & 0.037244 & 0.3853 & 0.350408 \tabularnewline
40 & -0.042278 & -0.4373 & 0.331379 \tabularnewline
41 & 0.026633 & 0.2755 & 0.391733 \tabularnewline
42 & 0.003641 & 0.0377 & 0.485013 \tabularnewline
43 & 0.109268 & 1.1303 & 0.130443 \tabularnewline
44 & -0.072907 & -0.7542 & 0.226205 \tabularnewline
45 & -0.048616 & -0.5029 & 0.308037 \tabularnewline
46 & 0.012153 & 0.1257 & 0.450098 \tabularnewline
47 & -0.00824 & -0.0852 & 0.466115 \tabularnewline
48 & -0.024443 & -0.2528 & 0.400437 \tabularnewline
49 & 0.035743 & 0.3697 & 0.356159 \tabularnewline
50 & -0.014965 & -0.1548 & 0.438636 \tabularnewline
51 & -0.010103 & -0.1045 & 0.458483 \tabularnewline
52 & 0.010683 & 0.1105 & 0.456108 \tabularnewline
53 & 0.047618 & 0.4926 & 0.311663 \tabularnewline
54 & -0.08074 & -0.8352 & 0.202739 \tabularnewline
55 & 0.054219 & 0.5608 & 0.288039 \tabularnewline
56 & -0.000655 & -0.0068 & 0.497303 \tabularnewline
57 & -0.03572 & -0.3695 & 0.356244 \tabularnewline
58 & 0.046407 & 0.48 & 0.316092 \tabularnewline
59 & 0.009831 & 0.1017 & 0.459596 \tabularnewline
60 & -0.050523 & -0.5226 & 0.301161 \tabularnewline
\hline
\end{tabular}
%Source: https://freestatistics.org/blog/index.php?pk=295922&T=2

[TABLE]
[ROW][C]Partial Autocorrelation Function[/C][/ROW]
[ROW][C]Time lag k[/C][C]PACF(k)[/C][C]T-STAT[/C][C]P-value[/C][/ROW]
[ROW][C]1[/C][C]-0.38501[/C][C]-3.9826[/C][C]6.2e-05[/C][/ROW]
[ROW][C]2[/C][C]-0.423948[/C][C]-4.3853[/C][C]1.4e-05[/C][/ROW]
[ROW][C]3[/C][C]-0.09704[/C][C]-1.0038[/C][C]0.158872[/C][/ROW]
[ROW][C]4[/C][C]-0.019125[/C][C]-0.1978[/C][C]0.421778[/C][/ROW]
[ROW][C]5[/C][C]0.150523[/C][C]1.557[/C][C]0.061209[/C][/ROW]
[ROW][C]6[/C][C]-0.218594[/C][C]-2.2612[/C][C]0.012886[/C][/ROW]
[ROW][C]7[/C][C]-0.221857[/C][C]-2.2949[/C][C]0.011845[/C][/ROW]
[ROW][C]8[/C][C]-0.424908[/C][C]-4.3953[/C][C]1.3e-05[/C][/ROW]
[ROW][C]9[/C][C]0.12464[/C][C]1.2893[/C][C]0.10004[/C][/ROW]
[ROW][C]10[/C][C]-0.133181[/C][C]-1.3776[/C][C]0.085595[/C][/ROW]
[ROW][C]11[/C][C]-0.508864[/C][C]-5.2637[/C][C]0[/C][/ROW]
[ROW][C]12[/C][C]0.379812[/C][C]3.9288[/C][C]7.6e-05[/C][/ROW]
[ROW][C]13[/C][C]0.144072[/C][C]1.4903[/C][C]0.069544[/C][/ROW]
[ROW][C]14[/C][C]0.172278[/C][C]1.7821[/C][C]0.038788[/C][/ROW]
[ROW][C]15[/C][C]0.052758[/C][C]0.5457[/C][C]0.293191[/C][/ROW]
[ROW][C]16[/C][C]-0.014605[/C][C]-0.1511[/C][C]0.440099[/C][/ROW]
[ROW][C]17[/C][C]-0.104172[/C][C]-1.0776[/C][C]0.141826[/C][/ROW]
[ROW][C]18[/C][C]0.004806[/C][C]0.0497[/C][C]0.480222[/C][/ROW]
[ROW][C]19[/C][C]-0.088342[/C][C]-0.9138[/C][C]0.181434[/C][/ROW]
[ROW][C]20[/C][C]-0.099045[/C][C]-1.0245[/C][C]0.153949[/C][/ROW]
[ROW][C]21[/C][C]-0.029624[/C][C]-0.3064[/C][C]0.379934[/C][/ROW]
[ROW][C]22[/C][C]-0.006347[/C][C]-0.0657[/C][C]0.473886[/C][/ROW]
[ROW][C]23[/C][C]0.055811[/C][C]0.5773[/C][C]0.28247[/C][/ROW]
[ROW][C]24[/C][C]0.064373[/C][C]0.6659[/C][C]0.253461[/C][/ROW]
[ROW][C]25[/C][C]-0.036337[/C][C]-0.3759[/C][C]0.353877[/C][/ROW]
[ROW][C]26[/C][C]-0.026307[/C][C]-0.2721[/C][C]0.393025[/C][/ROW]
[ROW][C]27[/C][C]-0.023296[/C][C]-0.241[/C][C]0.405016[/C][/ROW]
[ROW][C]28[/C][C]-0.082912[/C][C]-0.8576[/C][C]0.196502[/C][/ROW]
[ROW][C]29[/C][C]0.009411[/C][C]0.0974[/C][C]0.461314[/C][/ROW]
[ROW][C]30[/C][C]-0.022809[/C][C]-0.2359[/C][C]0.406965[/C][/ROW]
[ROW][C]31[/C][C]-0.018885[/C][C]-0.1953[/C][C]0.422745[/C][/ROW]
[ROW][C]32[/C][C]0.086836[/C][C]0.8982[/C][C]0.185537[/C][/ROW]
[ROW][C]33[/C][C]0.078462[/C][C]0.8116[/C][C]0.209406[/C][/ROW]
[ROW][C]34[/C][C]-0.066206[/C][C]-0.6848[/C][C]0.247462[/C][/ROW]
[ROW][C]35[/C][C]-0.002918[/C][C]-0.0302[/C][C]0.487987[/C][/ROW]
[ROW][C]36[/C][C]0.08272[/C][C]0.8557[/C][C]0.197048[/C][/ROW]
[ROW][C]37[/C][C]-0.042435[/C][C]-0.439[/C][C]0.33079[/C][/ROW]
[ROW][C]38[/C][C]-0.071138[/C][C]-0.7359[/C][C]0.231713[/C][/ROW]
[ROW][C]39[/C][C]0.037244[/C][C]0.3853[/C][C]0.350408[/C][/ROW]
[ROW][C]40[/C][C]-0.042278[/C][C]-0.4373[/C][C]0.331379[/C][/ROW]
[ROW][C]41[/C][C]0.026633[/C][C]0.2755[/C][C]0.391733[/C][/ROW]
[ROW][C]42[/C][C]0.003641[/C][C]0.0377[/C][C]0.485013[/C][/ROW]
[ROW][C]43[/C][C]0.109268[/C][C]1.1303[/C][C]0.130443[/C][/ROW]
[ROW][C]44[/C][C]-0.072907[/C][C]-0.7542[/C][C]0.226205[/C][/ROW]
[ROW][C]45[/C][C]-0.048616[/C][C]-0.5029[/C][C]0.308037[/C][/ROW]
[ROW][C]46[/C][C]0.012153[/C][C]0.1257[/C][C]0.450098[/C][/ROW]
[ROW][C]47[/C][C]-0.00824[/C][C]-0.0852[/C][C]0.466115[/C][/ROW]
[ROW][C]48[/C][C]-0.024443[/C][C]-0.2528[/C][C]0.400437[/C][/ROW]
[ROW][C]49[/C][C]0.035743[/C][C]0.3697[/C][C]0.356159[/C][/ROW]
[ROW][C]50[/C][C]-0.014965[/C][C]-0.1548[/C][C]0.438636[/C][/ROW]
[ROW][C]51[/C][C]-0.010103[/C][C]-0.1045[/C][C]0.458483[/C][/ROW]
[ROW][C]52[/C][C]0.010683[/C][C]0.1105[/C][C]0.456108[/C][/ROW]
[ROW][C]53[/C][C]0.047618[/C][C]0.4926[/C][C]0.311663[/C][/ROW]
[ROW][C]54[/C][C]-0.08074[/C][C]-0.8352[/C][C]0.202739[/C][/ROW]
[ROW][C]55[/C][C]0.054219[/C][C]0.5608[/C][C]0.288039[/C][/ROW]
[ROW][C]56[/C][C]-0.000655[/C][C]-0.0068[/C][C]0.497303[/C][/ROW]
[ROW][C]57[/C][C]-0.03572[/C][C]-0.3695[/C][C]0.356244[/C][/ROW]
[ROW][C]58[/C][C]0.046407[/C][C]0.48[/C][C]0.316092[/C][/ROW]
[ROW][C]59[/C][C]0.009831[/C][C]0.1017[/C][C]0.459596[/C][/ROW]
[ROW][C]60[/C][C]-0.050523[/C][C]-0.5226[/C][C]0.301161[/C][/ROW]
[/TABLE]
Source: https://freestatistics.org/blog/index.php?pk=295922&T=2

Globally Unique Identifier (entire table): ba.freestatistics.org/blog/index.php?pk=295922&T=2

As an alternative you can also use a QR Code:  

The GUIDs for individual cells are displayed in the table below:

Partial Autocorrelation Function
Time lag kPACF(k)T-STATP-value
1-0.38501-3.98266.2e-05
2-0.423948-4.38531.4e-05
3-0.09704-1.00380.158872
4-0.019125-0.19780.421778
50.1505231.5570.061209
6-0.218594-2.26120.012886
7-0.221857-2.29490.011845
8-0.424908-4.39531.3e-05
90.124641.28930.10004
10-0.133181-1.37760.085595
11-0.508864-5.26370
120.3798123.92887.6e-05
130.1440721.49030.069544
140.1722781.78210.038788
150.0527580.54570.293191
16-0.014605-0.15110.440099
17-0.104172-1.07760.141826
180.0048060.04970.480222
19-0.088342-0.91380.181434
20-0.099045-1.02450.153949
21-0.029624-0.30640.379934
22-0.006347-0.06570.473886
230.0558110.57730.28247
240.0643730.66590.253461
25-0.036337-0.37590.353877
26-0.026307-0.27210.393025
27-0.023296-0.2410.405016
28-0.082912-0.85760.196502
290.0094110.09740.461314
30-0.022809-0.23590.406965
31-0.018885-0.19530.422745
320.0868360.89820.185537
330.0784620.81160.209406
34-0.066206-0.68480.247462
35-0.002918-0.03020.487987
360.082720.85570.197048
37-0.042435-0.4390.33079
38-0.071138-0.73590.231713
390.0372440.38530.350408
40-0.042278-0.43730.331379
410.0266330.27550.391733
420.0036410.03770.485013
430.1092681.13030.130443
44-0.072907-0.75420.226205
45-0.048616-0.50290.308037
460.0121530.12570.450098
47-0.00824-0.08520.466115
48-0.024443-0.25280.400437
490.0357430.36970.356159
50-0.014965-0.15480.438636
51-0.010103-0.10450.458483
520.0106830.11050.456108
530.0476180.49260.311663
54-0.08074-0.83520.202739
550.0542190.56080.288039
56-0.000655-0.00680.497303
57-0.03572-0.36950.356244
580.0464070.480.316092
590.0098310.10170.459596
60-0.050523-0.52260.301161


Parameters (Session):
par1 = 60 ; par2 = 1 ; par3 = 1 ; par4 = 0 ; par5 = 12 ; par6 = White Noise ; par7 = 0.95 ;
Parameters (R input):
par1 = 60 ; par2 = 1 ; par3 = 1 ; par4 = 0 ; par5 = 12 ; par6 = White Noise ; par7 = 0.95 ; par8 = ;
R code (references can be found in the software module):
par8 <- ''
par7 <- '0.95'
par6 <- 'White Noise'
par5 <- '12'
par4 <- '0'
par3 <- '0'
par2 <- '1'
par1 <- '48'
if (par1 == 'Default') {
par1 = 10*log10(length(x))
} else {
par1 <- as.numeric(par1)
}
par2 <- as.numeric(par2)
par3 <- as.numeric(par3)
par4 <- as.numeric(par4)
par5 <- as.numeric(par5)
if (par6 == 'White Noise') par6 <- 'white' else par6 <- 'ma'
par7 <- as.numeric(par7)
if (par8 != '') par8 <- as.numeric(par8)
x <- na.omit(x)
ox <- x
if (par8 == '') {
if (par2 == 0) {
x <- log(x)
} else {
x <- (x ^ par2 - 1) / par2
}
} else {
x <- log(x,base=par8)
}
if (par3 > 0) x <- diff(x,lag=1,difference=par3)
if (par4 > 0) x <- diff(x,lag=par5,difference=par4)
bitmap(file='picts.png')
op <- par(mfrow=c(2,1))
plot(ox,type='l',main='Original Time Series',xlab='time',ylab='value')
if (par8=='') {
mytitle <- paste('Working Time Series (lambda=',par2,', d=',par3,', D=',par4,')',sep='')
mysub <- paste('(lambda=',par2,', d=',par3,', D=',par4,', CI=', par7, ', CI type=',par6,')',sep='')
} else {
mytitle <- paste('Working Time Series (base=',par8,', d=',par3,', D=',par4,')',sep='')
mysub <- paste('(base=',par8,', d=',par3,', D=',par4,', CI=', par7, ', CI type=',par6,')',sep='')
}
plot(x,type='l', main=mytitle,xlab='time',ylab='value')
par(op)
dev.off()
bitmap(file='pic1.png')
racf <- acf(x, par1, main='Autocorrelation', xlab='time lag', ylab='ACF', ci.type=par6, ci=par7, sub=mysub)
dev.off()
bitmap(file='pic2.png')
rpacf <- pacf(x,par1,main='Partial Autocorrelation',xlab='lags',ylab='PACF',sub=mysub)
dev.off()
(myacf <- c(racf$acf))
(mypacf <- c(rpacf$acf))
lengthx <- length(x)
sqrtn <- sqrt(lengthx)
load(file='createtable')
a<-table.start()
a<-table.row.start(a)
a<-table.element(a,'Autocorrelation Function',4,TRUE)
a<-table.row.end(a)
a<-table.row.start(a)
a<-table.element(a,'Time lag k',header=TRUE)
a<-table.element(a,hyperlink('basics.htm','ACF(k)','click here for more information about the Autocorrelation Function'),header=TRUE)
a<-table.element(a,'T-STAT',header=TRUE)
a<-table.element(a,'P-value',header=TRUE)
a<-table.row.end(a)
for (i in 2:(par1+1)) {
a<-table.row.start(a)
a<-table.element(a,i-1,header=TRUE)
a<-table.element(a,round(myacf[i],6))
mytstat <- myacf[i]*sqrtn
a<-table.element(a,round(mytstat,4))
a<-table.element(a,round(1-pt(abs(mytstat),lengthx),6))
a<-table.row.end(a)
}
a<-table.end(a)
table.save(a,file='mytable.tab')
a<-table.start()
a<-table.row.start(a)
a<-table.element(a,'Partial Autocorrelation Function',4,TRUE)
a<-table.row.end(a)
a<-table.row.start(a)
a<-table.element(a,'Time lag k',header=TRUE)
a<-table.element(a,hyperlink('basics.htm','PACF(k)','click here for more information about the Partial Autocorrelation Function'),header=TRUE)
a<-table.element(a,'T-STAT',header=TRUE)
a<-table.element(a,'P-value',header=TRUE)
a<-table.row.end(a)
for (i in 1:par1) {
a<-table.row.start(a)
a<-table.element(a,i,header=TRUE)
a<-table.element(a,round(mypacf[i],6))
mytstat <- mypacf[i]*sqrtn
a<-table.element(a,round(mytstat,4))
a<-table.element(a,round(1-pt(abs(mytstat),lengthx),6))
a<-table.row.end(a)
}
a<-table.end(a)
table.save(a,file='mytable1.tab')