Free Statistics

of Irreproducible Research!

Author's title

Author*Unverified author*
R Software Modulerwasp_smp.wasp
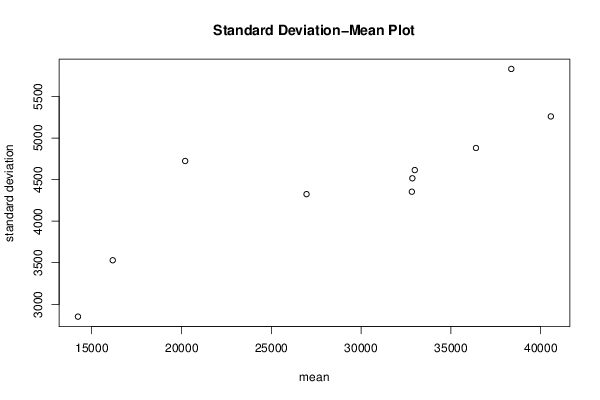
Title produced by softwareStandard Deviation-Mean Plot
Date of computationFri, 22 Jul 2016 10:40:22 +0100
Cite this page as followsStatistical Computations at FreeStatistics.org, Office for Research Development and Education, URL https://freestatistics.org/blog/index.php?v=date/2016/Jul/22/t1469180456ce1rkd40m6wo5uy.htm/, Retrieved Mon, 29 Apr 2024 07:41:10 +0000
Statistical Computations at FreeStatistics.org, Office for Research Development and Education, URL https://freestatistics.org/blog/index.php?pk=295926, Retrieved Mon, 29 Apr 2024 07:41:10 +0000
QR Codes:

Original text written by user:
IsPrivate?No (this computation is public)
User-defined keywords
Estimated Impact137
Family? (F = Feedback message, R = changed R code, M = changed R Module, P = changed Parameters, D = changed Data)
-       [Standard Deviation-Mean Plot] [Standard deviatio...] [2016-07-22 09:40:22] [b1d105767b629000b6b6bd83f6a3d689] [Current]
Feedback Forum

Post a new message
Dataseries X:
14724
14404
14058
13427
19946
19631
14724
11462
11778
11778
12093
12760
13742
13427
11462
11778
20929
22893
17666
14724
15387
15707
17351
18964
19315
16022
16369
12093
24222
27800
19631
17004
18649
20613
23555
27164
27164
24853
23871
17982
27800
32391
28462
24222
24853
27164
30426
34355
31724
30111
30111
24853
32391
37297
33373
29129
30426
35653
37964
41222
38595
34355
33373
25520
30742
36315
30111
26502
30111
33689
35653
40906
38280
31724
32391
26186
31409
36000
30742
27164
30426
34355
33689
41542
40244
35017
35333
28462
32706
39262
34355
31409
36315
39262
36982
47431
44835
38946
37297
29764
34035
37964
33053
33053
38595
41542
39924
51355
48413
42871
40560
32391
35333
40560
36631
35653
40244
44168
39924
50057


Summary of computational transaction
Raw Inputview raw input (R code)
Raw Outputview raw output of R engine
Computing time1 seconds
R Server'Sir Ronald Aylmer Fisher' @ fisher.wessa.net

\begin{tabular}{lllllllll}
\hline
Summary of computational transaction \tabularnewline
Raw Input & view raw input (R code)  \tabularnewline
Raw Output & view raw output of R engine  \tabularnewline
Computing time & 1 seconds \tabularnewline
R Server & 'Sir Ronald Aylmer Fisher' @ fisher.wessa.net \tabularnewline
\hline
\end{tabular}
%Source: https://freestatistics.org/blog/index.php?pk=295926&T=0

[TABLE]
[ROW][C]Summary of computational transaction[/C][/ROW]
[ROW][C]Raw Input[/C][C]view raw input (R code) [/C][/ROW]
[ROW][C]Raw Output[/C][C]view raw output of R engine [/C][/ROW]
[ROW][C]Computing time[/C][C]1 seconds[/C][/ROW]
[ROW][C]R Server[/C][C]'Sir Ronald Aylmer Fisher' @ fisher.wessa.net[/C][/ROW]
[/TABLE]
Source: https://freestatistics.org/blog/index.php?pk=295926&T=0

Globally Unique Identifier (entire table): ba.freestatistics.org/blog/index.php?pk=295926&T=0

As an alternative you can also use a QR Code:  

The GUIDs for individual cells are displayed in the table below:

Summary of computational transaction
Raw Inputview raw input (R code)
Raw Outputview raw output of R engine
Computing time1 seconds
R Server'Sir Ronald Aylmer Fisher' @ fisher.wessa.net


Standard Deviation-Mean Plot
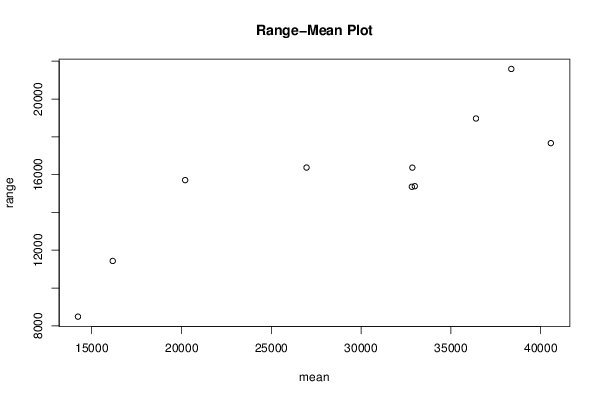
SectionMeanStandard DeviationRange
114232.08333333332851.638235959798484
216169.16666666673530.1113769020611431
320203.08333333334723.6634176593615707
426961.91666666674324.9979602377416373
532854.54515.6868902647716369
632989.33333333334614.7058870790915386
732825.66666666674354.0375689140715356
836398.16666666674880.2762372139518969
938363.58333333335830.7761912479821591
1040567.08333333335259.575967324817666

\begin{tabular}{lllllllll}
\hline
Standard Deviation-Mean Plot \tabularnewline
Section & Mean & Standard Deviation & Range \tabularnewline
1 & 14232.0833333333 & 2851.63823595979 & 8484 \tabularnewline
2 & 16169.1666666667 & 3530.11137690206 & 11431 \tabularnewline
3 & 20203.0833333333 & 4723.66341765936 & 15707 \tabularnewline
4 & 26961.9166666667 & 4324.99796023774 & 16373 \tabularnewline
5 & 32854.5 & 4515.68689026477 & 16369 \tabularnewline
6 & 32989.3333333333 & 4614.70588707909 & 15386 \tabularnewline
7 & 32825.6666666667 & 4354.03756891407 & 15356 \tabularnewline
8 & 36398.1666666667 & 4880.27623721395 & 18969 \tabularnewline
9 & 38363.5833333333 & 5830.77619124798 & 21591 \tabularnewline
10 & 40567.0833333333 & 5259.5759673248 & 17666 \tabularnewline
\hline
\end{tabular}
%Source: https://freestatistics.org/blog/index.php?pk=295926&T=1

[TABLE]
[ROW][C]Standard Deviation-Mean Plot[/C][/ROW]
[ROW][C]Section[/C][C]Mean[/C][C]Standard Deviation[/C][C]Range[/C][/ROW]
[ROW][C]1[/C][C]14232.0833333333[/C][C]2851.63823595979[/C][C]8484[/C][/ROW]
[ROW][C]2[/C][C]16169.1666666667[/C][C]3530.11137690206[/C][C]11431[/C][/ROW]
[ROW][C]3[/C][C]20203.0833333333[/C][C]4723.66341765936[/C][C]15707[/C][/ROW]
[ROW][C]4[/C][C]26961.9166666667[/C][C]4324.99796023774[/C][C]16373[/C][/ROW]
[ROW][C]5[/C][C]32854.5[/C][C]4515.68689026477[/C][C]16369[/C][/ROW]
[ROW][C]6[/C][C]32989.3333333333[/C][C]4614.70588707909[/C][C]15386[/C][/ROW]
[ROW][C]7[/C][C]32825.6666666667[/C][C]4354.03756891407[/C][C]15356[/C][/ROW]
[ROW][C]8[/C][C]36398.1666666667[/C][C]4880.27623721395[/C][C]18969[/C][/ROW]
[ROW][C]9[/C][C]38363.5833333333[/C][C]5830.77619124798[/C][C]21591[/C][/ROW]
[ROW][C]10[/C][C]40567.0833333333[/C][C]5259.5759673248[/C][C]17666[/C][/ROW]
[/TABLE]
Source: https://freestatistics.org/blog/index.php?pk=295926&T=1

Globally Unique Identifier (entire table): ba.freestatistics.org/blog/index.php?pk=295926&T=1

As an alternative you can also use a QR Code:  

The GUIDs for individual cells are displayed in the table below:

Standard Deviation-Mean Plot
SectionMeanStandard DeviationRange
114232.08333333332851.638235959798484
216169.16666666673530.1113769020611431
320203.08333333334723.6634176593615707
426961.91666666674324.9979602377416373
532854.54515.6868902647716369
632989.33333333334614.7058870790915386
732825.66666666674354.0375689140715356
836398.16666666674880.2762372139518969
938363.58333333335830.7761912479821591
1040567.08333333335259.575967324817666


Regression: S.E.(k) = alpha + beta * Mean(k)
alpha2290.97655623932
beta0.0753716515194388
S.D.0.0169291902138179
T-STAT4.45217110608866
p-value0.00213313507645316

\begin{tabular}{lllllllll}
\hline
Regression: S.E.(k) = alpha + beta * Mean(k) \tabularnewline
alpha & 2290.97655623932 \tabularnewline
beta & 0.0753716515194388 \tabularnewline
S.D. & 0.0169291902138179 \tabularnewline
T-STAT & 4.45217110608866 \tabularnewline
p-value & 0.00213313507645316 \tabularnewline
\hline
\end{tabular}
%Source: https://freestatistics.org/blog/index.php?pk=295926&T=2

[TABLE]
[ROW][C]Regression: S.E.(k) = alpha + beta * Mean(k)[/C][/ROW]
[ROW][C]alpha[/C][C]2290.97655623932[/C][/ROW]
[ROW][C]beta[/C][C]0.0753716515194388[/C][/ROW]
[ROW][C]S.D.[/C][C]0.0169291902138179[/C][/ROW]
[ROW][C]T-STAT[/C][C]4.45217110608866[/C][/ROW]
[ROW][C]p-value[/C][C]0.00213313507645316[/C][/ROW]
[/TABLE]
Source: https://freestatistics.org/blog/index.php?pk=295926&T=2

Globally Unique Identifier (entire table): ba.freestatistics.org/blog/index.php?pk=295926&T=2

As an alternative you can also use a QR Code:  

The GUIDs for individual cells are displayed in the table below:

Regression: S.E.(k) = alpha + beta * Mean(k)
alpha2290.97655623932
beta0.0753716515194388
S.D.0.0169291902138179
T-STAT4.45217110608866
p-value0.00213313507645316


Regression: ln S.E.(k) = alpha + beta * ln Mean(k)
alpha3.60251228253677
beta0.468453961525005
S.D.0.0964665506847866
T-STAT4.85612845281181
p-value0.00126199092221759
Lambda0.531546038474995

\begin{tabular}{lllllllll}
\hline
Regression: ln S.E.(k) = alpha + beta * ln Mean(k) \tabularnewline
alpha & 3.60251228253677 \tabularnewline
beta & 0.468453961525005 \tabularnewline
S.D. & 0.0964665506847866 \tabularnewline
T-STAT & 4.85612845281181 \tabularnewline
p-value & 0.00126199092221759 \tabularnewline
Lambda & 0.531546038474995 \tabularnewline
\hline
\end{tabular}
%Source: https://freestatistics.org/blog/index.php?pk=295926&T=3

[TABLE]
[ROW][C]Regression: ln S.E.(k) = alpha + beta * ln Mean(k)[/C][/ROW]
[ROW][C]alpha[/C][C]3.60251228253677[/C][/ROW]
[ROW][C]beta[/C][C]0.468453961525005[/C][/ROW]
[ROW][C]S.D.[/C][C]0.0964665506847866[/C][/ROW]
[ROW][C]T-STAT[/C][C]4.85612845281181[/C][/ROW]
[ROW][C]p-value[/C][C]0.00126199092221759[/C][/ROW]
[ROW][C]Lambda[/C][C]0.531546038474995[/C][/ROW]
[/TABLE]
Source: https://freestatistics.org/blog/index.php?pk=295926&T=3

Globally Unique Identifier (entire table): ba.freestatistics.org/blog/index.php?pk=295926&T=3

As an alternative you can also use a QR Code:  

The GUIDs for individual cells are displayed in the table below:

Regression: ln S.E.(k) = alpha + beta * ln Mean(k)
alpha3.60251228253677
beta0.468453961525005
S.D.0.0964665506847866
T-STAT4.85612845281181
p-value0.00126199092221759
Lambda0.531546038474995


Parameters (Session):
par1 = 12 ;
Parameters (R input):
par1 = 12 ;
R code (references can be found in the software module):
par1 <- as.numeric(par1)
(n <- length(x))
(np <- floor(n / par1))
arr <- array(NA,dim=c(par1,np))
j <- 0
k <- 1
for (i in 1:(np*par1))
{
j = j + 1
arr[j,k] <- x[i]
if (j == par1) {
j = 0
k=k+1
}
}
arr
arr.mean <- array(NA,dim=np)
arr.sd <- array(NA,dim=np)
arr.range <- array(NA,dim=np)
for (j in 1:np)
{
arr.mean[j] <- mean(arr[,j],na.rm=TRUE)
arr.sd[j] <- sd(arr[,j],na.rm=TRUE)
arr.range[j] <- max(arr[,j],na.rm=TRUE) - min(arr[,j],na.rm=TRUE)
}
arr.mean
arr.sd
arr.range
(lm1 <- lm(arr.sd~arr.mean))
(lnlm1 <- lm(log(arr.sd)~log(arr.mean)))
(lm2 <- lm(arr.range~arr.mean))
bitmap(file='test1.png')
plot(arr.mean,arr.sd,main='Standard Deviation-Mean Plot',xlab='mean',ylab='standard deviation')
dev.off()
bitmap(file='test2.png')
plot(arr.mean,arr.range,main='Range-Mean Plot',xlab='mean',ylab='range')
dev.off()
load(file='createtable')
a<-table.start()
a<-table.row.start(a)
a<-table.element(a,'Standard Deviation-Mean Plot',4,TRUE)
a<-table.row.end(a)
a<-table.row.start(a)
a<-table.element(a,'Section',header=TRUE)
a<-table.element(a,'Mean',header=TRUE)
a<-table.element(a,'Standard Deviation',header=TRUE)
a<-table.element(a,'Range',header=TRUE)
a<-table.row.end(a)
for (j in 1:np) {
a<-table.row.start(a)
a<-table.element(a,j,header=TRUE)
a<-table.element(a,arr.mean[j])
a<-table.element(a,arr.sd[j] )
a<-table.element(a,arr.range[j] )
a<-table.row.end(a)
}
a<-table.end(a)
table.save(a,file='mytable.tab')
a<-table.start()
a<-table.row.start(a)
a<-table.element(a,'Regression: S.E.(k) = alpha + beta * Mean(k)',2,TRUE)
a<-table.row.end(a)
a<-table.row.start(a)
a<-table.element(a,'alpha',header=TRUE)
a<-table.element(a,lm1$coefficients[[1]])
a<-table.row.end(a)
a<-table.row.start(a)
a<-table.element(a,'beta',header=TRUE)
a<-table.element(a,lm1$coefficients[[2]])
a<-table.row.end(a)
a<-table.row.start(a)
a<-table.element(a,'S.D.',header=TRUE)
a<-table.element(a,summary(lm1)$coefficients[2,2])
a<-table.row.end(a)
a<-table.row.start(a)
a<-table.element(a,'T-STAT',header=TRUE)
a<-table.element(a,summary(lm1)$coefficients[2,3])
a<-table.row.end(a)
a<-table.row.start(a)
a<-table.element(a,'p-value',header=TRUE)
a<-table.element(a,summary(lm1)$coefficients[2,4])
a<-table.row.end(a)
a<-table.end(a)
table.save(a,file='mytable1.tab')
a<-table.start()
a<-table.row.start(a)
a<-table.element(a,'Regression: ln S.E.(k) = alpha + beta * ln Mean(k)',2,TRUE)
a<-table.row.end(a)
a<-table.row.start(a)
a<-table.element(a,'alpha',header=TRUE)
a<-table.element(a,lnlm1$coefficients[[1]])
a<-table.row.end(a)
a<-table.row.start(a)
a<-table.element(a,'beta',header=TRUE)
a<-table.element(a,lnlm1$coefficients[[2]])
a<-table.row.end(a)
a<-table.row.start(a)
a<-table.element(a,'S.D.',header=TRUE)
a<-table.element(a,summary(lnlm1)$coefficients[2,2])
a<-table.row.end(a)
a<-table.row.start(a)
a<-table.element(a,'T-STAT',header=TRUE)
a<-table.element(a,summary(lnlm1)$coefficients[2,3])
a<-table.row.end(a)
a<-table.row.start(a)
a<-table.element(a,'p-value',header=TRUE)
a<-table.element(a,summary(lnlm1)$coefficients[2,4])
a<-table.row.end(a)
a<-table.row.start(a)
a<-table.element(a,'Lambda',header=TRUE)
a<-table.element(a,1-lnlm1$coefficients[[2]])
a<-table.row.end(a)
a<-table.end(a)
table.save(a,file='mytable2.tab')