Free Statistics

of Irreproducible Research!

Author's title

Author*Unverified author*
R Software Modulerwasp_multipleregression.wasp
Title produced by softwareMultiple Regression
Date of computationFri, 29 Jul 2016 21:09:04 +0100
Cite this page as followsStatistical Computations at FreeStatistics.org, Office for Research Development and Education, URL https://freestatistics.org/blog/index.php?v=date/2016/Jul/29/t1469827220pxiwti5iux74u75.htm/, Retrieved Mon, 29 Apr 2024 10:08:02 +0000
Statistical Computations at FreeStatistics.org, Office for Research Development and Education, URL https://freestatistics.org/blog/index.php?pk=295968, Retrieved Mon, 29 Apr 2024 10:08:02 +0000
QR Codes:

Original text written by user:
IsPrivate?No (this computation is public)
User-defined keywordsmemoria, vocabulario, educacion
Estimated Impact212
Family? (F = Feedback message, R = changed R code, M = changed R Module, P = changed Parameters, D = changed Data)
-       [Multiple Regression] [Estadistico z] [2016-07-29 20:09:04] [d41d8cd98f00b204e9800998ecf8427e] [Current]
Feedback Forum

Post a new message
Dataseries X:
8.7 40 7
10.0 37 6
7.7 31 6
8.0 39 8
8.3 28 6
7.7 25 7
6.7 26 5
7.3 29 6
6.0 24 8
7.0 26 5
8.3 29 4
8.0 28 7
8.0 29 6
6.0 18 5
5.7 15 6
4.0 12 8
6.7 17 6
5.0 8 5
4.3 9 5
3.0 9 6
8.0 32 7
9.3 38 9
7.3 27 6
7.7 28 7
7.7 25 7
7.7 27 7
6.0 13 6
6.0 14 5
3.5 9 5
5.3 8 4
8.7 36 7
9.3 39 8
7.3 36 7
8.0 29 6
7.0 28 7
7.0 23 7
7.0 28 7
8.0 27 5
7.3 28 7
5.7 23 9
7.7 24 6
5.7 14 6
4.7 13 5
6.0 18 6
6.3 19 5
4.3 12 6
3.0 13 6
3.0 12 5
5.3 16 7
8.7 17 7
4.7 15 6
3.0 8 4
3.0 9 7
4.0 7 3
8.3 28 7
4.5 16 7
7.0 18 6
6.0 18 7
5.3 9 4
1.0 5 6
8.0 40 10
8.3 37 8
7.7 34 7
8.7 36 8
6.3 33 7
7.7 25 7
9.7 29 6
5.7 25 7
7.0 26 5
7.3 28 6
5.0 22 8
6.0 17 5
3.0 15 7
3.0 13 7
5.7 18 7
6.0 19 6
4.0 15 6
4.7 16 6
1.0 13 6
6.0 18 7
3.0 5 6
5.0 9 6
2.0 7 7
8.0 32 8
6.3 20 7
7.0 19 7
3.0 13 6
5.0 17 6
5.0 16 5
3.0 8 5
9.7 40 9
8.7 40 8
8.0 37 6
7.3 26 7
9.0 28 7
7.7 26 7
7.0 21 7
8.3 29 5
7.3 25 6
6.0 16 6
6.3 17 7
9.0 14 7
6.3 18 7
4.7 9 5
4.0 7 7
8.7 37 7
8.0 30 7
7.0 20 7
7.7 24 6
7.3 29 7
8.3 27 6
6.3 24 6
8.0 28 7
4.5 14 6
5.3 16 6
7.7 19 7
4.7 15 6
5.3 14 5
3.3 8 6
2.0 6 5


Summary of computational transaction
Raw Inputview raw input (R code)
Raw Outputview raw output of R engine
Computing time6 seconds
R Server'Herman Ole Andreas Wold' @ wold.wessa.net

\begin{tabular}{lllllllll}
\hline
Summary of computational transaction \tabularnewline
Raw Input & view raw input (R code)  \tabularnewline
Raw Output & view raw output of R engine  \tabularnewline
Computing time & 6 seconds \tabularnewline
R Server & 'Herman Ole Andreas Wold' @ wold.wessa.net \tabularnewline
\hline
\end{tabular}
%Source: https://freestatistics.org/blog/index.php?pk=295968&T=0

[TABLE]
[ROW][C]Summary of computational transaction[/C][/ROW]
[ROW][C]Raw Input[/C][C]view raw input (R code) [/C][/ROW]
[ROW][C]Raw Output[/C][C]view raw output of R engine [/C][/ROW]
[ROW][C]Computing time[/C][C]6 seconds[/C][/ROW]
[ROW][C]R Server[/C][C]'Herman Ole Andreas Wold' @ wold.wessa.net[/C][/ROW]
[/TABLE]
Source: https://freestatistics.org/blog/index.php?pk=295968&T=0

Globally Unique Identifier (entire table): ba.freestatistics.org/blog/index.php?pk=295968&T=0

As an alternative you can also use a QR Code:  

The GUIDs for individual cells are displayed in the table below:

Summary of computational transaction
Raw Inputview raw input (R code)
Raw Outputview raw output of R engine
Computing time6 seconds
R Server'Herman Ole Andreas Wold' @ wold.wessa.net


Multiple Linear Regression - Estimated Regression Equation
promedio[t] = + 3.32364 + 0.19162vocabulario[t] -0.194239memoria[t] + 0.00126058t + e[t]
Warning: you did not specify the column number of the endogenous series! The first column was selected by default.

\begin{tabular}{lllllllll}
\hline
Multiple Linear Regression - Estimated Regression Equation \tabularnewline
promedio[t] =  +  3.32364 +  0.19162vocabulario[t] -0.194239memoria[t] +  0.00126058t  + e[t] \tabularnewline
Warning: you did not specify the column number of the endogenous series! The first column was selected by default. \tabularnewline
\hline
\end{tabular}
%Source: https://freestatistics.org/blog/index.php?pk=295968&T=1

[TABLE]
[ROW][C]Multiple Linear Regression - Estimated Regression Equation[/C][/ROW]
[ROW][C]promedio[t] =  +  3.32364 +  0.19162vocabulario[t] -0.194239memoria[t] +  0.00126058t  + e[t][/C][/ROW]
[ROW][C]Warning: you did not specify the column number of the endogenous series! The first column was selected by default.[/C][/ROW]
[/TABLE]
Source: https://freestatistics.org/blog/index.php?pk=295968&T=1

Globally Unique Identifier (entire table): ba.freestatistics.org/blog/index.php?pk=295968&T=1

As an alternative you can also use a QR Code:  

The GUIDs for individual cells are displayed in the table below:

Multiple Linear Regression - Estimated Regression Equation
promedio[t] = + 3.32364 + 0.19162vocabulario[t] -0.194239memoria[t] + 0.00126058t + e[t]
Warning: you did not specify the column number of the endogenous series! The first column was selected by default.


Multiple Linear Regression - Ordinary Least Squares
VariableParameterS.D.T-STATH0: parameter = 02-tail p-value1-tail p-value
(Intercept)+3.324 0.5845+5.6860e+00 9.861e-08 4.931e-08
vocabulario+0.1916 0.01256+1.5260e+01 1.685e-29 8.426e-30
memoria-0.1942 0.104-1.8670e+00 0.06438 0.03219
t+0.001261 0.002922+4.3140e-01 0.667 0.3335

\begin{tabular}{lllllllll}
\hline
Multiple Linear Regression - Ordinary Least Squares \tabularnewline
Variable & Parameter & S.D. & T-STATH0: parameter = 0 & 2-tail p-value & 1-tail p-value \tabularnewline
(Intercept) & +3.324 &  0.5845 & +5.6860e+00 &  9.861e-08 &  4.931e-08 \tabularnewline
vocabulario & +0.1916 &  0.01256 & +1.5260e+01 &  1.685e-29 &  8.426e-30 \tabularnewline
memoria & -0.1942 &  0.104 & -1.8670e+00 &  0.06438 &  0.03219 \tabularnewline
t & +0.001261 &  0.002922 & +4.3140e-01 &  0.667 &  0.3335 \tabularnewline
\hline
\end{tabular}
%Source: https://freestatistics.org/blog/index.php?pk=295968&T=2

[TABLE]
[ROW][C]Multiple Linear Regression - Ordinary Least Squares[/C][/ROW]
[ROW][C]Variable[/C][C]Parameter[/C][C]S.D.[/C][C]T-STATH0: parameter = 0[/C][C]2-tail p-value[/C][C]1-tail p-value[/C][/ROW]
[ROW][C](Intercept)[/C][C]+3.324[/C][C] 0.5845[/C][C]+5.6860e+00[/C][C] 9.861e-08[/C][C] 4.931e-08[/C][/ROW]
[ROW][C]vocabulario[/C][C]+0.1916[/C][C] 0.01256[/C][C]+1.5260e+01[/C][C] 1.685e-29[/C][C] 8.426e-30[/C][/ROW]
[ROW][C]memoria[/C][C]-0.1942[/C][C] 0.104[/C][C]-1.8670e+00[/C][C] 0.06438[/C][C] 0.03219[/C][/ROW]
[ROW][C]t[/C][C]+0.001261[/C][C] 0.002922[/C][C]+4.3140e-01[/C][C] 0.667[/C][C] 0.3335[/C][/ROW]
[/TABLE]
Source: https://freestatistics.org/blog/index.php?pk=295968&T=2

Globally Unique Identifier (entire table): ba.freestatistics.org/blog/index.php?pk=295968&T=2

As an alternative you can also use a QR Code:  

The GUIDs for individual cells are displayed in the table below:

Multiple Linear Regression - Ordinary Least Squares
VariableParameterS.D.T-STATH0: parameter = 02-tail p-value1-tail p-value
(Intercept)+3.324 0.5845+5.6860e+00 9.861e-08 4.931e-08
vocabulario+0.1916 0.01256+1.5260e+01 1.685e-29 8.426e-30
memoria-0.1942 0.104-1.8670e+00 0.06438 0.03219
t+0.001261 0.002922+4.3140e-01 0.667 0.3335


Multiple Linear Regression - Regression Statistics
Multiple R 0.8496
R-squared 0.7217
Adjusted R-squared 0.7146
F-TEST (value) 100.3
F-TEST (DF numerator)3
F-TEST (DF denominator)116
p-value 0
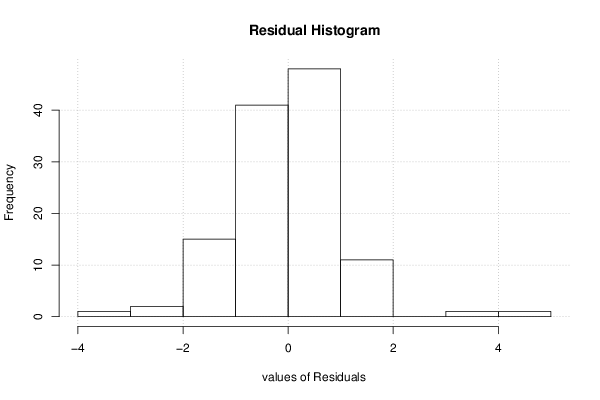
Multiple Linear Regression - Residual Statistics
Residual Standard Deviation 1.07
Sum Squared Residuals 132.9

\begin{tabular}{lllllllll}
\hline
Multiple Linear Regression - Regression Statistics \tabularnewline
Multiple R &  0.8496 \tabularnewline
R-squared &  0.7217 \tabularnewline
Adjusted R-squared &  0.7146 \tabularnewline
F-TEST (value) &  100.3 \tabularnewline
F-TEST (DF numerator) & 3 \tabularnewline
F-TEST (DF denominator) & 116 \tabularnewline
p-value &  0 \tabularnewline
Multiple Linear Regression - Residual Statistics \tabularnewline
Residual Standard Deviation &  1.07 \tabularnewline
Sum Squared Residuals &  132.9 \tabularnewline
\hline
\end{tabular}
%Source: https://freestatistics.org/blog/index.php?pk=295968&T=3

[TABLE]
[ROW][C]Multiple Linear Regression - Regression Statistics[/C][/ROW]
[ROW][C]Multiple R[/C][C] 0.8496[/C][/ROW]
[ROW][C]R-squared[/C][C] 0.7217[/C][/ROW]
[ROW][C]Adjusted R-squared[/C][C] 0.7146[/C][/ROW]
[ROW][C]F-TEST (value)[/C][C] 100.3[/C][/ROW]
[ROW][C]F-TEST (DF numerator)[/C][C]3[/C][/ROW]
[ROW][C]F-TEST (DF denominator)[/C][C]116[/C][/ROW]
[ROW][C]p-value[/C][C] 0[/C][/ROW]
[ROW][C]Multiple Linear Regression - Residual Statistics[/C][/ROW]
[ROW][C]Residual Standard Deviation[/C][C] 1.07[/C][/ROW]
[ROW][C]Sum Squared Residuals[/C][C] 132.9[/C][/ROW]
[/TABLE]
Source: https://freestatistics.org/blog/index.php?pk=295968&T=3

Globally Unique Identifier (entire table): ba.freestatistics.org/blog/index.php?pk=295968&T=3

As an alternative you can also use a QR Code:  

The GUIDs for individual cells are displayed in the table below:

Multiple Linear Regression - Regression Statistics
Multiple R 0.8496
R-squared 0.7217
Adjusted R-squared 0.7146
F-TEST (value) 100.3
F-TEST (DF numerator)3
F-TEST (DF denominator)116
p-value 0
Multiple Linear Regression - Residual Statistics
Residual Standard Deviation 1.07
Sum Squared Residuals 132.9


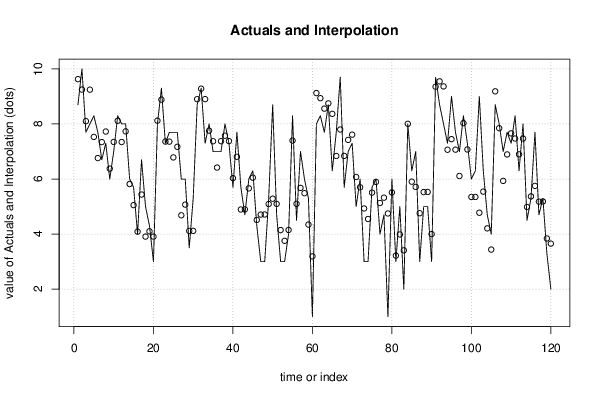
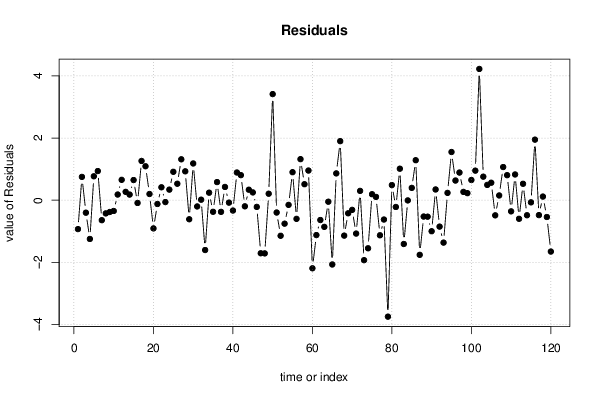
Multiple Linear Regression - Actuals, Interpolation, and Residuals
Time or IndexActualsInterpolationForecastResidualsPrediction Error
1 8.7 9.63-0.93
2 10 9.251 0.7493
3 7.7 8.102-0.4022
4 8 9.248-1.248
5 8.3 7.53 0.7701
6 7.7 6.762 0.938
7 6.7 7.343-0.6434
8 7.3 7.725-0.4253
9 6 6.38-0.3799
10 7 7.347-0.3472
11 8.3 8.118 0.1825
12 8 7.344 0.6556
13 8 7.732 0.2684
14 6 5.819 0.1808
15 5.7 5.051 0.6486
16 4 4.089-0.08933
17 6.7 5.437 1.263
18 5 3.908 1.092
19 4.3 4.101 0.199
20 3 3.908-0.908
21 8 8.122-0.1223
22 9.3 8.885 0.4152
23 7.3 7.361-0.06093
24 7.7 7.36 0.3404
25 7.7 6.786 0.914
26 7.7 7.17 0.5295
27 6 4.683 1.317
28 6 5.07 0.9296
29 3.5 4.114-0.6136
30 5.3 4.117 1.183
31 8.7 8.901-0.2014
32 9.3 9.283 0.01676
33 7.3 8.904-1.604
34 8 7.758 0.242
35 7 7.373-0.3734
36 7 6.417 0.5834
37 7 7.376-0.376
38 8 7.574 0.4259
39 7.3 7.378-0.07848
40 5.7 6.033-0.3332
41 7.7 6.809 0.8912
42 5.7 4.894 0.8062
43 4.7 4.898-0.1977
44 6 5.663 0.3372
45 6.3 6.05 0.2501
46 4.3 4.516-0.2156
47 3 4.709-1.709
48 3 4.712-1.712
49 5.3 5.092 0.2083
50 8.7 5.285 3.415
51 4.7 5.097-0.3968
52 3 4.145-1.145
53 3 3.755-0.7554
54 4 4.15-0.1503
55 8.3 7.399 0.9013
56 4.5 5.1-0.6005
57 7 5.679 1.321
58 6 5.486 0.5138
59 5.3 4.346 0.9544
60 1 3.192-2.192
61 8 9.123-1.123
62 8.3 8.938-0.6378
63 7.7 8.558-0.8585
64 8.7 8.749-0.04872
65 6.3 8.369-2.069
66 7.7 6.838 0.8623
67 9.7 7.8 1.9
68 5.7 6.84-1.14
69 7 7.422-0.4215
70 7.3 7.612-0.3118
71 5 6.075-1.075
72 6 5.701 0.2993
73 3 4.93-1.93
74 3 4.548-1.548
75 5.7 5.508 0.1923
76 6 5.895 0.1052
77 4 5.13-1.13
78 4.7 5.322-0.6224
79 1 4.749-3.749
80 6 5.514 0.486
81 3 3.218-0.2184
82 5 3.986 1.014
83 2 3.41-1.41
84 8 8.007-0.007452
85 6.3 5.904 0.3965
86 7 5.713 1.287
87 3 4.759-1.759
88 5 5.527-0.5267
89 5 5.531-0.5306
90 3 3.999-0.9989
91 9.7 9.355 0.345
92 8.7 9.55-0.8505
93 8 9.365-1.365
94 7.3 7.065 0.2354
95 9 7.449 1.551
96 7.7 7.067 0.6329
97 7 6.11 0.8897
98 8.3 8.033 0.267
99 7.3 7.074 0.2265
100 6 5.35 0.6498
101 6.3 5.349 0.9512
102 9 4.775 4.225
103 6.3 5.543 0.757
104 4.7 4.208 0.4919
105 4 3.438 0.5623
106 8.7 9.188-0.4875
107 8 7.847 0.1526
108 7 5.933 1.067
109 7.7 6.894 0.8055
110 7.3 7.66-0.3596
111 8.3 7.472 0.8281
112 6.3 6.898-0.5983
113 8 7.472 0.5282
114 4.5 4.985-0.4846
115 5.3 5.369-0.06909
116 7.7 5.751 1.949
117 4.7 5.18-0.48
118 5.3 5.184 0.1161
119 3.3 3.841-0.5412
120 2 3.653-1.653

\begin{tabular}{lllllllll}
\hline
Multiple Linear Regression - Actuals, Interpolation, and Residuals \tabularnewline
Time or Index & Actuals & InterpolationForecast & ResidualsPrediction Error \tabularnewline
1 &  8.7 &  9.63 & -0.93 \tabularnewline
2 &  10 &  9.251 &  0.7493 \tabularnewline
3 &  7.7 &  8.102 & -0.4022 \tabularnewline
4 &  8 &  9.248 & -1.248 \tabularnewline
5 &  8.3 &  7.53 &  0.7701 \tabularnewline
6 &  7.7 &  6.762 &  0.938 \tabularnewline
7 &  6.7 &  7.343 & -0.6434 \tabularnewline
8 &  7.3 &  7.725 & -0.4253 \tabularnewline
9 &  6 &  6.38 & -0.3799 \tabularnewline
10 &  7 &  7.347 & -0.3472 \tabularnewline
11 &  8.3 &  8.118 &  0.1825 \tabularnewline
12 &  8 &  7.344 &  0.6556 \tabularnewline
13 &  8 &  7.732 &  0.2684 \tabularnewline
14 &  6 &  5.819 &  0.1808 \tabularnewline
15 &  5.7 &  5.051 &  0.6486 \tabularnewline
16 &  4 &  4.089 & -0.08933 \tabularnewline
17 &  6.7 &  5.437 &  1.263 \tabularnewline
18 &  5 &  3.908 &  1.092 \tabularnewline
19 &  4.3 &  4.101 &  0.199 \tabularnewline
20 &  3 &  3.908 & -0.908 \tabularnewline
21 &  8 &  8.122 & -0.1223 \tabularnewline
22 &  9.3 &  8.885 &  0.4152 \tabularnewline
23 &  7.3 &  7.361 & -0.06093 \tabularnewline
24 &  7.7 &  7.36 &  0.3404 \tabularnewline
25 &  7.7 &  6.786 &  0.914 \tabularnewline
26 &  7.7 &  7.17 &  0.5295 \tabularnewline
27 &  6 &  4.683 &  1.317 \tabularnewline
28 &  6 &  5.07 &  0.9296 \tabularnewline
29 &  3.5 &  4.114 & -0.6136 \tabularnewline
30 &  5.3 &  4.117 &  1.183 \tabularnewline
31 &  8.7 &  8.901 & -0.2014 \tabularnewline
32 &  9.3 &  9.283 &  0.01676 \tabularnewline
33 &  7.3 &  8.904 & -1.604 \tabularnewline
34 &  8 &  7.758 &  0.242 \tabularnewline
35 &  7 &  7.373 & -0.3734 \tabularnewline
36 &  7 &  6.417 &  0.5834 \tabularnewline
37 &  7 &  7.376 & -0.376 \tabularnewline
38 &  8 &  7.574 &  0.4259 \tabularnewline
39 &  7.3 &  7.378 & -0.07848 \tabularnewline
40 &  5.7 &  6.033 & -0.3332 \tabularnewline
41 &  7.7 &  6.809 &  0.8912 \tabularnewline
42 &  5.7 &  4.894 &  0.8062 \tabularnewline
43 &  4.7 &  4.898 & -0.1977 \tabularnewline
44 &  6 &  5.663 &  0.3372 \tabularnewline
45 &  6.3 &  6.05 &  0.2501 \tabularnewline
46 &  4.3 &  4.516 & -0.2156 \tabularnewline
47 &  3 &  4.709 & -1.709 \tabularnewline
48 &  3 &  4.712 & -1.712 \tabularnewline
49 &  5.3 &  5.092 &  0.2083 \tabularnewline
50 &  8.7 &  5.285 &  3.415 \tabularnewline
51 &  4.7 &  5.097 & -0.3968 \tabularnewline
52 &  3 &  4.145 & -1.145 \tabularnewline
53 &  3 &  3.755 & -0.7554 \tabularnewline
54 &  4 &  4.15 & -0.1503 \tabularnewline
55 &  8.3 &  7.399 &  0.9013 \tabularnewline
56 &  4.5 &  5.1 & -0.6005 \tabularnewline
57 &  7 &  5.679 &  1.321 \tabularnewline
58 &  6 &  5.486 &  0.5138 \tabularnewline
59 &  5.3 &  4.346 &  0.9544 \tabularnewline
60 &  1 &  3.192 & -2.192 \tabularnewline
61 &  8 &  9.123 & -1.123 \tabularnewline
62 &  8.3 &  8.938 & -0.6378 \tabularnewline
63 &  7.7 &  8.558 & -0.8585 \tabularnewline
64 &  8.7 &  8.749 & -0.04872 \tabularnewline
65 &  6.3 &  8.369 & -2.069 \tabularnewline
66 &  7.7 &  6.838 &  0.8623 \tabularnewline
67 &  9.7 &  7.8 &  1.9 \tabularnewline
68 &  5.7 &  6.84 & -1.14 \tabularnewline
69 &  7 &  7.422 & -0.4215 \tabularnewline
70 &  7.3 &  7.612 & -0.3118 \tabularnewline
71 &  5 &  6.075 & -1.075 \tabularnewline
72 &  6 &  5.701 &  0.2993 \tabularnewline
73 &  3 &  4.93 & -1.93 \tabularnewline
74 &  3 &  4.548 & -1.548 \tabularnewline
75 &  5.7 &  5.508 &  0.1923 \tabularnewline
76 &  6 &  5.895 &  0.1052 \tabularnewline
77 &  4 &  5.13 & -1.13 \tabularnewline
78 &  4.7 &  5.322 & -0.6224 \tabularnewline
79 &  1 &  4.749 & -3.749 \tabularnewline
80 &  6 &  5.514 &  0.486 \tabularnewline
81 &  3 &  3.218 & -0.2184 \tabularnewline
82 &  5 &  3.986 &  1.014 \tabularnewline
83 &  2 &  3.41 & -1.41 \tabularnewline
84 &  8 &  8.007 & -0.007452 \tabularnewline
85 &  6.3 &  5.904 &  0.3965 \tabularnewline
86 &  7 &  5.713 &  1.287 \tabularnewline
87 &  3 &  4.759 & -1.759 \tabularnewline
88 &  5 &  5.527 & -0.5267 \tabularnewline
89 &  5 &  5.531 & -0.5306 \tabularnewline
90 &  3 &  3.999 & -0.9989 \tabularnewline
91 &  9.7 &  9.355 &  0.345 \tabularnewline
92 &  8.7 &  9.55 & -0.8505 \tabularnewline
93 &  8 &  9.365 & -1.365 \tabularnewline
94 &  7.3 &  7.065 &  0.2354 \tabularnewline
95 &  9 &  7.449 &  1.551 \tabularnewline
96 &  7.7 &  7.067 &  0.6329 \tabularnewline
97 &  7 &  6.11 &  0.8897 \tabularnewline
98 &  8.3 &  8.033 &  0.267 \tabularnewline
99 &  7.3 &  7.074 &  0.2265 \tabularnewline
100 &  6 &  5.35 &  0.6498 \tabularnewline
101 &  6.3 &  5.349 &  0.9512 \tabularnewline
102 &  9 &  4.775 &  4.225 \tabularnewline
103 &  6.3 &  5.543 &  0.757 \tabularnewline
104 &  4.7 &  4.208 &  0.4919 \tabularnewline
105 &  4 &  3.438 &  0.5623 \tabularnewline
106 &  8.7 &  9.188 & -0.4875 \tabularnewline
107 &  8 &  7.847 &  0.1526 \tabularnewline
108 &  7 &  5.933 &  1.067 \tabularnewline
109 &  7.7 &  6.894 &  0.8055 \tabularnewline
110 &  7.3 &  7.66 & -0.3596 \tabularnewline
111 &  8.3 &  7.472 &  0.8281 \tabularnewline
112 &  6.3 &  6.898 & -0.5983 \tabularnewline
113 &  8 &  7.472 &  0.5282 \tabularnewline
114 &  4.5 &  4.985 & -0.4846 \tabularnewline
115 &  5.3 &  5.369 & -0.06909 \tabularnewline
116 &  7.7 &  5.751 &  1.949 \tabularnewline
117 &  4.7 &  5.18 & -0.48 \tabularnewline
118 &  5.3 &  5.184 &  0.1161 \tabularnewline
119 &  3.3 &  3.841 & -0.5412 \tabularnewline
120 &  2 &  3.653 & -1.653 \tabularnewline
\hline
\end{tabular}
%Source: https://freestatistics.org/blog/index.php?pk=295968&T=4

[TABLE]
[ROW][C]Multiple Linear Regression - Actuals, Interpolation, and Residuals[/C][/ROW]
[ROW][C]Time or Index[/C][C]Actuals[/C][C]InterpolationForecast[/C][C]ResidualsPrediction Error[/C][/ROW]
[ROW][C]1[/C][C] 8.7[/C][C] 9.63[/C][C]-0.93[/C][/ROW]
[ROW][C]2[/C][C] 10[/C][C] 9.251[/C][C] 0.7493[/C][/ROW]
[ROW][C]3[/C][C] 7.7[/C][C] 8.102[/C][C]-0.4022[/C][/ROW]
[ROW][C]4[/C][C] 8[/C][C] 9.248[/C][C]-1.248[/C][/ROW]
[ROW][C]5[/C][C] 8.3[/C][C] 7.53[/C][C] 0.7701[/C][/ROW]
[ROW][C]6[/C][C] 7.7[/C][C] 6.762[/C][C] 0.938[/C][/ROW]
[ROW][C]7[/C][C] 6.7[/C][C] 7.343[/C][C]-0.6434[/C][/ROW]
[ROW][C]8[/C][C] 7.3[/C][C] 7.725[/C][C]-0.4253[/C][/ROW]
[ROW][C]9[/C][C] 6[/C][C] 6.38[/C][C]-0.3799[/C][/ROW]
[ROW][C]10[/C][C] 7[/C][C] 7.347[/C][C]-0.3472[/C][/ROW]
[ROW][C]11[/C][C] 8.3[/C][C] 8.118[/C][C] 0.1825[/C][/ROW]
[ROW][C]12[/C][C] 8[/C][C] 7.344[/C][C] 0.6556[/C][/ROW]
[ROW][C]13[/C][C] 8[/C][C] 7.732[/C][C] 0.2684[/C][/ROW]
[ROW][C]14[/C][C] 6[/C][C] 5.819[/C][C] 0.1808[/C][/ROW]
[ROW][C]15[/C][C] 5.7[/C][C] 5.051[/C][C] 0.6486[/C][/ROW]
[ROW][C]16[/C][C] 4[/C][C] 4.089[/C][C]-0.08933[/C][/ROW]
[ROW][C]17[/C][C] 6.7[/C][C] 5.437[/C][C] 1.263[/C][/ROW]
[ROW][C]18[/C][C] 5[/C][C] 3.908[/C][C] 1.092[/C][/ROW]
[ROW][C]19[/C][C] 4.3[/C][C] 4.101[/C][C] 0.199[/C][/ROW]
[ROW][C]20[/C][C] 3[/C][C] 3.908[/C][C]-0.908[/C][/ROW]
[ROW][C]21[/C][C] 8[/C][C] 8.122[/C][C]-0.1223[/C][/ROW]
[ROW][C]22[/C][C] 9.3[/C][C] 8.885[/C][C] 0.4152[/C][/ROW]
[ROW][C]23[/C][C] 7.3[/C][C] 7.361[/C][C]-0.06093[/C][/ROW]
[ROW][C]24[/C][C] 7.7[/C][C] 7.36[/C][C] 0.3404[/C][/ROW]
[ROW][C]25[/C][C] 7.7[/C][C] 6.786[/C][C] 0.914[/C][/ROW]
[ROW][C]26[/C][C] 7.7[/C][C] 7.17[/C][C] 0.5295[/C][/ROW]
[ROW][C]27[/C][C] 6[/C][C] 4.683[/C][C] 1.317[/C][/ROW]
[ROW][C]28[/C][C] 6[/C][C] 5.07[/C][C] 0.9296[/C][/ROW]
[ROW][C]29[/C][C] 3.5[/C][C] 4.114[/C][C]-0.6136[/C][/ROW]
[ROW][C]30[/C][C] 5.3[/C][C] 4.117[/C][C] 1.183[/C][/ROW]
[ROW][C]31[/C][C] 8.7[/C][C] 8.901[/C][C]-0.2014[/C][/ROW]
[ROW][C]32[/C][C] 9.3[/C][C] 9.283[/C][C] 0.01676[/C][/ROW]
[ROW][C]33[/C][C] 7.3[/C][C] 8.904[/C][C]-1.604[/C][/ROW]
[ROW][C]34[/C][C] 8[/C][C] 7.758[/C][C] 0.242[/C][/ROW]
[ROW][C]35[/C][C] 7[/C][C] 7.373[/C][C]-0.3734[/C][/ROW]
[ROW][C]36[/C][C] 7[/C][C] 6.417[/C][C] 0.5834[/C][/ROW]
[ROW][C]37[/C][C] 7[/C][C] 7.376[/C][C]-0.376[/C][/ROW]
[ROW][C]38[/C][C] 8[/C][C] 7.574[/C][C] 0.4259[/C][/ROW]
[ROW][C]39[/C][C] 7.3[/C][C] 7.378[/C][C]-0.07848[/C][/ROW]
[ROW][C]40[/C][C] 5.7[/C][C] 6.033[/C][C]-0.3332[/C][/ROW]
[ROW][C]41[/C][C] 7.7[/C][C] 6.809[/C][C] 0.8912[/C][/ROW]
[ROW][C]42[/C][C] 5.7[/C][C] 4.894[/C][C] 0.8062[/C][/ROW]
[ROW][C]43[/C][C] 4.7[/C][C] 4.898[/C][C]-0.1977[/C][/ROW]
[ROW][C]44[/C][C] 6[/C][C] 5.663[/C][C] 0.3372[/C][/ROW]
[ROW][C]45[/C][C] 6.3[/C][C] 6.05[/C][C] 0.2501[/C][/ROW]
[ROW][C]46[/C][C] 4.3[/C][C] 4.516[/C][C]-0.2156[/C][/ROW]
[ROW][C]47[/C][C] 3[/C][C] 4.709[/C][C]-1.709[/C][/ROW]
[ROW][C]48[/C][C] 3[/C][C] 4.712[/C][C]-1.712[/C][/ROW]
[ROW][C]49[/C][C] 5.3[/C][C] 5.092[/C][C] 0.2083[/C][/ROW]
[ROW][C]50[/C][C] 8.7[/C][C] 5.285[/C][C] 3.415[/C][/ROW]
[ROW][C]51[/C][C] 4.7[/C][C] 5.097[/C][C]-0.3968[/C][/ROW]
[ROW][C]52[/C][C] 3[/C][C] 4.145[/C][C]-1.145[/C][/ROW]
[ROW][C]53[/C][C] 3[/C][C] 3.755[/C][C]-0.7554[/C][/ROW]
[ROW][C]54[/C][C] 4[/C][C] 4.15[/C][C]-0.1503[/C][/ROW]
[ROW][C]55[/C][C] 8.3[/C][C] 7.399[/C][C] 0.9013[/C][/ROW]
[ROW][C]56[/C][C] 4.5[/C][C] 5.1[/C][C]-0.6005[/C][/ROW]
[ROW][C]57[/C][C] 7[/C][C] 5.679[/C][C] 1.321[/C][/ROW]
[ROW][C]58[/C][C] 6[/C][C] 5.486[/C][C] 0.5138[/C][/ROW]
[ROW][C]59[/C][C] 5.3[/C][C] 4.346[/C][C] 0.9544[/C][/ROW]
[ROW][C]60[/C][C] 1[/C][C] 3.192[/C][C]-2.192[/C][/ROW]
[ROW][C]61[/C][C] 8[/C][C] 9.123[/C][C]-1.123[/C][/ROW]
[ROW][C]62[/C][C] 8.3[/C][C] 8.938[/C][C]-0.6378[/C][/ROW]
[ROW][C]63[/C][C] 7.7[/C][C] 8.558[/C][C]-0.8585[/C][/ROW]
[ROW][C]64[/C][C] 8.7[/C][C] 8.749[/C][C]-0.04872[/C][/ROW]
[ROW][C]65[/C][C] 6.3[/C][C] 8.369[/C][C]-2.069[/C][/ROW]
[ROW][C]66[/C][C] 7.7[/C][C] 6.838[/C][C] 0.8623[/C][/ROW]
[ROW][C]67[/C][C] 9.7[/C][C] 7.8[/C][C] 1.9[/C][/ROW]
[ROW][C]68[/C][C] 5.7[/C][C] 6.84[/C][C]-1.14[/C][/ROW]
[ROW][C]69[/C][C] 7[/C][C] 7.422[/C][C]-0.4215[/C][/ROW]
[ROW][C]70[/C][C] 7.3[/C][C] 7.612[/C][C]-0.3118[/C][/ROW]
[ROW][C]71[/C][C] 5[/C][C] 6.075[/C][C]-1.075[/C][/ROW]
[ROW][C]72[/C][C] 6[/C][C] 5.701[/C][C] 0.2993[/C][/ROW]
[ROW][C]73[/C][C] 3[/C][C] 4.93[/C][C]-1.93[/C][/ROW]
[ROW][C]74[/C][C] 3[/C][C] 4.548[/C][C]-1.548[/C][/ROW]
[ROW][C]75[/C][C] 5.7[/C][C] 5.508[/C][C] 0.1923[/C][/ROW]
[ROW][C]76[/C][C] 6[/C][C] 5.895[/C][C] 0.1052[/C][/ROW]
[ROW][C]77[/C][C] 4[/C][C] 5.13[/C][C]-1.13[/C][/ROW]
[ROW][C]78[/C][C] 4.7[/C][C] 5.322[/C][C]-0.6224[/C][/ROW]
[ROW][C]79[/C][C] 1[/C][C] 4.749[/C][C]-3.749[/C][/ROW]
[ROW][C]80[/C][C] 6[/C][C] 5.514[/C][C] 0.486[/C][/ROW]
[ROW][C]81[/C][C] 3[/C][C] 3.218[/C][C]-0.2184[/C][/ROW]
[ROW][C]82[/C][C] 5[/C][C] 3.986[/C][C] 1.014[/C][/ROW]
[ROW][C]83[/C][C] 2[/C][C] 3.41[/C][C]-1.41[/C][/ROW]
[ROW][C]84[/C][C] 8[/C][C] 8.007[/C][C]-0.007452[/C][/ROW]
[ROW][C]85[/C][C] 6.3[/C][C] 5.904[/C][C] 0.3965[/C][/ROW]
[ROW][C]86[/C][C] 7[/C][C] 5.713[/C][C] 1.287[/C][/ROW]
[ROW][C]87[/C][C] 3[/C][C] 4.759[/C][C]-1.759[/C][/ROW]
[ROW][C]88[/C][C] 5[/C][C] 5.527[/C][C]-0.5267[/C][/ROW]
[ROW][C]89[/C][C] 5[/C][C] 5.531[/C][C]-0.5306[/C][/ROW]
[ROW][C]90[/C][C] 3[/C][C] 3.999[/C][C]-0.9989[/C][/ROW]
[ROW][C]91[/C][C] 9.7[/C][C] 9.355[/C][C] 0.345[/C][/ROW]
[ROW][C]92[/C][C] 8.7[/C][C] 9.55[/C][C]-0.8505[/C][/ROW]
[ROW][C]93[/C][C] 8[/C][C] 9.365[/C][C]-1.365[/C][/ROW]
[ROW][C]94[/C][C] 7.3[/C][C] 7.065[/C][C] 0.2354[/C][/ROW]
[ROW][C]95[/C][C] 9[/C][C] 7.449[/C][C] 1.551[/C][/ROW]
[ROW][C]96[/C][C] 7.7[/C][C] 7.067[/C][C] 0.6329[/C][/ROW]
[ROW][C]97[/C][C] 7[/C][C] 6.11[/C][C] 0.8897[/C][/ROW]
[ROW][C]98[/C][C] 8.3[/C][C] 8.033[/C][C] 0.267[/C][/ROW]
[ROW][C]99[/C][C] 7.3[/C][C] 7.074[/C][C] 0.2265[/C][/ROW]
[ROW][C]100[/C][C] 6[/C][C] 5.35[/C][C] 0.6498[/C][/ROW]
[ROW][C]101[/C][C] 6.3[/C][C] 5.349[/C][C] 0.9512[/C][/ROW]
[ROW][C]102[/C][C] 9[/C][C] 4.775[/C][C] 4.225[/C][/ROW]
[ROW][C]103[/C][C] 6.3[/C][C] 5.543[/C][C] 0.757[/C][/ROW]
[ROW][C]104[/C][C] 4.7[/C][C] 4.208[/C][C] 0.4919[/C][/ROW]
[ROW][C]105[/C][C] 4[/C][C] 3.438[/C][C] 0.5623[/C][/ROW]
[ROW][C]106[/C][C] 8.7[/C][C] 9.188[/C][C]-0.4875[/C][/ROW]
[ROW][C]107[/C][C] 8[/C][C] 7.847[/C][C] 0.1526[/C][/ROW]
[ROW][C]108[/C][C] 7[/C][C] 5.933[/C][C] 1.067[/C][/ROW]
[ROW][C]109[/C][C] 7.7[/C][C] 6.894[/C][C] 0.8055[/C][/ROW]
[ROW][C]110[/C][C] 7.3[/C][C] 7.66[/C][C]-0.3596[/C][/ROW]
[ROW][C]111[/C][C] 8.3[/C][C] 7.472[/C][C] 0.8281[/C][/ROW]
[ROW][C]112[/C][C] 6.3[/C][C] 6.898[/C][C]-0.5983[/C][/ROW]
[ROW][C]113[/C][C] 8[/C][C] 7.472[/C][C] 0.5282[/C][/ROW]
[ROW][C]114[/C][C] 4.5[/C][C] 4.985[/C][C]-0.4846[/C][/ROW]
[ROW][C]115[/C][C] 5.3[/C][C] 5.369[/C][C]-0.06909[/C][/ROW]
[ROW][C]116[/C][C] 7.7[/C][C] 5.751[/C][C] 1.949[/C][/ROW]
[ROW][C]117[/C][C] 4.7[/C][C] 5.18[/C][C]-0.48[/C][/ROW]
[ROW][C]118[/C][C] 5.3[/C][C] 5.184[/C][C] 0.1161[/C][/ROW]
[ROW][C]119[/C][C] 3.3[/C][C] 3.841[/C][C]-0.5412[/C][/ROW]
[ROW][C]120[/C][C] 2[/C][C] 3.653[/C][C]-1.653[/C][/ROW]
[/TABLE]
Source: https://freestatistics.org/blog/index.php?pk=295968&T=4

Globally Unique Identifier (entire table): ba.freestatistics.org/blog/index.php?pk=295968&T=4

As an alternative you can also use a QR Code:  

The GUIDs for individual cells are displayed in the table below:

Multiple Linear Regression - Actuals, Interpolation, and Residuals
Time or IndexActualsInterpolationForecastResidualsPrediction Error
1 8.7 9.63-0.93
2 10 9.251 0.7493
3 7.7 8.102-0.4022
4 8 9.248-1.248
5 8.3 7.53 0.7701
6 7.7 6.762 0.938
7 6.7 7.343-0.6434
8 7.3 7.725-0.4253
9 6 6.38-0.3799
10 7 7.347-0.3472
11 8.3 8.118 0.1825
12 8 7.344 0.6556
13 8 7.732 0.2684
14 6 5.819 0.1808
15 5.7 5.051 0.6486
16 4 4.089-0.08933
17 6.7 5.437 1.263
18 5 3.908 1.092
19 4.3 4.101 0.199
20 3 3.908-0.908
21 8 8.122-0.1223
22 9.3 8.885 0.4152
23 7.3 7.361-0.06093
24 7.7 7.36 0.3404
25 7.7 6.786 0.914
26 7.7 7.17 0.5295
27 6 4.683 1.317
28 6 5.07 0.9296
29 3.5 4.114-0.6136
30 5.3 4.117 1.183
31 8.7 8.901-0.2014
32 9.3 9.283 0.01676
33 7.3 8.904-1.604
34 8 7.758 0.242
35 7 7.373-0.3734
36 7 6.417 0.5834
37 7 7.376-0.376
38 8 7.574 0.4259
39 7.3 7.378-0.07848
40 5.7 6.033-0.3332
41 7.7 6.809 0.8912
42 5.7 4.894 0.8062
43 4.7 4.898-0.1977
44 6 5.663 0.3372
45 6.3 6.05 0.2501
46 4.3 4.516-0.2156
47 3 4.709-1.709
48 3 4.712-1.712
49 5.3 5.092 0.2083
50 8.7 5.285 3.415
51 4.7 5.097-0.3968
52 3 4.145-1.145
53 3 3.755-0.7554
54 4 4.15-0.1503
55 8.3 7.399 0.9013
56 4.5 5.1-0.6005
57 7 5.679 1.321
58 6 5.486 0.5138
59 5.3 4.346 0.9544
60 1 3.192-2.192
61 8 9.123-1.123
62 8.3 8.938-0.6378
63 7.7 8.558-0.8585
64 8.7 8.749-0.04872
65 6.3 8.369-2.069
66 7.7 6.838 0.8623
67 9.7 7.8 1.9
68 5.7 6.84-1.14
69 7 7.422-0.4215
70 7.3 7.612-0.3118
71 5 6.075-1.075
72 6 5.701 0.2993
73 3 4.93-1.93
74 3 4.548-1.548
75 5.7 5.508 0.1923
76 6 5.895 0.1052
77 4 5.13-1.13
78 4.7 5.322-0.6224
79 1 4.749-3.749
80 6 5.514 0.486
81 3 3.218-0.2184
82 5 3.986 1.014
83 2 3.41-1.41
84 8 8.007-0.007452
85 6.3 5.904 0.3965
86 7 5.713 1.287
87 3 4.759-1.759
88 5 5.527-0.5267
89 5 5.531-0.5306
90 3 3.999-0.9989
91 9.7 9.355 0.345
92 8.7 9.55-0.8505
93 8 9.365-1.365
94 7.3 7.065 0.2354
95 9 7.449 1.551
96 7.7 7.067 0.6329
97 7 6.11 0.8897
98 8.3 8.033 0.267
99 7.3 7.074 0.2265
100 6 5.35 0.6498
101 6.3 5.349 0.9512
102 9 4.775 4.225
103 6.3 5.543 0.757
104 4.7 4.208 0.4919
105 4 3.438 0.5623
106 8.7 9.188-0.4875
107 8 7.847 0.1526
108 7 5.933 1.067
109 7.7 6.894 0.8055
110 7.3 7.66-0.3596
111 8.3 7.472 0.8281
112 6.3 6.898-0.5983
113 8 7.472 0.5282
114 4.5 4.985-0.4846
115 5.3 5.369-0.06909
116 7.7 5.751 1.949
117 4.7 5.18-0.48
118 5.3 5.184 0.1161
119 3.3 3.841-0.5412
120 2 3.653-1.653


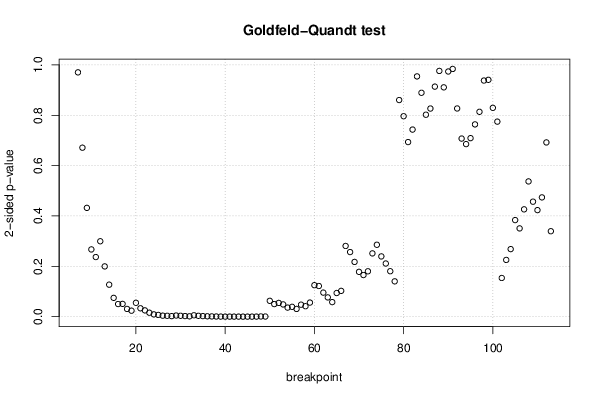
Goldfeld-Quandt test for Heteroskedasticity
p-valuesAlternative Hypothesis
breakpoint indexgreater2-sidedless
7 0.4853 0.9706 0.5147
8 0.3356 0.6713 0.6644
9 0.2161 0.4322 0.7839
10 0.1336 0.2671 0.8664
11 0.1184 0.2369 0.8816
12 0.1498 0.2996 0.8502
13 0.09984 0.1997 0.9002
14 0.06351 0.127 0.9365
15 0.03734 0.07469 0.9627
16 0.02508 0.05017 0.9749
17 0.02536 0.05073 0.9746
18 0.01532 0.03063 0.9847
19 0.01185 0.0237 0.9882
20 0.02747 0.05493 0.9725
21 0.01662 0.03323 0.9834
22 0.01251 0.02502 0.9875
23 0.00782 0.01564 0.9922
24 0.004528 0.009055 0.9955
25 0.003432 0.006863 0.9966
26 0.001959 0.003919 0.998
27 0.001724 0.003447 0.9983
28 0.00104 0.002081 0.999
29 0.002276 0.004551 0.9977
30 0.001738 0.003475 0.9983
31 0.001234 0.002467 0.9988
32 0.0007014 0.001403 0.9993
33 0.002764 0.005527 0.9972
34 0.001676 0.003351 0.9983
35 0.001109 0.002219 0.9989
36 0.000731 0.001462 0.9993
37 0.0004729 0.0009459 0.9995
38 0.0002896 0.0005791 0.9997
39 0.0001618 0.0003235 0.9998
40 9.789e-05 0.0001958 0.9999
41 8.34e-05 0.0001668 0.9999
42 5.573e-05 0.0001115 0.9999
43 4.616e-05 9.233e-05 1
44 2.616e-05 5.232e-05 1
45 1.493e-05 2.986e-05 1
46 1.086e-05 2.172e-05 1
47 9.837e-05 0.0001967 0.9999
48 0.0004186 0.0008373 0.9996
49 0.0002625 0.0005249 0.9997
50 0.03146 0.06292 0.9685
51 0.02503 0.05007 0.975
52 0.02729 0.05457 0.9727
53 0.0243 0.0486 0.9757
54 0.01799 0.03598 0.982
55 0.01952 0.03904 0.9805
56 0.01535 0.0307 0.9846
57 0.02374 0.04748 0.9763
58 0.02073 0.04146 0.9793
59 0.02799 0.05597 0.972
60 0.06254 0.1251 0.9375
61 0.06091 0.1218 0.9391
62 0.04778 0.09557 0.9522
63 0.03826 0.07653 0.9617
64 0.0289 0.0578 0.9711
65 0.04697 0.09395 0.953
66 0.05125 0.1025 0.9488
67 0.1405 0.2809 0.8595
68 0.1283 0.2567 0.8717
69 0.1087 0.2175 0.8913
70 0.089 0.178 0.911
71 0.08268 0.1654 0.9173
72 0.09015 0.1803 0.9099
73 0.1257 0.2514 0.8743
74 0.1428 0.2857 0.8572
75 0.1197 0.2393 0.8803
76 0.1056 0.2112 0.8944
77 0.09026 0.1805 0.9097
78 0.07016 0.1403 0.9298
79 0.4303 0.8606 0.5697
80 0.3982 0.7964 0.6018
81 0.3469 0.6937 0.6531
82 0.3716 0.7432 0.6284
83 0.4772 0.9545 0.5228
84 0.4447 0.8895 0.5553
85 0.4011 0.8022 0.5989
86 0.4134 0.8269 0.5866
87 0.543 0.9139 0.457
88 0.5119 0.9763 0.4881
89 0.4555 0.9111 0.5445
90 0.513 0.974 0.487
91 0.4921 0.9841 0.5079
92 0.5864 0.8271 0.4136
93 0.6462 0.7075 0.3538
94 0.6572 0.6856 0.3428
95 0.6454 0.7092 0.3546
96 0.6181 0.7638 0.3819
97 0.5931 0.8138 0.4069
98 0.531 0.9381 0.469
99 0.4705 0.9409 0.5295
100 0.4148 0.8296 0.5852
101 0.3874 0.7749 0.6126
102 0.9232 0.1537 0.07684
103 0.8873 0.2254 0.1127
104 0.8658 0.2684 0.1342
105 0.8081 0.3837 0.1919
106 0.8247 0.3507 0.1753
107 0.7868 0.4264 0.2132
108 0.7313 0.5373 0.2687
109 0.7716 0.4568 0.2284
110 0.7884 0.4233 0.2116
111 0.7631 0.4738 0.2369
112 0.6539 0.6922 0.3461
113 0.8303 0.3394 0.1697

\begin{tabular}{lllllllll}
\hline
Goldfeld-Quandt test for Heteroskedasticity \tabularnewline
p-values & Alternative Hypothesis \tabularnewline
breakpoint index & greater & 2-sided & less \tabularnewline
7 &  0.4853 &  0.9706 &  0.5147 \tabularnewline
8 &  0.3356 &  0.6713 &  0.6644 \tabularnewline
9 &  0.2161 &  0.4322 &  0.7839 \tabularnewline
10 &  0.1336 &  0.2671 &  0.8664 \tabularnewline
11 &  0.1184 &  0.2369 &  0.8816 \tabularnewline
12 &  0.1498 &  0.2996 &  0.8502 \tabularnewline
13 &  0.09984 &  0.1997 &  0.9002 \tabularnewline
14 &  0.06351 &  0.127 &  0.9365 \tabularnewline
15 &  0.03734 &  0.07469 &  0.9627 \tabularnewline
16 &  0.02508 &  0.05017 &  0.9749 \tabularnewline
17 &  0.02536 &  0.05073 &  0.9746 \tabularnewline
18 &  0.01532 &  0.03063 &  0.9847 \tabularnewline
19 &  0.01185 &  0.0237 &  0.9882 \tabularnewline
20 &  0.02747 &  0.05493 &  0.9725 \tabularnewline
21 &  0.01662 &  0.03323 &  0.9834 \tabularnewline
22 &  0.01251 &  0.02502 &  0.9875 \tabularnewline
23 &  0.00782 &  0.01564 &  0.9922 \tabularnewline
24 &  0.004528 &  0.009055 &  0.9955 \tabularnewline
25 &  0.003432 &  0.006863 &  0.9966 \tabularnewline
26 &  0.001959 &  0.003919 &  0.998 \tabularnewline
27 &  0.001724 &  0.003447 &  0.9983 \tabularnewline
28 &  0.00104 &  0.002081 &  0.999 \tabularnewline
29 &  0.002276 &  0.004551 &  0.9977 \tabularnewline
30 &  0.001738 &  0.003475 &  0.9983 \tabularnewline
31 &  0.001234 &  0.002467 &  0.9988 \tabularnewline
32 &  0.0007014 &  0.001403 &  0.9993 \tabularnewline
33 &  0.002764 &  0.005527 &  0.9972 \tabularnewline
34 &  0.001676 &  0.003351 &  0.9983 \tabularnewline
35 &  0.001109 &  0.002219 &  0.9989 \tabularnewline
36 &  0.000731 &  0.001462 &  0.9993 \tabularnewline
37 &  0.0004729 &  0.0009459 &  0.9995 \tabularnewline
38 &  0.0002896 &  0.0005791 &  0.9997 \tabularnewline
39 &  0.0001618 &  0.0003235 &  0.9998 \tabularnewline
40 &  9.789e-05 &  0.0001958 &  0.9999 \tabularnewline
41 &  8.34e-05 &  0.0001668 &  0.9999 \tabularnewline
42 &  5.573e-05 &  0.0001115 &  0.9999 \tabularnewline
43 &  4.616e-05 &  9.233e-05 &  1 \tabularnewline
44 &  2.616e-05 &  5.232e-05 &  1 \tabularnewline
45 &  1.493e-05 &  2.986e-05 &  1 \tabularnewline
46 &  1.086e-05 &  2.172e-05 &  1 \tabularnewline
47 &  9.837e-05 &  0.0001967 &  0.9999 \tabularnewline
48 &  0.0004186 &  0.0008373 &  0.9996 \tabularnewline
49 &  0.0002625 &  0.0005249 &  0.9997 \tabularnewline
50 &  0.03146 &  0.06292 &  0.9685 \tabularnewline
51 &  0.02503 &  0.05007 &  0.975 \tabularnewline
52 &  0.02729 &  0.05457 &  0.9727 \tabularnewline
53 &  0.0243 &  0.0486 &  0.9757 \tabularnewline
54 &  0.01799 &  0.03598 &  0.982 \tabularnewline
55 &  0.01952 &  0.03904 &  0.9805 \tabularnewline
56 &  0.01535 &  0.0307 &  0.9846 \tabularnewline
57 &  0.02374 &  0.04748 &  0.9763 \tabularnewline
58 &  0.02073 &  0.04146 &  0.9793 \tabularnewline
59 &  0.02799 &  0.05597 &  0.972 \tabularnewline
60 &  0.06254 &  0.1251 &  0.9375 \tabularnewline
61 &  0.06091 &  0.1218 &  0.9391 \tabularnewline
62 &  0.04778 &  0.09557 &  0.9522 \tabularnewline
63 &  0.03826 &  0.07653 &  0.9617 \tabularnewline
64 &  0.0289 &  0.0578 &  0.9711 \tabularnewline
65 &  0.04697 &  0.09395 &  0.953 \tabularnewline
66 &  0.05125 &  0.1025 &  0.9488 \tabularnewline
67 &  0.1405 &  0.2809 &  0.8595 \tabularnewline
68 &  0.1283 &  0.2567 &  0.8717 \tabularnewline
69 &  0.1087 &  0.2175 &  0.8913 \tabularnewline
70 &  0.089 &  0.178 &  0.911 \tabularnewline
71 &  0.08268 &  0.1654 &  0.9173 \tabularnewline
72 &  0.09015 &  0.1803 &  0.9099 \tabularnewline
73 &  0.1257 &  0.2514 &  0.8743 \tabularnewline
74 &  0.1428 &  0.2857 &  0.8572 \tabularnewline
75 &  0.1197 &  0.2393 &  0.8803 \tabularnewline
76 &  0.1056 &  0.2112 &  0.8944 \tabularnewline
77 &  0.09026 &  0.1805 &  0.9097 \tabularnewline
78 &  0.07016 &  0.1403 &  0.9298 \tabularnewline
79 &  0.4303 &  0.8606 &  0.5697 \tabularnewline
80 &  0.3982 &  0.7964 &  0.6018 \tabularnewline
81 &  0.3469 &  0.6937 &  0.6531 \tabularnewline
82 &  0.3716 &  0.7432 &  0.6284 \tabularnewline
83 &  0.4772 &  0.9545 &  0.5228 \tabularnewline
84 &  0.4447 &  0.8895 &  0.5553 \tabularnewline
85 &  0.4011 &  0.8022 &  0.5989 \tabularnewline
86 &  0.4134 &  0.8269 &  0.5866 \tabularnewline
87 &  0.543 &  0.9139 &  0.457 \tabularnewline
88 &  0.5119 &  0.9763 &  0.4881 \tabularnewline
89 &  0.4555 &  0.9111 &  0.5445 \tabularnewline
90 &  0.513 &  0.974 &  0.487 \tabularnewline
91 &  0.4921 &  0.9841 &  0.5079 \tabularnewline
92 &  0.5864 &  0.8271 &  0.4136 \tabularnewline
93 &  0.6462 &  0.7075 &  0.3538 \tabularnewline
94 &  0.6572 &  0.6856 &  0.3428 \tabularnewline
95 &  0.6454 &  0.7092 &  0.3546 \tabularnewline
96 &  0.6181 &  0.7638 &  0.3819 \tabularnewline
97 &  0.5931 &  0.8138 &  0.4069 \tabularnewline
98 &  0.531 &  0.9381 &  0.469 \tabularnewline
99 &  0.4705 &  0.9409 &  0.5295 \tabularnewline
100 &  0.4148 &  0.8296 &  0.5852 \tabularnewline
101 &  0.3874 &  0.7749 &  0.6126 \tabularnewline
102 &  0.9232 &  0.1537 &  0.07684 \tabularnewline
103 &  0.8873 &  0.2254 &  0.1127 \tabularnewline
104 &  0.8658 &  0.2684 &  0.1342 \tabularnewline
105 &  0.8081 &  0.3837 &  0.1919 \tabularnewline
106 &  0.8247 &  0.3507 &  0.1753 \tabularnewline
107 &  0.7868 &  0.4264 &  0.2132 \tabularnewline
108 &  0.7313 &  0.5373 &  0.2687 \tabularnewline
109 &  0.7716 &  0.4568 &  0.2284 \tabularnewline
110 &  0.7884 &  0.4233 &  0.2116 \tabularnewline
111 &  0.7631 &  0.4738 &  0.2369 \tabularnewline
112 &  0.6539 &  0.6922 &  0.3461 \tabularnewline
113 &  0.8303 &  0.3394 &  0.1697 \tabularnewline
\hline
\end{tabular}
%Source: https://freestatistics.org/blog/index.php?pk=295968&T=5

[TABLE]
[ROW][C]Goldfeld-Quandt test for Heteroskedasticity[/C][/ROW]
[ROW][C]p-values[/C][C]Alternative Hypothesis[/C][/ROW]
[ROW][C]breakpoint index[/C][C]greater[/C][C]2-sided[/C][C]less[/C][/ROW]
[ROW][C]7[/C][C] 0.4853[/C][C] 0.9706[/C][C] 0.5147[/C][/ROW]
[ROW][C]8[/C][C] 0.3356[/C][C] 0.6713[/C][C] 0.6644[/C][/ROW]
[ROW][C]9[/C][C] 0.2161[/C][C] 0.4322[/C][C] 0.7839[/C][/ROW]
[ROW][C]10[/C][C] 0.1336[/C][C] 0.2671[/C][C] 0.8664[/C][/ROW]
[ROW][C]11[/C][C] 0.1184[/C][C] 0.2369[/C][C] 0.8816[/C][/ROW]
[ROW][C]12[/C][C] 0.1498[/C][C] 0.2996[/C][C] 0.8502[/C][/ROW]
[ROW][C]13[/C][C] 0.09984[/C][C] 0.1997[/C][C] 0.9002[/C][/ROW]
[ROW][C]14[/C][C] 0.06351[/C][C] 0.127[/C][C] 0.9365[/C][/ROW]
[ROW][C]15[/C][C] 0.03734[/C][C] 0.07469[/C][C] 0.9627[/C][/ROW]
[ROW][C]16[/C][C] 0.02508[/C][C] 0.05017[/C][C] 0.9749[/C][/ROW]
[ROW][C]17[/C][C] 0.02536[/C][C] 0.05073[/C][C] 0.9746[/C][/ROW]
[ROW][C]18[/C][C] 0.01532[/C][C] 0.03063[/C][C] 0.9847[/C][/ROW]
[ROW][C]19[/C][C] 0.01185[/C][C] 0.0237[/C][C] 0.9882[/C][/ROW]
[ROW][C]20[/C][C] 0.02747[/C][C] 0.05493[/C][C] 0.9725[/C][/ROW]
[ROW][C]21[/C][C] 0.01662[/C][C] 0.03323[/C][C] 0.9834[/C][/ROW]
[ROW][C]22[/C][C] 0.01251[/C][C] 0.02502[/C][C] 0.9875[/C][/ROW]
[ROW][C]23[/C][C] 0.00782[/C][C] 0.01564[/C][C] 0.9922[/C][/ROW]
[ROW][C]24[/C][C] 0.004528[/C][C] 0.009055[/C][C] 0.9955[/C][/ROW]
[ROW][C]25[/C][C] 0.003432[/C][C] 0.006863[/C][C] 0.9966[/C][/ROW]
[ROW][C]26[/C][C] 0.001959[/C][C] 0.003919[/C][C] 0.998[/C][/ROW]
[ROW][C]27[/C][C] 0.001724[/C][C] 0.003447[/C][C] 0.9983[/C][/ROW]
[ROW][C]28[/C][C] 0.00104[/C][C] 0.002081[/C][C] 0.999[/C][/ROW]
[ROW][C]29[/C][C] 0.002276[/C][C] 0.004551[/C][C] 0.9977[/C][/ROW]
[ROW][C]30[/C][C] 0.001738[/C][C] 0.003475[/C][C] 0.9983[/C][/ROW]
[ROW][C]31[/C][C] 0.001234[/C][C] 0.002467[/C][C] 0.9988[/C][/ROW]
[ROW][C]32[/C][C] 0.0007014[/C][C] 0.001403[/C][C] 0.9993[/C][/ROW]
[ROW][C]33[/C][C] 0.002764[/C][C] 0.005527[/C][C] 0.9972[/C][/ROW]
[ROW][C]34[/C][C] 0.001676[/C][C] 0.003351[/C][C] 0.9983[/C][/ROW]
[ROW][C]35[/C][C] 0.001109[/C][C] 0.002219[/C][C] 0.9989[/C][/ROW]
[ROW][C]36[/C][C] 0.000731[/C][C] 0.001462[/C][C] 0.9993[/C][/ROW]
[ROW][C]37[/C][C] 0.0004729[/C][C] 0.0009459[/C][C] 0.9995[/C][/ROW]
[ROW][C]38[/C][C] 0.0002896[/C][C] 0.0005791[/C][C] 0.9997[/C][/ROW]
[ROW][C]39[/C][C] 0.0001618[/C][C] 0.0003235[/C][C] 0.9998[/C][/ROW]
[ROW][C]40[/C][C] 9.789e-05[/C][C] 0.0001958[/C][C] 0.9999[/C][/ROW]
[ROW][C]41[/C][C] 8.34e-05[/C][C] 0.0001668[/C][C] 0.9999[/C][/ROW]
[ROW][C]42[/C][C] 5.573e-05[/C][C] 0.0001115[/C][C] 0.9999[/C][/ROW]
[ROW][C]43[/C][C] 4.616e-05[/C][C] 9.233e-05[/C][C] 1[/C][/ROW]
[ROW][C]44[/C][C] 2.616e-05[/C][C] 5.232e-05[/C][C] 1[/C][/ROW]
[ROW][C]45[/C][C] 1.493e-05[/C][C] 2.986e-05[/C][C] 1[/C][/ROW]
[ROW][C]46[/C][C] 1.086e-05[/C][C] 2.172e-05[/C][C] 1[/C][/ROW]
[ROW][C]47[/C][C] 9.837e-05[/C][C] 0.0001967[/C][C] 0.9999[/C][/ROW]
[ROW][C]48[/C][C] 0.0004186[/C][C] 0.0008373[/C][C] 0.9996[/C][/ROW]
[ROW][C]49[/C][C] 0.0002625[/C][C] 0.0005249[/C][C] 0.9997[/C][/ROW]
[ROW][C]50[/C][C] 0.03146[/C][C] 0.06292[/C][C] 0.9685[/C][/ROW]
[ROW][C]51[/C][C] 0.02503[/C][C] 0.05007[/C][C] 0.975[/C][/ROW]
[ROW][C]52[/C][C] 0.02729[/C][C] 0.05457[/C][C] 0.9727[/C][/ROW]
[ROW][C]53[/C][C] 0.0243[/C][C] 0.0486[/C][C] 0.9757[/C][/ROW]
[ROW][C]54[/C][C] 0.01799[/C][C] 0.03598[/C][C] 0.982[/C][/ROW]
[ROW][C]55[/C][C] 0.01952[/C][C] 0.03904[/C][C] 0.9805[/C][/ROW]
[ROW][C]56[/C][C] 0.01535[/C][C] 0.0307[/C][C] 0.9846[/C][/ROW]
[ROW][C]57[/C][C] 0.02374[/C][C] 0.04748[/C][C] 0.9763[/C][/ROW]
[ROW][C]58[/C][C] 0.02073[/C][C] 0.04146[/C][C] 0.9793[/C][/ROW]
[ROW][C]59[/C][C] 0.02799[/C][C] 0.05597[/C][C] 0.972[/C][/ROW]
[ROW][C]60[/C][C] 0.06254[/C][C] 0.1251[/C][C] 0.9375[/C][/ROW]
[ROW][C]61[/C][C] 0.06091[/C][C] 0.1218[/C][C] 0.9391[/C][/ROW]
[ROW][C]62[/C][C] 0.04778[/C][C] 0.09557[/C][C] 0.9522[/C][/ROW]
[ROW][C]63[/C][C] 0.03826[/C][C] 0.07653[/C][C] 0.9617[/C][/ROW]
[ROW][C]64[/C][C] 0.0289[/C][C] 0.0578[/C][C] 0.9711[/C][/ROW]
[ROW][C]65[/C][C] 0.04697[/C][C] 0.09395[/C][C] 0.953[/C][/ROW]
[ROW][C]66[/C][C] 0.05125[/C][C] 0.1025[/C][C] 0.9488[/C][/ROW]
[ROW][C]67[/C][C] 0.1405[/C][C] 0.2809[/C][C] 0.8595[/C][/ROW]
[ROW][C]68[/C][C] 0.1283[/C][C] 0.2567[/C][C] 0.8717[/C][/ROW]
[ROW][C]69[/C][C] 0.1087[/C][C] 0.2175[/C][C] 0.8913[/C][/ROW]
[ROW][C]70[/C][C] 0.089[/C][C] 0.178[/C][C] 0.911[/C][/ROW]
[ROW][C]71[/C][C] 0.08268[/C][C] 0.1654[/C][C] 0.9173[/C][/ROW]
[ROW][C]72[/C][C] 0.09015[/C][C] 0.1803[/C][C] 0.9099[/C][/ROW]
[ROW][C]73[/C][C] 0.1257[/C][C] 0.2514[/C][C] 0.8743[/C][/ROW]
[ROW][C]74[/C][C] 0.1428[/C][C] 0.2857[/C][C] 0.8572[/C][/ROW]
[ROW][C]75[/C][C] 0.1197[/C][C] 0.2393[/C][C] 0.8803[/C][/ROW]
[ROW][C]76[/C][C] 0.1056[/C][C] 0.2112[/C][C] 0.8944[/C][/ROW]
[ROW][C]77[/C][C] 0.09026[/C][C] 0.1805[/C][C] 0.9097[/C][/ROW]
[ROW][C]78[/C][C] 0.07016[/C][C] 0.1403[/C][C] 0.9298[/C][/ROW]
[ROW][C]79[/C][C] 0.4303[/C][C] 0.8606[/C][C] 0.5697[/C][/ROW]
[ROW][C]80[/C][C] 0.3982[/C][C] 0.7964[/C][C] 0.6018[/C][/ROW]
[ROW][C]81[/C][C] 0.3469[/C][C] 0.6937[/C][C] 0.6531[/C][/ROW]
[ROW][C]82[/C][C] 0.3716[/C][C] 0.7432[/C][C] 0.6284[/C][/ROW]
[ROW][C]83[/C][C] 0.4772[/C][C] 0.9545[/C][C] 0.5228[/C][/ROW]
[ROW][C]84[/C][C] 0.4447[/C][C] 0.8895[/C][C] 0.5553[/C][/ROW]
[ROW][C]85[/C][C] 0.4011[/C][C] 0.8022[/C][C] 0.5989[/C][/ROW]
[ROW][C]86[/C][C] 0.4134[/C][C] 0.8269[/C][C] 0.5866[/C][/ROW]
[ROW][C]87[/C][C] 0.543[/C][C] 0.9139[/C][C] 0.457[/C][/ROW]
[ROW][C]88[/C][C] 0.5119[/C][C] 0.9763[/C][C] 0.4881[/C][/ROW]
[ROW][C]89[/C][C] 0.4555[/C][C] 0.9111[/C][C] 0.5445[/C][/ROW]
[ROW][C]90[/C][C] 0.513[/C][C] 0.974[/C][C] 0.487[/C][/ROW]
[ROW][C]91[/C][C] 0.4921[/C][C] 0.9841[/C][C] 0.5079[/C][/ROW]
[ROW][C]92[/C][C] 0.5864[/C][C] 0.8271[/C][C] 0.4136[/C][/ROW]
[ROW][C]93[/C][C] 0.6462[/C][C] 0.7075[/C][C] 0.3538[/C][/ROW]
[ROW][C]94[/C][C] 0.6572[/C][C] 0.6856[/C][C] 0.3428[/C][/ROW]
[ROW][C]95[/C][C] 0.6454[/C][C] 0.7092[/C][C] 0.3546[/C][/ROW]
[ROW][C]96[/C][C] 0.6181[/C][C] 0.7638[/C][C] 0.3819[/C][/ROW]
[ROW][C]97[/C][C] 0.5931[/C][C] 0.8138[/C][C] 0.4069[/C][/ROW]
[ROW][C]98[/C][C] 0.531[/C][C] 0.9381[/C][C] 0.469[/C][/ROW]
[ROW][C]99[/C][C] 0.4705[/C][C] 0.9409[/C][C] 0.5295[/C][/ROW]
[ROW][C]100[/C][C] 0.4148[/C][C] 0.8296[/C][C] 0.5852[/C][/ROW]
[ROW][C]101[/C][C] 0.3874[/C][C] 0.7749[/C][C] 0.6126[/C][/ROW]
[ROW][C]102[/C][C] 0.9232[/C][C] 0.1537[/C][C] 0.07684[/C][/ROW]
[ROW][C]103[/C][C] 0.8873[/C][C] 0.2254[/C][C] 0.1127[/C][/ROW]
[ROW][C]104[/C][C] 0.8658[/C][C] 0.2684[/C][C] 0.1342[/C][/ROW]
[ROW][C]105[/C][C] 0.8081[/C][C] 0.3837[/C][C] 0.1919[/C][/ROW]
[ROW][C]106[/C][C] 0.8247[/C][C] 0.3507[/C][C] 0.1753[/C][/ROW]
[ROW][C]107[/C][C] 0.7868[/C][C] 0.4264[/C][C] 0.2132[/C][/ROW]
[ROW][C]108[/C][C] 0.7313[/C][C] 0.5373[/C][C] 0.2687[/C][/ROW]
[ROW][C]109[/C][C] 0.7716[/C][C] 0.4568[/C][C] 0.2284[/C][/ROW]
[ROW][C]110[/C][C] 0.7884[/C][C] 0.4233[/C][C] 0.2116[/C][/ROW]
[ROW][C]111[/C][C] 0.7631[/C][C] 0.4738[/C][C] 0.2369[/C][/ROW]
[ROW][C]112[/C][C] 0.6539[/C][C] 0.6922[/C][C] 0.3461[/C][/ROW]
[ROW][C]113[/C][C] 0.8303[/C][C] 0.3394[/C][C] 0.1697[/C][/ROW]
[/TABLE]
Source: https://freestatistics.org/blog/index.php?pk=295968&T=5

Globally Unique Identifier (entire table): ba.freestatistics.org/blog/index.php?pk=295968&T=5

As an alternative you can also use a QR Code:  

The GUIDs for individual cells are displayed in the table below:

Goldfeld-Quandt test for Heteroskedasticity
p-valuesAlternative Hypothesis
breakpoint indexgreater2-sidedless
7 0.4853 0.9706 0.5147
8 0.3356 0.6713 0.6644
9 0.2161 0.4322 0.7839
10 0.1336 0.2671 0.8664
11 0.1184 0.2369 0.8816
12 0.1498 0.2996 0.8502
13 0.09984 0.1997 0.9002
14 0.06351 0.127 0.9365
15 0.03734 0.07469 0.9627
16 0.02508 0.05017 0.9749
17 0.02536 0.05073 0.9746
18 0.01532 0.03063 0.9847
19 0.01185 0.0237 0.9882
20 0.02747 0.05493 0.9725
21 0.01662 0.03323 0.9834
22 0.01251 0.02502 0.9875
23 0.00782 0.01564 0.9922
24 0.004528 0.009055 0.9955
25 0.003432 0.006863 0.9966
26 0.001959 0.003919 0.998
27 0.001724 0.003447 0.9983
28 0.00104 0.002081 0.999
29 0.002276 0.004551 0.9977
30 0.001738 0.003475 0.9983
31 0.001234 0.002467 0.9988
32 0.0007014 0.001403 0.9993
33 0.002764 0.005527 0.9972
34 0.001676 0.003351 0.9983
35 0.001109 0.002219 0.9989
36 0.000731 0.001462 0.9993
37 0.0004729 0.0009459 0.9995
38 0.0002896 0.0005791 0.9997
39 0.0001618 0.0003235 0.9998
40 9.789e-05 0.0001958 0.9999
41 8.34e-05 0.0001668 0.9999
42 5.573e-05 0.0001115 0.9999
43 4.616e-05 9.233e-05 1
44 2.616e-05 5.232e-05 1
45 1.493e-05 2.986e-05 1
46 1.086e-05 2.172e-05 1
47 9.837e-05 0.0001967 0.9999
48 0.0004186 0.0008373 0.9996
49 0.0002625 0.0005249 0.9997
50 0.03146 0.06292 0.9685
51 0.02503 0.05007 0.975
52 0.02729 0.05457 0.9727
53 0.0243 0.0486 0.9757
54 0.01799 0.03598 0.982
55 0.01952 0.03904 0.9805
56 0.01535 0.0307 0.9846
57 0.02374 0.04748 0.9763
58 0.02073 0.04146 0.9793
59 0.02799 0.05597 0.972
60 0.06254 0.1251 0.9375
61 0.06091 0.1218 0.9391
62 0.04778 0.09557 0.9522
63 0.03826 0.07653 0.9617
64 0.0289 0.0578 0.9711
65 0.04697 0.09395 0.953
66 0.05125 0.1025 0.9488
67 0.1405 0.2809 0.8595
68 0.1283 0.2567 0.8717
69 0.1087 0.2175 0.8913
70 0.089 0.178 0.911
71 0.08268 0.1654 0.9173
72 0.09015 0.1803 0.9099
73 0.1257 0.2514 0.8743
74 0.1428 0.2857 0.8572
75 0.1197 0.2393 0.8803
76 0.1056 0.2112 0.8944
77 0.09026 0.1805 0.9097
78 0.07016 0.1403 0.9298
79 0.4303 0.8606 0.5697
80 0.3982 0.7964 0.6018
81 0.3469 0.6937 0.6531
82 0.3716 0.7432 0.6284
83 0.4772 0.9545 0.5228
84 0.4447 0.8895 0.5553
85 0.4011 0.8022 0.5989
86 0.4134 0.8269 0.5866
87 0.543 0.9139 0.457
88 0.5119 0.9763 0.4881
89 0.4555 0.9111 0.5445
90 0.513 0.974 0.487
91 0.4921 0.9841 0.5079
92 0.5864 0.8271 0.4136
93 0.6462 0.7075 0.3538
94 0.6572 0.6856 0.3428
95 0.6454 0.7092 0.3546
96 0.6181 0.7638 0.3819
97 0.5931 0.8138 0.4069
98 0.531 0.9381 0.469
99 0.4705 0.9409 0.5295
100 0.4148 0.8296 0.5852
101 0.3874 0.7749 0.6126
102 0.9232 0.1537 0.07684
103 0.8873 0.2254 0.1127
104 0.8658 0.2684 0.1342
105 0.8081 0.3837 0.1919
106 0.8247 0.3507 0.1753
107 0.7868 0.4264 0.2132
108 0.7313 0.5373 0.2687
109 0.7716 0.4568 0.2284
110 0.7884 0.4233 0.2116
111 0.7631 0.4738 0.2369
112 0.6539 0.6922 0.3461
113 0.8303 0.3394 0.1697


Meta Analysis of Goldfeld-Quandt test for Heteroskedasticity
Description# significant tests% significant testsOK/NOK
1% type I error level26 0.243NOK
5% type I error level370.345794NOK
10% type I error level490.457944NOK

\begin{tabular}{lllllllll}
\hline
Meta Analysis of Goldfeld-Quandt test for Heteroskedasticity \tabularnewline
Description & # significant tests & % significant tests & OK/NOK \tabularnewline
1% type I error level & 26 &  0.243 & NOK \tabularnewline
5% type I error level & 37 & 0.345794 & NOK \tabularnewline
10% type I error level & 49 & 0.457944 & NOK \tabularnewline
\hline
\end{tabular}
%Source: https://freestatistics.org/blog/index.php?pk=295968&T=6

[TABLE]
[ROW][C]Meta Analysis of Goldfeld-Quandt test for Heteroskedasticity[/C][/ROW]
[ROW][C]Description[/C][C]# significant tests[/C][C]% significant tests[/C][C]OK/NOK[/C][/ROW]
[ROW][C]1% type I error level[/C][C]26[/C][C] 0.243[/C][C]NOK[/C][/ROW]
[ROW][C]5% type I error level[/C][C]37[/C][C]0.345794[/C][C]NOK[/C][/ROW]
[ROW][C]10% type I error level[/C][C]49[/C][C]0.457944[/C][C]NOK[/C][/ROW]
[/TABLE]
Source: https://freestatistics.org/blog/index.php?pk=295968&T=6

Globally Unique Identifier (entire table): ba.freestatistics.org/blog/index.php?pk=295968&T=6

As an alternative you can also use a QR Code:  

The GUIDs for individual cells are displayed in the table below:

Meta Analysis of Goldfeld-Quandt test for Heteroskedasticity
Description# significant tests% significant testsOK/NOK
1% type I error level26 0.243NOK
5% type I error level370.345794NOK
10% type I error level490.457944NOK


Parameters (Session):
par2 = Do not include Seasonal Dummies ; par3 = Linear Trend ; par4 = 0 ; par5 = 0 ;
Parameters (R input):
par1 = ; par2 = Do not include Seasonal Dummies ; par3 = Linear Trend ; par4 = 0 ; par5 = 0 ;
R code (references can be found in the software module):
par5 <- '0'
par4 <- '0'
par3 <- 'Linear Trend'
par2 <- 'Do not include Seasonal Dummies'
par1 <- '4'
library(lattice)
library(lmtest)
n25 <- 25 #minimum number of obs. for Goldfeld-Quandt test
mywarning <- ''
par1 <- as.numeric(par1)
if(is.na(par1)) {
par1 <- 1
mywarning = 'Warning: you did not specify the column number of the endogenous series! The first column was selected by default.'
}
if (par4=='') par4 <- 0
par4 <- as.numeric(par4)
if (par5=='') par5 <- 0
par5 <- as.numeric(par5)
x <- na.omit(t(y))
k <- length(x[1,])
n <- length(x[,1])
x1 <- cbind(x[,par1], x[,1:k!=par1])
mycolnames <- c(colnames(x)[par1], colnames(x)[1:k!=par1])
colnames(x1) <- mycolnames #colnames(x)[par1]
x <- x1
if (par3 == 'First Differences'){
(n <- n -1)
x2 <- array(0, dim=c(n,k), dimnames=list(1:n, paste('(1-B)',colnames(x),sep='')))
for (i in 1:n) {
for (j in 1:k) {
x2[i,j] <- x[i+1,j] - x[i,j]
}
}
x <- x2
}
if (par3 == 'Seasonal Differences (s=12)'){
(n <- n - 12)
x2 <- array(0, dim=c(n,k), dimnames=list(1:n, paste('(1-B12)',colnames(x),sep='')))
for (i in 1:n) {
for (j in 1:k) {
x2[i,j] <- x[i+12,j] - x[i,j]
}
}
x <- x2
}
if (par3 == 'First and Seasonal Differences (s=12)'){
(n <- n -1)
x2 <- array(0, dim=c(n,k), dimnames=list(1:n, paste('(1-B)',colnames(x),sep='')))
for (i in 1:n) {
for (j in 1:k) {
x2[i,j] <- x[i+1,j] - x[i,j]
}
}
x <- x2
(n <- n - 12)
x2 <- array(0, dim=c(n,k), dimnames=list(1:n, paste('(1-B12)',colnames(x),sep='')))
for (i in 1:n) {
for (j in 1:k) {
x2[i,j] <- x[i+12,j] - x[i,j]
}
}
x <- x2
}
if(par4 > 0) {
x2 <- array(0, dim=c(n-par4,par4), dimnames=list(1:(n-par4), paste(colnames(x)[par1],'(t-',1:par4,')',sep='')))
for (i in 1:(n-par4)) {
for (j in 1:par4) {
x2[i,j] <- x[i+par4-j,par1]
}
}
x <- cbind(x[(par4+1):n,], x2)
n <- n - par4
}
if(par5 > 0) {
x2 <- array(0, dim=c(n-par5*12,par5), dimnames=list(1:(n-par5*12), paste(colnames(x)[par1],'(t-',1:par5,'s)',sep='')))
for (i in 1:(n-par5*12)) {
for (j in 1:par5) {
x2[i,j] <- x[i+par5*12-j*12,par1]
}
}
x <- cbind(x[(par5*12+1):n,], x2)
n <- n - par5*12
}
if (par2 == 'Include Monthly Dummies'){
x2 <- array(0, dim=c(n,11), dimnames=list(1:n, paste('M', seq(1:11), sep ='')))
for (i in 1:11){
x2[seq(i,n,12),i] <- 1
}
x <- cbind(x, x2)
}
if (par2 == 'Include Quarterly Dummies'){
x2 <- array(0, dim=c(n,3), dimnames=list(1:n, paste('Q', seq(1:3), sep ='')))
for (i in 1:3){
x2[seq(i,n,4),i] <- 1
}
x <- cbind(x, x2)
}
(k <- length(x[n,]))
if (par3 == 'Linear Trend'){
x <- cbind(x, c(1:n))
colnames(x)[k+1] <- 't'
}
x
(k <- length(x[n,]))
head(x)
df <- as.data.frame(x)
(mylm <- lm(df))
(mysum <- summary(mylm))
if (n > n25) {
kp3 <- k + 3
nmkm3 <- n - k - 3
gqarr <- array(NA, dim=c(nmkm3-kp3+1,3))
numgqtests <- 0
numsignificant1 <- 0
numsignificant5 <- 0
numsignificant10 <- 0
for (mypoint in kp3:nmkm3) {
j <- 0
numgqtests <- numgqtests + 1
for (myalt in c('greater', 'two.sided', 'less')) {
j <- j + 1
gqarr[mypoint-kp3+1,j] <- gqtest(mylm, point=mypoint, alternative=myalt)$p.value
}
if (gqarr[mypoint-kp3+1,2] < 0.01) numsignificant1 <- numsignificant1 + 1
if (gqarr[mypoint-kp3+1,2] < 0.05) numsignificant5 <- numsignificant5 + 1
if (gqarr[mypoint-kp3+1,2] < 0.10) numsignificant10 <- numsignificant10 + 1
}
gqarr
}
bitmap(file='test0.png')
plot(x[,1], type='l', main='Actuals and Interpolation', ylab='value of Actuals and Interpolation (dots)', xlab='time or index')
points(x[,1]-mysum$resid)
grid()
dev.off()
bitmap(file='test1.png')
plot(mysum$resid, type='b', pch=19, main='Residuals', ylab='value of Residuals', xlab='time or index')
grid()
dev.off()
bitmap(file='test2.png')
hist(mysum$resid, main='Residual Histogram', xlab='values of Residuals')
grid()
dev.off()
bitmap(file='test3.png')
densityplot(~mysum$resid,col='black',main='Residual Density Plot', xlab='values of Residuals')
dev.off()
bitmap(file='test4.png')
qqnorm(mysum$resid, main='Residual Normal Q-Q Plot')
qqline(mysum$resid)
grid()
dev.off()
(myerror <- as.ts(mysum$resid))
bitmap(file='test5.png')
dum <- cbind(lag(myerror,k=1),myerror)
dum
dum1 <- dum[2:length(myerror),]
dum1
z <- as.data.frame(dum1)
z
plot(z,main=paste('Residual Lag plot, lowess, and regression line'), ylab='values of Residuals', xlab='lagged values of Residuals')
lines(lowess(z))
abline(lm(z))
grid()
dev.off()
bitmap(file='test6.png')
acf(mysum$resid, lag.max=length(mysum$resid)/2, main='Residual Autocorrelation Function')
grid()
dev.off()
bitmap(file='test7.png')
pacf(mysum$resid, lag.max=length(mysum$resid)/2, main='Residual Partial Autocorrelation Function')
grid()
dev.off()
bitmap(file='test8.png')
opar <- par(mfrow = c(2,2), oma = c(0, 0, 1.1, 0))
plot(mylm, las = 1, sub='Residual Diagnostics')
par(opar)
dev.off()
if (n > n25) {
bitmap(file='test9.png')
plot(kp3:nmkm3,gqarr[,2], main='Goldfeld-Quandt test',ylab='2-sided p-value',xlab='breakpoint')
grid()
dev.off()
}
load(file='createtable')
a<-table.start()
a<-table.row.start(a)
a<-table.element(a, 'Multiple Linear Regression - Estimated Regression Equation', 1, TRUE)
a<-table.row.end(a)
myeq <- colnames(x)[1]
myeq <- paste(myeq, '[t] = ', sep='')
for (i in 1:k){
if (mysum$coefficients[i,1] > 0) myeq <- paste(myeq, '+', '')
myeq <- paste(myeq, signif(mysum$coefficients[i,1],6), sep=' ')
if (rownames(mysum$coefficients)[i] != '(Intercept)') {
myeq <- paste(myeq, rownames(mysum$coefficients)[i], sep='')
if (rownames(mysum$coefficients)[i] != 't') myeq <- paste(myeq, '[t]', sep='')
}
}
myeq <- paste(myeq, ' + e[t]')
a<-table.row.start(a)
a<-table.element(a, myeq)
a<-table.row.end(a)
a<-table.row.start(a)
a<-table.element(a, mywarning)
a<-table.row.end(a)
a<-table.end(a)
table.save(a,file='mytable1.tab')
a<-table.start()
a<-table.row.start(a)
a<-table.element(a,hyperlink('ols1.htm','Multiple Linear Regression - Ordinary Least Squares',''), 6, TRUE)
a<-table.row.end(a)
a<-table.row.start(a)
a<-table.element(a,'Variable',header=TRUE)
a<-table.element(a,'Parameter',header=TRUE)
a<-table.element(a,'S.D.',header=TRUE)
a<-table.element(a,'T-STAT
H0: parameter = 0',header=TRUE)
a<-table.element(a,'2-tail p-value',header=TRUE)
a<-table.element(a,'1-tail p-value',header=TRUE)
a<-table.row.end(a)
for (i in 1:k){
a<-table.row.start(a)
a<-table.element(a,rownames(mysum$coefficients)[i],header=TRUE)
a<-table.element(a,formatC(signif(mysum$coefficients[i,1],5),format='g',flag='+'))
a<-table.element(a,formatC(signif(mysum$coefficients[i,2],5),format='g',flag=' '))
a<-table.element(a,formatC(signif(mysum$coefficients[i,3],4),format='e',flag='+'))
a<-table.element(a,formatC(signif(mysum$coefficients[i,4],4),format='g',flag=' '))
a<-table.element(a,formatC(signif(mysum$coefficients[i,4]/2,4),format='g',flag=' '))
a<-table.row.end(a)
}
a<-table.end(a)
table.save(a,file='mytable2.tab')
a<-table.start()
a<-table.row.start(a)
a<-table.element(a, 'Multiple Linear Regression - Regression Statistics', 2, TRUE)
a<-table.row.end(a)
a<-table.row.start(a)
a<-table.element(a, 'Multiple R',1,TRUE)
a<-table.element(a,formatC(signif(sqrt(mysum$r.squared),6),format='g',flag=' '))
a<-table.row.end(a)
a<-table.row.start(a)
a<-table.element(a, 'R-squared',1,TRUE)
a<-table.element(a,formatC(signif(mysum$r.squared,6),format='g',flag=' '))
a<-table.row.end(a)
a<-table.row.start(a)
a<-table.element(a, 'Adjusted R-squared',1,TRUE)
a<-table.element(a,formatC(signif(mysum$adj.r.squared,6),format='g',flag=' '))
a<-table.row.end(a)
a<-table.row.start(a)
a<-table.element(a, 'F-TEST (value)',1,TRUE)
a<-table.element(a,formatC(signif(mysum$fstatistic[1],6),format='g',flag=' '))
a<-table.row.end(a)
a<-table.row.start(a)
a<-table.element(a, 'F-TEST (DF numerator)',1,TRUE)
a<-table.element(a, signif(mysum$fstatistic[2],6))
a<-table.row.end(a)
a<-table.row.start(a)
a<-table.element(a, 'F-TEST (DF denominator)',1,TRUE)
a<-table.element(a, signif(mysum$fstatistic[3],6))
a<-table.row.end(a)
a<-table.row.start(a)
a<-table.element(a, 'p-value',1,TRUE)
a<-table.element(a,formatC(signif(1-pf(mysum$fstatistic[1],mysum$fstatistic[2],mysum$fstatistic[3]),6),format='g',flag=' '))
a<-table.row.end(a)
a<-table.row.start(a)
a<-table.element(a, 'Multiple Linear Regression - Residual Statistics', 2, TRUE)
a<-table.row.end(a)
a<-table.row.start(a)
a<-table.element(a, 'Residual Standard Deviation',1,TRUE)
a<-table.element(a,formatC(signif(mysum$sigma,6),format='g',flag=' '))
a<-table.row.end(a)
a<-table.row.start(a)
a<-table.element(a, 'Sum Squared Residuals',1,TRUE)
a<-table.element(a,formatC(signif(sum(myerror*myerror),6),format='g',flag=' '))
a<-table.row.end(a)
a<-table.end(a)
table.save(a,file='mytable3.tab')
if(n < 200) {
a<-table.start()
a<-table.row.start(a)
a<-table.element(a, 'Multiple Linear Regression - Actuals, Interpolation, and Residuals', 4, TRUE)
a<-table.row.end(a)
a<-table.row.start(a)
a<-table.element(a, 'Time or Index', 1, TRUE)
a<-table.element(a, 'Actuals', 1, TRUE)
a<-table.element(a, 'Interpolation
Forecast', 1, TRUE)
a<-table.element(a, 'Residuals
Prediction Error', 1, TRUE)
a<-table.row.end(a)
for (i in 1:n) {
a<-table.row.start(a)
a<-table.element(a,i, 1, TRUE)
a<-table.element(a,formatC(signif(x[i],6),format='g',flag=' '))
a<-table.element(a,formatC(signif(x[i]-mysum$resid[i],6),format='g',flag=' '))
a<-table.element(a,formatC(signif(mysum$resid[i],6),format='g',flag=' '))
a<-table.row.end(a)
}
a<-table.end(a)
table.save(a,file='mytable4.tab')
if (n > n25) {
a<-table.start()
a<-table.row.start(a)
a<-table.element(a,'Goldfeld-Quandt test for Heteroskedasticity',4,TRUE)
a<-table.row.end(a)
a<-table.row.start(a)
a<-table.element(a,'p-values',header=TRUE)
a<-table.element(a,'Alternative Hypothesis',3,header=TRUE)
a<-table.row.end(a)
a<-table.row.start(a)
a<-table.element(a,'breakpoint index',header=TRUE)
a<-table.element(a,'greater',header=TRUE)
a<-table.element(a,'2-sided',header=TRUE)
a<-table.element(a,'less',header=TRUE)
a<-table.row.end(a)
for (mypoint in kp3:nmkm3) {
a<-table.row.start(a)
a<-table.element(a,mypoint,header=TRUE)
a<-table.element(a,formatC(signif(gqarr[mypoint-kp3+1,1],6),format='g',flag=' '))
a<-table.element(a,formatC(signif(gqarr[mypoint-kp3+1,2],6),format='g',flag=' '))
a<-table.element(a,formatC(signif(gqarr[mypoint-kp3+1,3],6),format='g',flag=' '))
a<-table.row.end(a)
}
a<-table.end(a)
table.save(a,file='mytable5.tab')
a<-table.start()
a<-table.row.start(a)
a<-table.element(a,'Meta Analysis of Goldfeld-Quandt test for Heteroskedasticity',4,TRUE)
a<-table.row.end(a)
a<-table.row.start(a)
a<-table.element(a,'Description',header=TRUE)
a<-table.element(a,'# significant tests',header=TRUE)
a<-table.element(a,'% significant tests',header=TRUE)
a<-table.element(a,'OK/NOK',header=TRUE)
a<-table.row.end(a)
a<-table.row.start(a)
a<-table.element(a,'1% type I error level',header=TRUE)
a<-table.element(a,signif(numsignificant1,6))
a<-table.element(a,formatC(signif(numsignificant1/numgqtests,6),format='g',flag=' '))
if (numsignificant1/numgqtests < 0.01) dum <- 'OK' else dum <- 'NOK'
a<-table.element(a,dum)
a<-table.row.end(a)
a<-table.row.start(a)
a<-table.element(a,'5% type I error level',header=TRUE)
a<-table.element(a,signif(numsignificant5,6))
a<-table.element(a,signif(numsignificant5/numgqtests,6))
if (numsignificant5/numgqtests < 0.05) dum <- 'OK' else dum <- 'NOK'
a<-table.element(a,dum)
a<-table.row.end(a)
a<-table.row.start(a)
a<-table.element(a,'10% type I error level',header=TRUE)
a<-table.element(a,signif(numsignificant10,6))
a<-table.element(a,signif(numsignificant10/numgqtests,6))
if (numsignificant10/numgqtests < 0.1) dum <- 'OK' else dum <- 'NOK'
a<-table.element(a,dum)
a<-table.row.end(a)
a<-table.end(a)
table.save(a,file='mytable6.tab')
}
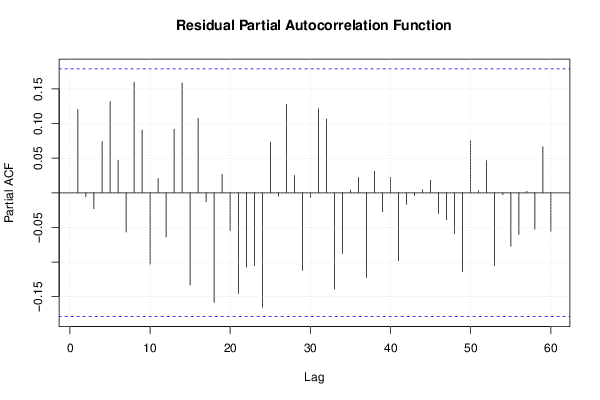
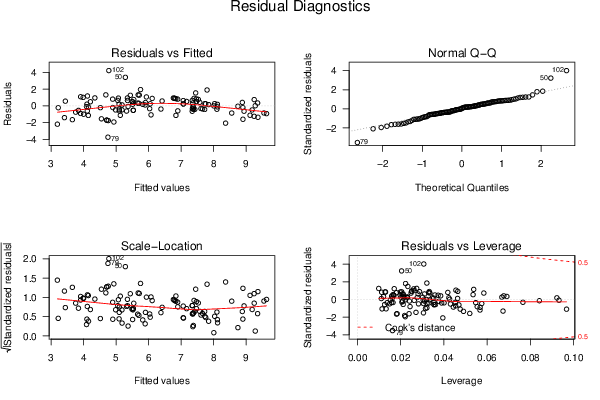
}