Free Statistics

of Irreproducible Research!

Author's title

Author*Unverified author*
R Software Modulerwasp_centraltendency.wasp
Title produced by softwareCentral Tendency
Date of computationSat, 05 Mar 2016 10:34:09 +0000
Cite this page as followsStatistical Computations at FreeStatistics.org, Office for Research Development and Education, URL https://freestatistics.org/blog/index.php?v=date/2016/Mar/05/t1457174145qoic36702hfqedz.htm/, Retrieved Sat, 27 Apr 2024 13:00:20 +0000
Statistical Computations at FreeStatistics.org, Office for Research Development and Education, URL https://freestatistics.org/blog/index.php?pk=293436, Retrieved Sat, 27 Apr 2024 13:00:20 +0000
QR Codes:

Original text written by user:
IsPrivate?No (this computation is public)
User-defined keywords
Estimated Impact94
Family? (F = Feedback message, R = changed R code, M = changed R Module, P = changed Parameters, D = changed Data)
-       [Central Tendency] [Robuustheid US Do...] [2016-03-05 10:34:09] [f41d2dc125a0429ac7ee523034b5d7c0] [Current]
Feedback Forum

Post a new message
Dataseries X:
1.4272
1.3686
1.3569
1.3406
1.2565
1.2209
1.277
1.2894
1.3067
1.3898
1.3661
1.322
1.336
1.3649
1.3999
1.4442
1.4349
1.4388
1.4264
1.4343
1.377
1.3706
1.3556
1.3179
1.2905
1.3224
1.3201
1.3162
1.2789
1.2526
1.2288
1.24
1.2856
1.2974
1.2828
1.3119
1.3288
1.3359
1.2964
1.3026
1.2982
1.3189
1.308
1.331
1.3348
1.3635
1.3493
1.3704
1.361
1.3658
1.3823
1.3812
1.3732
1.3592
1.3539
1.3316
1.2901
1.2673
1.2472
1.2331
1.1621
1.135
1.0838
1.0779
1.115
1.1213
1.0996
1.1139
1.1221
1.1235
1.0736
1.0877


Summary of computational transaction
Raw Inputview raw input (R code)
Raw Outputview raw output of R engine
Computing time2 seconds
R Server'Gwilym Jenkins' @ jenkins.wessa.net

\begin{tabular}{lllllllll}
\hline
Summary of computational transaction \tabularnewline
Raw Input & view raw input (R code)  \tabularnewline
Raw Output & view raw output of R engine  \tabularnewline
Computing time & 2 seconds \tabularnewline
R Server & 'Gwilym Jenkins' @ jenkins.wessa.net \tabularnewline
\hline
\end{tabular}
%Source: https://freestatistics.org/blog/index.php?pk=293436&T=0

[TABLE]
[ROW][C]Summary of computational transaction[/C][/ROW]
[ROW][C]Raw Input[/C][C]view raw input (R code) [/C][/ROW]
[ROW][C]Raw Output[/C][C]view raw output of R engine [/C][/ROW]
[ROW][C]Computing time[/C][C]2 seconds[/C][/ROW]
[ROW][C]R Server[/C][C]'Gwilym Jenkins' @ jenkins.wessa.net[/C][/ROW]
[/TABLE]
Source: https://freestatistics.org/blog/index.php?pk=293436&T=0

Globally Unique Identifier (entire table): ba.freestatistics.org/blog/index.php?pk=293436&T=0

As an alternative you can also use a QR Code:  

The GUIDs for individual cells are displayed in the table below:

Summary of computational transaction
Raw Inputview raw input (R code)
Raw Outputview raw output of R engine
Computing time2 seconds
R Server'Gwilym Jenkins' @ jenkins.wessa.net


Central Tendency - Ungrouped Data
MeasureValueS.E.Value/S.E.
Arithmetic Mean1.295119444444440.0115531515863096112.10096524477
Geometric Mean1.29127610409021
Harmonic Mean1.28724220527545
Quadratic Mean1.29877292953772
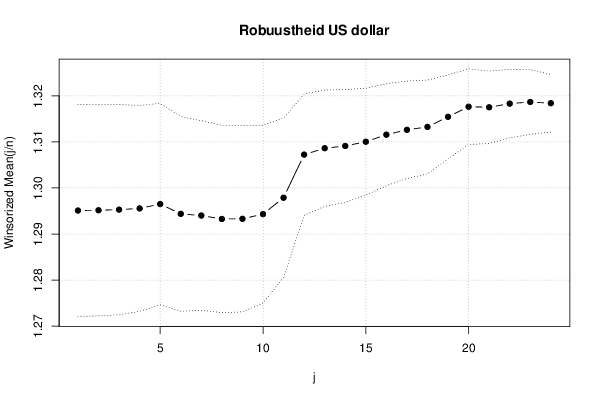
Winsorized Mean ( 1 / 24 )1.295104166666670.0115237582776432112.385572090596
Winsorized Mean ( 2 / 24 )1.295159722222220.0114619056163821112.996892974856
Winsorized Mean ( 3 / 24 )1.295297222222220.0114157019523563113.466278957542
Winsorized Mean ( 4 / 24 )1.295563888888890.0111828875084403115.852358159828
Winsorized Mean ( 5 / 24 )1.296501388888890.0109342329894827118.572687278198
Winsorized Mean ( 6 / 24 )1.294384722222220.0105720363460795122.434759004799
Winsorized Mean ( 7 / 24 )1.294015277777780.010293029202106125.71763398019
Winsorized Mean ( 8 / 24 )1.293270833333330.010165959999588127.215809759801
Winsorized Mean ( 9 / 24 )1.293308333333330.01010760469799127.9539883065
Winsorized Mean ( 10 / 24 )1.294322222222220.00966220113431033133.957284083655
Winsorized Mean ( 11 / 24 )1.297881944444440.00865202793274151150.008986856471
Winsorized Mean ( 12 / 24 )1.307248611111110.00658414566600972198.54491036851
Winsorized Mean ( 13 / 24 )1.308638888888890.00632049339520457207.04695141075
Winsorized Mean ( 14 / 24 )1.3091250.0061249904186952213.735028222115
Winsorized Mean ( 15 / 24 )1.310041666666670.0058060878652415225.63242187727
Winsorized Mean ( 16 / 24 )1.3115750.00552973741619064237.185765125087
Winsorized Mean ( 17 / 24 )1.31263750.0052938752507202247.953991704173
Winsorized Mean ( 18 / 24 )1.31326250.00509076515055204257.96957061702
Winsorized Mean ( 19 / 24 )1.315452777777780.00456228927835559288.331733811477
Winsorized Mean ( 20 / 24 )1.317647222222220.00410257847287106321.175385415628
Winsorized Mean ( 21 / 24 )1.317530555555560.00393036792354511335.218122370379
Winsorized Mean ( 22 / 24 )1.3183250.00371138266778424355.21128323506
Winsorized Mean ( 23 / 24 )1.318676388888890.00351505564252032375.150928747003
Winsorized Mean ( 24 / 24 )1.318409722222220.00313371424098307420.717915175516
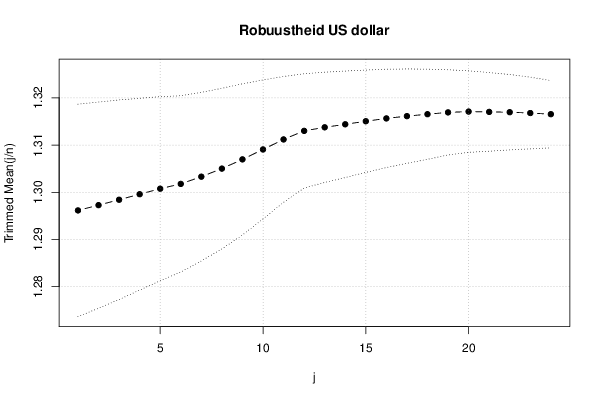
Trimmed Mean ( 1 / 24 )1.296154285714290.0112468532862991115.245949486445
Trimmed Mean ( 2 / 24 )1.297266176470590.0109159949035126118.840855820952
Trimmed Mean ( 3 / 24 )1.298415151515150.0105588609354289122.96924445311
Trimmed Mean ( 4 / 24 )1.2995843750.0101493935571113128.045519930541
Trimmed Mean ( 5 / 24 )1.300751612903230.00974249517725701133.513190331335
Trimmed Mean ( 6 / 24 )1.301771666666670.00933085583290129139.512568833882
Trimmed Mean ( 7 / 24 )1.30330.00892872462404224145.967095512233
Trimmed Mean ( 8 / 24 )1.305005357142860.0085050067071455153.439662316369
Trimmed Mean ( 9 / 24 )1.306961111111110.00799975646758372163.375112280871
Trimmed Mean ( 10 / 24 )1.309061538461540.00736256795498356177.799586566188
Trimmed Mean ( 11 / 24 )1.3111840.00665842253794978196.921116454669
Trimmed Mean ( 12 / 24 )1.312997916666670.00604320253619463217.268560635311
Trimmed Mean ( 13 / 24 )1.313747826086960.00583856472596059225.012119887189
Trimmed Mean ( 14 / 24 )1.314390909090910.00563701600603006233.17139913828
Trimmed Mean ( 15 / 24 )1.315035714285710.00541837307680107242.699366700326
Trimmed Mean ( 16 / 24 )1.3156350.005207459577991252.644303867561
Trimmed Mean ( 17 / 24 )1.316115789473680.00499607602256698263.429896488538
Trimmed Mean ( 18 / 24 )1.3165250.00477050024830181275.972105958626
Trimmed Mean ( 19 / 24 )1.316908823529410.00451379420268865291.752074727951
Trimmed Mean ( 20 / 24 )1.317081250.00431309763857942305.367826181139
Trimmed Mean ( 21 / 24 )1.317013333333330.00416241456598896316.406093735745
Trimmed Mean ( 22 / 24 )1.316950.00398901766162572330.143938110136
Trimmed Mean ( 23 / 24 )1.316776923076920.00379652597349941346.837327669643
Trimmed Mean ( 24 / 24 )1.316529166666670.003565446488935369.246648562075
Median1.3184
Midrange1.2589
Midmean - Weighted Average at Xnp1.3147972972973
Midmean - Weighted Average at X(n+1)p1.316525
Midmean - Empirical Distribution Function1.3147972972973
Midmean - Empirical Distribution Function - Averaging1.316525
Midmean - Empirical Distribution Function - Interpolation1.316525
Midmean - Closest Observation1.3147972972973
Midmean - True Basic - Statistics Graphics Toolkit1.316525
Midmean - MS Excel (old versions)1.31611578947368
Number of observations72

\begin{tabular}{lllllllll}
\hline
Central Tendency - Ungrouped Data \tabularnewline
Measure & Value & S.E. & Value/S.E. \tabularnewline
Arithmetic Mean & 1.29511944444444 & 0.0115531515863096 & 112.10096524477 \tabularnewline
Geometric Mean & 1.29127610409021 &  &  \tabularnewline
Harmonic Mean & 1.28724220527545 &  &  \tabularnewline
Quadratic Mean & 1.29877292953772 &  &  \tabularnewline
Winsorized Mean ( 1 / 24 ) & 1.29510416666667 & 0.0115237582776432 & 112.385572090596 \tabularnewline
Winsorized Mean ( 2 / 24 ) & 1.29515972222222 & 0.0114619056163821 & 112.996892974856 \tabularnewline
Winsorized Mean ( 3 / 24 ) & 1.29529722222222 & 0.0114157019523563 & 113.466278957542 \tabularnewline
Winsorized Mean ( 4 / 24 ) & 1.29556388888889 & 0.0111828875084403 & 115.852358159828 \tabularnewline
Winsorized Mean ( 5 / 24 ) & 1.29650138888889 & 0.0109342329894827 & 118.572687278198 \tabularnewline
Winsorized Mean ( 6 / 24 ) & 1.29438472222222 & 0.0105720363460795 & 122.434759004799 \tabularnewline
Winsorized Mean ( 7 / 24 ) & 1.29401527777778 & 0.010293029202106 & 125.71763398019 \tabularnewline
Winsorized Mean ( 8 / 24 ) & 1.29327083333333 & 0.010165959999588 & 127.215809759801 \tabularnewline
Winsorized Mean ( 9 / 24 ) & 1.29330833333333 & 0.01010760469799 & 127.9539883065 \tabularnewline
Winsorized Mean ( 10 / 24 ) & 1.29432222222222 & 0.00966220113431033 & 133.957284083655 \tabularnewline
Winsorized Mean ( 11 / 24 ) & 1.29788194444444 & 0.00865202793274151 & 150.008986856471 \tabularnewline
Winsorized Mean ( 12 / 24 ) & 1.30724861111111 & 0.00658414566600972 & 198.54491036851 \tabularnewline
Winsorized Mean ( 13 / 24 ) & 1.30863888888889 & 0.00632049339520457 & 207.04695141075 \tabularnewline
Winsorized Mean ( 14 / 24 ) & 1.309125 & 0.0061249904186952 & 213.735028222115 \tabularnewline
Winsorized Mean ( 15 / 24 ) & 1.31004166666667 & 0.0058060878652415 & 225.63242187727 \tabularnewline
Winsorized Mean ( 16 / 24 ) & 1.311575 & 0.00552973741619064 & 237.185765125087 \tabularnewline
Winsorized Mean ( 17 / 24 ) & 1.3126375 & 0.0052938752507202 & 247.953991704173 \tabularnewline
Winsorized Mean ( 18 / 24 ) & 1.3132625 & 0.00509076515055204 & 257.96957061702 \tabularnewline
Winsorized Mean ( 19 / 24 ) & 1.31545277777778 & 0.00456228927835559 & 288.331733811477 \tabularnewline
Winsorized Mean ( 20 / 24 ) & 1.31764722222222 & 0.00410257847287106 & 321.175385415628 \tabularnewline
Winsorized Mean ( 21 / 24 ) & 1.31753055555556 & 0.00393036792354511 & 335.218122370379 \tabularnewline
Winsorized Mean ( 22 / 24 ) & 1.318325 & 0.00371138266778424 & 355.21128323506 \tabularnewline
Winsorized Mean ( 23 / 24 ) & 1.31867638888889 & 0.00351505564252032 & 375.150928747003 \tabularnewline
Winsorized Mean ( 24 / 24 ) & 1.31840972222222 & 0.00313371424098307 & 420.717915175516 \tabularnewline
Trimmed Mean ( 1 / 24 ) & 1.29615428571429 & 0.0112468532862991 & 115.245949486445 \tabularnewline
Trimmed Mean ( 2 / 24 ) & 1.29726617647059 & 0.0109159949035126 & 118.840855820952 \tabularnewline
Trimmed Mean ( 3 / 24 ) & 1.29841515151515 & 0.0105588609354289 & 122.96924445311 \tabularnewline
Trimmed Mean ( 4 / 24 ) & 1.299584375 & 0.0101493935571113 & 128.045519930541 \tabularnewline
Trimmed Mean ( 5 / 24 ) & 1.30075161290323 & 0.00974249517725701 & 133.513190331335 \tabularnewline
Trimmed Mean ( 6 / 24 ) & 1.30177166666667 & 0.00933085583290129 & 139.512568833882 \tabularnewline
Trimmed Mean ( 7 / 24 ) & 1.3033 & 0.00892872462404224 & 145.967095512233 \tabularnewline
Trimmed Mean ( 8 / 24 ) & 1.30500535714286 & 0.0085050067071455 & 153.439662316369 \tabularnewline
Trimmed Mean ( 9 / 24 ) & 1.30696111111111 & 0.00799975646758372 & 163.375112280871 \tabularnewline
Trimmed Mean ( 10 / 24 ) & 1.30906153846154 & 0.00736256795498356 & 177.799586566188 \tabularnewline
Trimmed Mean ( 11 / 24 ) & 1.311184 & 0.00665842253794978 & 196.921116454669 \tabularnewline
Trimmed Mean ( 12 / 24 ) & 1.31299791666667 & 0.00604320253619463 & 217.268560635311 \tabularnewline
Trimmed Mean ( 13 / 24 ) & 1.31374782608696 & 0.00583856472596059 & 225.012119887189 \tabularnewline
Trimmed Mean ( 14 / 24 ) & 1.31439090909091 & 0.00563701600603006 & 233.17139913828 \tabularnewline
Trimmed Mean ( 15 / 24 ) & 1.31503571428571 & 0.00541837307680107 & 242.699366700326 \tabularnewline
Trimmed Mean ( 16 / 24 ) & 1.315635 & 0.005207459577991 & 252.644303867561 \tabularnewline
Trimmed Mean ( 17 / 24 ) & 1.31611578947368 & 0.00499607602256698 & 263.429896488538 \tabularnewline
Trimmed Mean ( 18 / 24 ) & 1.316525 & 0.00477050024830181 & 275.972105958626 \tabularnewline
Trimmed Mean ( 19 / 24 ) & 1.31690882352941 & 0.00451379420268865 & 291.752074727951 \tabularnewline
Trimmed Mean ( 20 / 24 ) & 1.31708125 & 0.00431309763857942 & 305.367826181139 \tabularnewline
Trimmed Mean ( 21 / 24 ) & 1.31701333333333 & 0.00416241456598896 & 316.406093735745 \tabularnewline
Trimmed Mean ( 22 / 24 ) & 1.31695 & 0.00398901766162572 & 330.143938110136 \tabularnewline
Trimmed Mean ( 23 / 24 ) & 1.31677692307692 & 0.00379652597349941 & 346.837327669643 \tabularnewline
Trimmed Mean ( 24 / 24 ) & 1.31652916666667 & 0.003565446488935 & 369.246648562075 \tabularnewline
Median & 1.3184 &  &  \tabularnewline
Midrange & 1.2589 &  &  \tabularnewline
Midmean - Weighted Average at Xnp & 1.3147972972973 &  &  \tabularnewline
Midmean - Weighted Average at X(n+1)p & 1.316525 &  &  \tabularnewline
Midmean - Empirical Distribution Function & 1.3147972972973 &  &  \tabularnewline
Midmean - Empirical Distribution Function - Averaging & 1.316525 &  &  \tabularnewline
Midmean - Empirical Distribution Function - Interpolation & 1.316525 &  &  \tabularnewline
Midmean - Closest Observation & 1.3147972972973 &  &  \tabularnewline
Midmean - True Basic - Statistics Graphics Toolkit & 1.316525 &  &  \tabularnewline
Midmean - MS Excel (old versions) & 1.31611578947368 &  &  \tabularnewline
Number of observations & 72 &  &  \tabularnewline
\hline
\end{tabular}
%Source: https://freestatistics.org/blog/index.php?pk=293436&T=1

[TABLE]
[ROW][C]Central Tendency - Ungrouped Data[/C][/ROW]
[ROW][C]Measure[/C][C]Value[/C][C]S.E.[/C][C]Value/S.E.[/C][/ROW]
[ROW][C]Arithmetic Mean[/C][C]1.29511944444444[/C][C]0.0115531515863096[/C][C]112.10096524477[/C][/ROW]
[ROW][C]Geometric Mean[/C][C]1.29127610409021[/C][C][/C][C][/C][/ROW]
[ROW][C]Harmonic Mean[/C][C]1.28724220527545[/C][C][/C][C][/C][/ROW]
[ROW][C]Quadratic Mean[/C][C]1.29877292953772[/C][C][/C][C][/C][/ROW]
[ROW][C]Winsorized Mean ( 1 / 24 )[/C][C]1.29510416666667[/C][C]0.0115237582776432[/C][C]112.385572090596[/C][/ROW]
[ROW][C]Winsorized Mean ( 2 / 24 )[/C][C]1.29515972222222[/C][C]0.0114619056163821[/C][C]112.996892974856[/C][/ROW]
[ROW][C]Winsorized Mean ( 3 / 24 )[/C][C]1.29529722222222[/C][C]0.0114157019523563[/C][C]113.466278957542[/C][/ROW]
[ROW][C]Winsorized Mean ( 4 / 24 )[/C][C]1.29556388888889[/C][C]0.0111828875084403[/C][C]115.852358159828[/C][/ROW]
[ROW][C]Winsorized Mean ( 5 / 24 )[/C][C]1.29650138888889[/C][C]0.0109342329894827[/C][C]118.572687278198[/C][/ROW]
[ROW][C]Winsorized Mean ( 6 / 24 )[/C][C]1.29438472222222[/C][C]0.0105720363460795[/C][C]122.434759004799[/C][/ROW]
[ROW][C]Winsorized Mean ( 7 / 24 )[/C][C]1.29401527777778[/C][C]0.010293029202106[/C][C]125.71763398019[/C][/ROW]
[ROW][C]Winsorized Mean ( 8 / 24 )[/C][C]1.29327083333333[/C][C]0.010165959999588[/C][C]127.215809759801[/C][/ROW]
[ROW][C]Winsorized Mean ( 9 / 24 )[/C][C]1.29330833333333[/C][C]0.01010760469799[/C][C]127.9539883065[/C][/ROW]
[ROW][C]Winsorized Mean ( 10 / 24 )[/C][C]1.29432222222222[/C][C]0.00966220113431033[/C][C]133.957284083655[/C][/ROW]
[ROW][C]Winsorized Mean ( 11 / 24 )[/C][C]1.29788194444444[/C][C]0.00865202793274151[/C][C]150.008986856471[/C][/ROW]
[ROW][C]Winsorized Mean ( 12 / 24 )[/C][C]1.30724861111111[/C][C]0.00658414566600972[/C][C]198.54491036851[/C][/ROW]
[ROW][C]Winsorized Mean ( 13 / 24 )[/C][C]1.30863888888889[/C][C]0.00632049339520457[/C][C]207.04695141075[/C][/ROW]
[ROW][C]Winsorized Mean ( 14 / 24 )[/C][C]1.309125[/C][C]0.0061249904186952[/C][C]213.735028222115[/C][/ROW]
[ROW][C]Winsorized Mean ( 15 / 24 )[/C][C]1.31004166666667[/C][C]0.0058060878652415[/C][C]225.63242187727[/C][/ROW]
[ROW][C]Winsorized Mean ( 16 / 24 )[/C][C]1.311575[/C][C]0.00552973741619064[/C][C]237.185765125087[/C][/ROW]
[ROW][C]Winsorized Mean ( 17 / 24 )[/C][C]1.3126375[/C][C]0.0052938752507202[/C][C]247.953991704173[/C][/ROW]
[ROW][C]Winsorized Mean ( 18 / 24 )[/C][C]1.3132625[/C][C]0.00509076515055204[/C][C]257.96957061702[/C][/ROW]
[ROW][C]Winsorized Mean ( 19 / 24 )[/C][C]1.31545277777778[/C][C]0.00456228927835559[/C][C]288.331733811477[/C][/ROW]
[ROW][C]Winsorized Mean ( 20 / 24 )[/C][C]1.31764722222222[/C][C]0.00410257847287106[/C][C]321.175385415628[/C][/ROW]
[ROW][C]Winsorized Mean ( 21 / 24 )[/C][C]1.31753055555556[/C][C]0.00393036792354511[/C][C]335.218122370379[/C][/ROW]
[ROW][C]Winsorized Mean ( 22 / 24 )[/C][C]1.318325[/C][C]0.00371138266778424[/C][C]355.21128323506[/C][/ROW]
[ROW][C]Winsorized Mean ( 23 / 24 )[/C][C]1.31867638888889[/C][C]0.00351505564252032[/C][C]375.150928747003[/C][/ROW]
[ROW][C]Winsorized Mean ( 24 / 24 )[/C][C]1.31840972222222[/C][C]0.00313371424098307[/C][C]420.717915175516[/C][/ROW]
[ROW][C]Trimmed Mean ( 1 / 24 )[/C][C]1.29615428571429[/C][C]0.0112468532862991[/C][C]115.245949486445[/C][/ROW]
[ROW][C]Trimmed Mean ( 2 / 24 )[/C][C]1.29726617647059[/C][C]0.0109159949035126[/C][C]118.840855820952[/C][/ROW]
[ROW][C]Trimmed Mean ( 3 / 24 )[/C][C]1.29841515151515[/C][C]0.0105588609354289[/C][C]122.96924445311[/C][/ROW]
[ROW][C]Trimmed Mean ( 4 / 24 )[/C][C]1.299584375[/C][C]0.0101493935571113[/C][C]128.045519930541[/C][/ROW]
[ROW][C]Trimmed Mean ( 5 / 24 )[/C][C]1.30075161290323[/C][C]0.00974249517725701[/C][C]133.513190331335[/C][/ROW]
[ROW][C]Trimmed Mean ( 6 / 24 )[/C][C]1.30177166666667[/C][C]0.00933085583290129[/C][C]139.512568833882[/C][/ROW]
[ROW][C]Trimmed Mean ( 7 / 24 )[/C][C]1.3033[/C][C]0.00892872462404224[/C][C]145.967095512233[/C][/ROW]
[ROW][C]Trimmed Mean ( 8 / 24 )[/C][C]1.30500535714286[/C][C]0.0085050067071455[/C][C]153.439662316369[/C][/ROW]
[ROW][C]Trimmed Mean ( 9 / 24 )[/C][C]1.30696111111111[/C][C]0.00799975646758372[/C][C]163.375112280871[/C][/ROW]
[ROW][C]Trimmed Mean ( 10 / 24 )[/C][C]1.30906153846154[/C][C]0.00736256795498356[/C][C]177.799586566188[/C][/ROW]
[ROW][C]Trimmed Mean ( 11 / 24 )[/C][C]1.311184[/C][C]0.00665842253794978[/C][C]196.921116454669[/C][/ROW]
[ROW][C]Trimmed Mean ( 12 / 24 )[/C][C]1.31299791666667[/C][C]0.00604320253619463[/C][C]217.268560635311[/C][/ROW]
[ROW][C]Trimmed Mean ( 13 / 24 )[/C][C]1.31374782608696[/C][C]0.00583856472596059[/C][C]225.012119887189[/C][/ROW]
[ROW][C]Trimmed Mean ( 14 / 24 )[/C][C]1.31439090909091[/C][C]0.00563701600603006[/C][C]233.17139913828[/C][/ROW]
[ROW][C]Trimmed Mean ( 15 / 24 )[/C][C]1.31503571428571[/C][C]0.00541837307680107[/C][C]242.699366700326[/C][/ROW]
[ROW][C]Trimmed Mean ( 16 / 24 )[/C][C]1.315635[/C][C]0.005207459577991[/C][C]252.644303867561[/C][/ROW]
[ROW][C]Trimmed Mean ( 17 / 24 )[/C][C]1.31611578947368[/C][C]0.00499607602256698[/C][C]263.429896488538[/C][/ROW]
[ROW][C]Trimmed Mean ( 18 / 24 )[/C][C]1.316525[/C][C]0.00477050024830181[/C][C]275.972105958626[/C][/ROW]
[ROW][C]Trimmed Mean ( 19 / 24 )[/C][C]1.31690882352941[/C][C]0.00451379420268865[/C][C]291.752074727951[/C][/ROW]
[ROW][C]Trimmed Mean ( 20 / 24 )[/C][C]1.31708125[/C][C]0.00431309763857942[/C][C]305.367826181139[/C][/ROW]
[ROW][C]Trimmed Mean ( 21 / 24 )[/C][C]1.31701333333333[/C][C]0.00416241456598896[/C][C]316.406093735745[/C][/ROW]
[ROW][C]Trimmed Mean ( 22 / 24 )[/C][C]1.31695[/C][C]0.00398901766162572[/C][C]330.143938110136[/C][/ROW]
[ROW][C]Trimmed Mean ( 23 / 24 )[/C][C]1.31677692307692[/C][C]0.00379652597349941[/C][C]346.837327669643[/C][/ROW]
[ROW][C]Trimmed Mean ( 24 / 24 )[/C][C]1.31652916666667[/C][C]0.003565446488935[/C][C]369.246648562075[/C][/ROW]
[ROW][C]Median[/C][C]1.3184[/C][C][/C][C][/C][/ROW]
[ROW][C]Midrange[/C][C]1.2589[/C][C][/C][C][/C][/ROW]
[ROW][C]Midmean - Weighted Average at Xnp[/C][C]1.3147972972973[/C][C][/C][C][/C][/ROW]
[ROW][C]Midmean - Weighted Average at X(n+1)p[/C][C]1.316525[/C][C][/C][C][/C][/ROW]
[ROW][C]Midmean - Empirical Distribution Function[/C][C]1.3147972972973[/C][C][/C][C][/C][/ROW]
[ROW][C]Midmean - Empirical Distribution Function - Averaging[/C][C]1.316525[/C][C][/C][C][/C][/ROW]
[ROW][C]Midmean - Empirical Distribution Function - Interpolation[/C][C]1.316525[/C][C][/C][C][/C][/ROW]
[ROW][C]Midmean - Closest Observation[/C][C]1.3147972972973[/C][C][/C][C][/C][/ROW]
[ROW][C]Midmean - True Basic - Statistics Graphics Toolkit[/C][C]1.316525[/C][C][/C][C][/C][/ROW]
[ROW][C]Midmean - MS Excel (old versions)[/C][C]1.31611578947368[/C][C][/C][C][/C][/ROW]
[ROW][C]Number of observations[/C][C]72[/C][C][/C][C][/C][/ROW]
[/TABLE]
Source: https://freestatistics.org/blog/index.php?pk=293436&T=1

Globally Unique Identifier (entire table): ba.freestatistics.org/blog/index.php?pk=293436&T=1

As an alternative you can also use a QR Code:  

The GUIDs for individual cells are displayed in the table below:

Central Tendency - Ungrouped Data
MeasureValueS.E.Value/S.E.
Arithmetic Mean1.295119444444440.0115531515863096112.10096524477
Geometric Mean1.29127610409021
Harmonic Mean1.28724220527545
Quadratic Mean1.29877292953772
Winsorized Mean ( 1 / 24 )1.295104166666670.0115237582776432112.385572090596
Winsorized Mean ( 2 / 24 )1.295159722222220.0114619056163821112.996892974856
Winsorized Mean ( 3 / 24 )1.295297222222220.0114157019523563113.466278957542
Winsorized Mean ( 4 / 24 )1.295563888888890.0111828875084403115.852358159828
Winsorized Mean ( 5 / 24 )1.296501388888890.0109342329894827118.572687278198
Winsorized Mean ( 6 / 24 )1.294384722222220.0105720363460795122.434759004799
Winsorized Mean ( 7 / 24 )1.294015277777780.010293029202106125.71763398019
Winsorized Mean ( 8 / 24 )1.293270833333330.010165959999588127.215809759801
Winsorized Mean ( 9 / 24 )1.293308333333330.01010760469799127.9539883065
Winsorized Mean ( 10 / 24 )1.294322222222220.00966220113431033133.957284083655
Winsorized Mean ( 11 / 24 )1.297881944444440.00865202793274151150.008986856471
Winsorized Mean ( 12 / 24 )1.307248611111110.00658414566600972198.54491036851
Winsorized Mean ( 13 / 24 )1.308638888888890.00632049339520457207.04695141075
Winsorized Mean ( 14 / 24 )1.3091250.0061249904186952213.735028222115
Winsorized Mean ( 15 / 24 )1.310041666666670.0058060878652415225.63242187727
Winsorized Mean ( 16 / 24 )1.3115750.00552973741619064237.185765125087
Winsorized Mean ( 17 / 24 )1.31263750.0052938752507202247.953991704173
Winsorized Mean ( 18 / 24 )1.31326250.00509076515055204257.96957061702
Winsorized Mean ( 19 / 24 )1.315452777777780.00456228927835559288.331733811477
Winsorized Mean ( 20 / 24 )1.317647222222220.00410257847287106321.175385415628
Winsorized Mean ( 21 / 24 )1.317530555555560.00393036792354511335.218122370379
Winsorized Mean ( 22 / 24 )1.3183250.00371138266778424355.21128323506
Winsorized Mean ( 23 / 24 )1.318676388888890.00351505564252032375.150928747003
Winsorized Mean ( 24 / 24 )1.318409722222220.00313371424098307420.717915175516
Trimmed Mean ( 1 / 24 )1.296154285714290.0112468532862991115.245949486445
Trimmed Mean ( 2 / 24 )1.297266176470590.0109159949035126118.840855820952
Trimmed Mean ( 3 / 24 )1.298415151515150.0105588609354289122.96924445311
Trimmed Mean ( 4 / 24 )1.2995843750.0101493935571113128.045519930541
Trimmed Mean ( 5 / 24 )1.300751612903230.00974249517725701133.513190331335
Trimmed Mean ( 6 / 24 )1.301771666666670.00933085583290129139.512568833882
Trimmed Mean ( 7 / 24 )1.30330.00892872462404224145.967095512233
Trimmed Mean ( 8 / 24 )1.305005357142860.0085050067071455153.439662316369
Trimmed Mean ( 9 / 24 )1.306961111111110.00799975646758372163.375112280871
Trimmed Mean ( 10 / 24 )1.309061538461540.00736256795498356177.799586566188
Trimmed Mean ( 11 / 24 )1.3111840.00665842253794978196.921116454669
Trimmed Mean ( 12 / 24 )1.312997916666670.00604320253619463217.268560635311
Trimmed Mean ( 13 / 24 )1.313747826086960.00583856472596059225.012119887189
Trimmed Mean ( 14 / 24 )1.314390909090910.00563701600603006233.17139913828
Trimmed Mean ( 15 / 24 )1.315035714285710.00541837307680107242.699366700326
Trimmed Mean ( 16 / 24 )1.3156350.005207459577991252.644303867561
Trimmed Mean ( 17 / 24 )1.316115789473680.00499607602256698263.429896488538
Trimmed Mean ( 18 / 24 )1.3165250.00477050024830181275.972105958626
Trimmed Mean ( 19 / 24 )1.316908823529410.00451379420268865291.752074727951
Trimmed Mean ( 20 / 24 )1.317081250.00431309763857942305.367826181139
Trimmed Mean ( 21 / 24 )1.317013333333330.00416241456598896316.406093735745
Trimmed Mean ( 22 / 24 )1.316950.00398901766162572330.143938110136
Trimmed Mean ( 23 / 24 )1.316776923076920.00379652597349941346.837327669643
Trimmed Mean ( 24 / 24 )1.316529166666670.003565446488935369.246648562075
Median1.3184
Midrange1.2589
Midmean - Weighted Average at Xnp1.3147972972973
Midmean - Weighted Average at X(n+1)p1.316525
Midmean - Empirical Distribution Function1.3147972972973
Midmean - Empirical Distribution Function - Averaging1.316525
Midmean - Empirical Distribution Function - Interpolation1.316525
Midmean - Closest Observation1.3147972972973
Midmean - True Basic - Statistics Graphics Toolkit1.316525
Midmean - MS Excel (old versions)1.31611578947368
Number of observations72


Parameters (Session):
Parameters (R input):
R code (references can be found in the software module):
geomean <- function(x) {
return(exp(mean(log(x))))
}
harmean <- function(x) {
return(1/mean(1/x))
}
quamean <- function(x) {
return(sqrt(mean(x*x)))
}
winmean <- function(x) {
x <-sort(x[!is.na(x)])
n<-length(x)
denom <- 3
nodenom <- n/denom
if (nodenom>40) denom <- n/40
sqrtn = sqrt(n)
roundnodenom = floor(nodenom)
win <- array(NA,dim=c(roundnodenom,2))
for (j in 1:roundnodenom) {
win[j,1] <- (j*x[j+1]+sum(x[(j+1):(n-j)])+j*x[n-j])/n
win[j,2] <- sd(c(rep(x[j+1],j),x[(j+1):(n-j)],rep(x[n-j],j)))/sqrtn
}
return(win)
}
trimean <- function(x) {
x <-sort(x[!is.na(x)])
n<-length(x)
denom <- 3
nodenom <- n/denom
if (nodenom>40) denom <- n/40
sqrtn = sqrt(n)
roundnodenom = floor(nodenom)
tri <- array(NA,dim=c(roundnodenom,2))
for (j in 1:roundnodenom) {
tri[j,1] <- mean(x,trim=j/n)
tri[j,2] <- sd(x[(j+1):(n-j)]) / sqrt(n-j*2)
}
return(tri)
}
midrange <- function(x) {
return((max(x)+min(x))/2)
}
q1 <- function(data,n,p,i,f) {
np <- n*p;
i <<- floor(np)
f <<- np - i
qvalue <- (1-f)*data[i] + f*data[i+1]
}
q2 <- function(data,n,p,i,f) {
np <- (n+1)*p
i <<- floor(np)
f <<- np - i
qvalue <- (1-f)*data[i] + f*data[i+1]
}
q3 <- function(data,n,p,i,f) {
np <- n*p
i <<- floor(np)
f <<- np - i
if (f==0) {
qvalue <- data[i]
} else {
qvalue <- data[i+1]
}
}
q4 <- function(data,n,p,i,f) {
np <- n*p
i <<- floor(np)
f <<- np - i
if (f==0) {
qvalue <- (data[i]+data[i+1])/2
} else {
qvalue <- data[i+1]
}
}
q5 <- function(data,n,p,i,f) {
np <- (n-1)*p
i <<- floor(np)
f <<- np - i
if (f==0) {
qvalue <- data[i+1]
} else {
qvalue <- data[i+1] + f*(data[i+2]-data[i+1])
}
}
q6 <- function(data,n,p,i,f) {
np <- n*p+0.5
i <<- floor(np)
f <<- np - i
qvalue <- data[i]
}
q7 <- function(data,n,p,i,f) {
np <- (n+1)*p
i <<- floor(np)
f <<- np - i
if (f==0) {
qvalue <- data[i]
} else {
qvalue <- f*data[i] + (1-f)*data[i+1]
}
}
q8 <- function(data,n,p,i,f) {
np <- (n+1)*p
i <<- floor(np)
f <<- np - i
if (f==0) {
qvalue <- data[i]
} else {
if (f == 0.5) {
qvalue <- (data[i]+data[i+1])/2
} else {
if (f < 0.5) {
qvalue <- data[i]
} else {
qvalue <- data[i+1]
}
}
}
}
midmean <- function(x,def) {
x <-sort(x[!is.na(x)])
n<-length(x)
if (def==1) {
qvalue1 <- q1(x,n,0.25,i,f)
qvalue3 <- q1(x,n,0.75,i,f)
}
if (def==2) {
qvalue1 <- q2(x,n,0.25,i,f)
qvalue3 <- q2(x,n,0.75,i,f)
}
if (def==3) {
qvalue1 <- q3(x,n,0.25,i,f)
qvalue3 <- q3(x,n,0.75,i,f)
}
if (def==4) {
qvalue1 <- q4(x,n,0.25,i,f)
qvalue3 <- q4(x,n,0.75,i,f)
}
if (def==5) {
qvalue1 <- q5(x,n,0.25,i,f)
qvalue3 <- q5(x,n,0.75,i,f)
}
if (def==6) {
qvalue1 <- q6(x,n,0.25,i,f)
qvalue3 <- q6(x,n,0.75,i,f)
}
if (def==7) {
qvalue1 <- q7(x,n,0.25,i,f)
qvalue3 <- q7(x,n,0.75,i,f)
}
if (def==8) {
qvalue1 <- q8(x,n,0.25,i,f)
qvalue3 <- q8(x,n,0.75,i,f)
}
midm <- 0
myn <- 0
roundno4 <- round(n/4)
round3no4 <- round(3*n/4)
for (i in 1:n) {
if ((x[i]>=qvalue1) & (x[i]<=qvalue3)){
midm = midm + x[i]
myn = myn + 1
}
}
midm = midm / myn
return(midm)
}
(arm <- mean(x))
sqrtn <- sqrt(length(x))
(armse <- sd(x) / sqrtn)
(armose <- arm / armse)
(geo <- geomean(x))
(har <- harmean(x))
(qua <- quamean(x))
(win <- winmean(x))
(tri <- trimean(x))
(midr <- midrange(x))
midm <- array(NA,dim=8)
for (j in 1:8) midm[j] <- midmean(x,j)
midm
bitmap(file='test1.png')
lb <- win[,1] - 2*win[,2]
ub <- win[,1] + 2*win[,2]
if ((ylimmin == '') | (ylimmax == '')) plot(win[,1],type='b',main=main, xlab='j', pch=19, ylab='Winsorized Mean(j/n)', ylim=c(min(lb),max(ub))) else plot(win[,1],type='l',main=main, xlab='j', pch=19, ylab='Winsorized Mean(j/n)', ylim=c(ylimmin,ylimmax))
lines(ub,lty=3)
lines(lb,lty=3)
grid()
dev.off()
bitmap(file='test2.png')
lb <- tri[,1] - 2*tri[,2]
ub <- tri[,1] + 2*tri[,2]
if ((ylimmin == '') | (ylimmax == '')) plot(tri[,1],type='b',main=main, xlab='j', pch=19, ylab='Trimmed Mean(j/n)', ylim=c(min(lb),max(ub))) else plot(tri[,1],type='l',main=main, xlab='j', pch=19, ylab='Trimmed Mean(j/n)', ylim=c(ylimmin,ylimmax))
lines(ub,lty=3)
lines(lb,lty=3)
grid()
dev.off()
load(file='createtable')
a<-table.start()
a<-table.row.start(a)
a<-table.element(a,'Central Tendency - Ungrouped Data',4,TRUE)
a<-table.row.end(a)
a<-table.row.start(a)
a<-table.element(a,'Measure',header=TRUE)
a<-table.element(a,'Value',header=TRUE)
a<-table.element(a,'S.E.',header=TRUE)
a<-table.element(a,'Value/S.E.',header=TRUE)
a<-table.row.end(a)
a<-table.row.start(a)
a<-table.element(a,hyperlink('arithmetic_mean.htm', 'Arithmetic Mean', 'click to view the definition of the Arithmetic Mean'),header=TRUE)
a<-table.element(a,arm)
a<-table.element(a,hyperlink('arithmetic_mean_standard_error.htm', armse, 'click to view the definition of the Standard Error of the Arithmetic Mean'))
a<-table.element(a,armose)
a<-table.row.end(a)
a<-table.row.start(a)
a<-table.element(a,hyperlink('geometric_mean.htm', 'Geometric Mean', 'click to view the definition of the Geometric Mean'),header=TRUE)
a<-table.element(a,geo)
a<-table.element(a,'')
a<-table.row.end(a)
a<-table.row.start(a)
a<-table.element(a,hyperlink('harmonic_mean.htm', 'Harmonic Mean', 'click to view the definition of the Harmonic Mean'),header=TRUE)
a<-table.element(a,har)
a<-table.element(a,'')
a<-table.row.end(a)
a<-table.row.start(a)
a<-table.element(a,hyperlink('quadratic_mean.htm', 'Quadratic Mean', 'click to view the definition of the Quadratic Mean'),header=TRUE)
a<-table.element(a,qua)
a<-table.element(a,'')
a<-table.row.end(a)
for (j in 1:length(win[,1])) {
a<-table.row.start(a)
mylabel <- paste('Winsorized Mean (',j)
mylabel <- paste(mylabel,'/')
mylabel <- paste(mylabel,length(win[,1]))
mylabel <- paste(mylabel,')')
a<-table.element(a,hyperlink('winsorized_mean.htm', mylabel, 'click to view the definition of the Winsorized Mean'),header=TRUE)
a<-table.element(a,win[j,1])
a<-table.element(a,win[j,2])
a<-table.element(a,win[j,1]/win[j,2])
a<-table.row.end(a)
}
for (j in 1:length(tri[,1])) {
a<-table.row.start(a)
mylabel <- paste('Trimmed Mean (',j)
mylabel <- paste(mylabel,'/')
mylabel <- paste(mylabel,length(tri[,1]))
mylabel <- paste(mylabel,')')
a<-table.element(a,hyperlink('arithmetic_mean.htm', mylabel, 'click to view the definition of the Trimmed Mean'),header=TRUE)
a<-table.element(a,tri[j,1])
a<-table.element(a,tri[j,2])
a<-table.element(a,tri[j,1]/tri[j,2])
a<-table.row.end(a)
}
a<-table.row.start(a)
a<-table.element(a,hyperlink('median_1.htm', 'Median', 'click to view the definition of the Median'),header=TRUE)
a<-table.element(a,median(x))
a<-table.element(a,'')
a<-table.row.end(a)
a<-table.row.start(a)
a<-table.element(a,hyperlink('midrange.htm', 'Midrange', 'click to view the definition of the Midrange'),header=TRUE)
a<-table.element(a,midr)
a<-table.element(a,'')
a<-table.row.end(a)
a<-table.row.start(a)
mymid <- hyperlink('midmean.htm', 'Midmean', 'click to view the definition of the Midmean')
mylabel <- paste(mymid,hyperlink('method_1.htm','Weighted Average at Xnp',''),sep=' - ')
a<-table.element(a,mylabel,header=TRUE)
a<-table.element(a,midm[1])
a<-table.element(a,'')
a<-table.row.end(a)
a<-table.row.start(a)
mymid <- hyperlink('midmean.htm', 'Midmean', 'click to view the definition of the Midmean')
mylabel <- paste(mymid,hyperlink('method_2.htm','Weighted Average at X(n+1)p',''),sep=' - ')
a<-table.element(a,mylabel,header=TRUE)
a<-table.element(a,midm[2])
a<-table.element(a,'')
a<-table.row.end(a)
a<-table.row.start(a)
mymid <- hyperlink('midmean.htm', 'Midmean', 'click to view the definition of the Midmean')
mylabel <- paste(mymid,hyperlink('method_3.htm','Empirical Distribution Function',''),sep=' - ')
a<-table.element(a,mylabel,header=TRUE)
a<-table.element(a,midm[3])
a<-table.element(a,'')
a<-table.row.end(a)
a<-table.row.start(a)
mymid <- hyperlink('midmean.htm', 'Midmean', 'click to view the definition of the Midmean')
mylabel <- paste(mymid,hyperlink('method_4.htm','Empirical Distribution Function - Averaging',''),sep=' - ')
a<-table.element(a,mylabel,header=TRUE)
a<-table.element(a,midm[4])
a<-table.element(a,'')
a<-table.row.end(a)
a<-table.row.start(a)
mymid <- hyperlink('midmean.htm', 'Midmean', 'click to view the definition of the Midmean')
mylabel <- paste(mymid,hyperlink('method_5.htm','Empirical Distribution Function - Interpolation',''),sep=' - ')
a<-table.element(a,mylabel,header=TRUE)
a<-table.element(a,midm[5])
a<-table.element(a,'')
a<-table.row.end(a)
a<-table.row.start(a)
mymid <- hyperlink('midmean.htm', 'Midmean', 'click to view the definition of the Midmean')
mylabel <- paste(mymid,hyperlink('method_6.htm','Closest Observation',''),sep=' - ')
a<-table.element(a,mylabel,header=TRUE)
a<-table.element(a,midm[6])
a<-table.element(a,'')
a<-table.row.end(a)
a<-table.row.start(a)
mymid <- hyperlink('midmean.htm', 'Midmean', 'click to view the definition of the Midmean')
mylabel <- paste(mymid,hyperlink('method_7.htm','True Basic - Statistics Graphics Toolkit',''),sep=' - ')
a<-table.element(a,mylabel,header=TRUE)
a<-table.element(a,midm[7])
a<-table.element(a,'')
a<-table.row.end(a)
a<-table.row.start(a)
mymid <- hyperlink('midmean.htm', 'Midmean', 'click to view the definition of the Midmean')
mylabel <- paste(mymid,hyperlink('method_8.htm','MS Excel (old versions)',''),sep=' - ')
a<-table.element(a,mylabel,header=TRUE)
a<-table.element(a,midm[8])
a<-table.element(a,'')
a<-table.row.end(a)
a<-table.row.start(a)
a<-table.element(a,'Number of observations',header=TRUE)
a<-table.element(a,length(x))
a<-table.element(a,'')
a<-table.row.end(a)
a<-table.end(a)
table.save(a,file='mytable.tab')