Free Statistics

of Irreproducible Research!

Author's title

Author*Unverified author*
R Software Modulerwasp_centraltendency.wasp
Title produced by softwareCentral Tendency
Date of computationSat, 05 Mar 2016 15:45:39 +0000
Cite this page as followsStatistical Computations at FreeStatistics.org, Office for Research Development and Education, URL https://freestatistics.org/blog/index.php?v=date/2016/Mar/05/t14571928199z4zzgcc239yuuz.htm/, Retrieved Sat, 27 Apr 2024 07:01:31 +0000
Statistical Computations at FreeStatistics.org, Office for Research Development and Education, URL https://freestatistics.org/blog/index.php?pk=293493, Retrieved Sat, 27 Apr 2024 07:01:31 +0000
QR Codes:

Original text written by user:
IsPrivate?No (this computation is public)
User-defined keywords
Estimated Impact60
Family? (F = Feedback message, R = changed R code, M = changed R Module, P = changed Parameters, D = changed Data)
-       [Central Tendency] [central tendency] [2016-03-05 15:45:39] [50e1ac7d003038f762f5217b1e15faa4] [Current]
Feedback Forum

Post a new message
Dataseries X:
16489042
16495231
16501683
16506782
16513615
16520661
16528400
16538542
16554596
16562317
16568499
16574989
16578604
16585167
16588947
16593973
16599333
16606135
16611675
16624215
16638805
16648268
16654119
16655799
16661142
16669012
16673931
16676905
16681513
16686550
16690580
16703472
16719078
16725328
16729674
16730348
16731280
16735690
16737631
16739764
16742830
16744696
16746558
16758167
16772610
16778726
16781377
16779575
16781367
16783870
16784986
16785783
16788992
16792122
16795289
16805879
16820076
16825762
16829252
16829289
16833919
16840299
16844980
16849473
16853737
16857811
16859859
16870851
16887455
16895020
16900158
16900726
16903174
16907715
16910467
16913766
16917152
16922460
16924725
16937725
16957605
16967706
16976281
16980049
16980049


Summary of computational transaction
Raw Inputview raw input (R code)
Raw Outputview raw output of R engine
Computing time1 seconds
R Server'Gertrude Mary Cox' @ cox.wessa.net

\begin{tabular}{lllllllll}
\hline
Summary of computational transaction \tabularnewline
Raw Input & view raw input (R code)  \tabularnewline
Raw Output & view raw output of R engine  \tabularnewline
Computing time & 1 seconds \tabularnewline
R Server & 'Gertrude Mary Cox' @ cox.wessa.net \tabularnewline
\hline
\end{tabular}
%Source: https://freestatistics.org/blog/index.php?pk=293493&T=0

[TABLE]
[ROW][C]Summary of computational transaction[/C][/ROW]
[ROW][C]Raw Input[/C][C]view raw input (R code) [/C][/ROW]
[ROW][C]Raw Output[/C][C]view raw output of R engine [/C][/ROW]
[ROW][C]Computing time[/C][C]1 seconds[/C][/ROW]
[ROW][C]R Server[/C][C]'Gertrude Mary Cox' @ cox.wessa.net[/C][/ROW]
[/TABLE]
Source: https://freestatistics.org/blog/index.php?pk=293493&T=0

Globally Unique Identifier (entire table): ba.freestatistics.org/blog/index.php?pk=293493&T=0

As an alternative you can also use a QR Code:  

The GUIDs for individual cells are displayed in the table below:

Summary of computational transaction
Raw Inputview raw input (R code)
Raw Outputview raw output of R engine
Computing time1 seconds
R Server'Gertrude Mary Cox' @ cox.wessa.net


Central Tendency - Ungrouped Data
MeasureValueS.E.Value/S.E.
Arithmetic Mean16745313.682352914687.71341992831140.08989715396
Geometric Mean16744772.116451
Harmonic Mean16744230.0762231
Quadratic Mean16745854.7572269
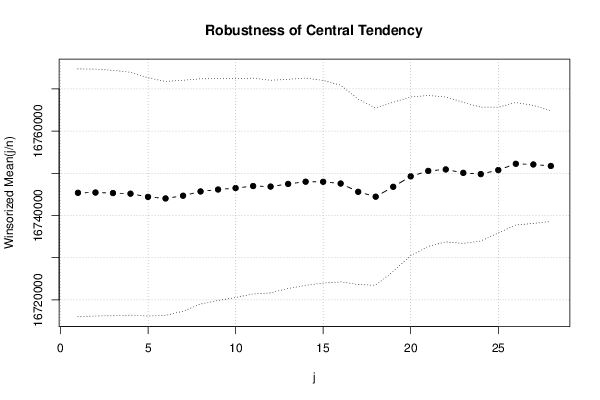
Winsorized Mean ( 1 / 28 )16745386.494117614672.76221523491141.25658471659
Winsorized Mean ( 2 / 28 )16745449.647058814625.52504402371144.94690595066
Winsorized Mean ( 3 / 28 )16745326.964705914534.08993413661152.14141653106
Winsorized Mean ( 4 / 28 )16745173.176470614386.78880790051163.92708616637
Winsorized Mean ( 5 / 28 )16744418.235294114109.73314014751186.7282016589
Winsorized Mean ( 6 / 28 )16744046.870588213861.50844410081207.95272304683
Winsorized Mean ( 7 / 28 )16744695.564705913680.33052895131223.99787996858
Winsorized Mean ( 8 / 28 )16745706.952941213338.99213471551255.39521905553
Winsorized Mean ( 9 / 28 )16746165.952941213146.573765531273.80458601687
Winsorized Mean ( 10 / 28 )16746505.129411812967.93740470831291.37769614245
Winsorized Mean ( 11 / 28 )16746988.870588212778.54555010591310.55516489899
Winsorized Mean ( 12 / 28 )16746858.141176512601.75883233731328.93022029612
Winsorized Mean ( 13 / 28 )16747487.494117612388.47916198571351.85984293437
Winsorized Mean ( 14 / 28 )16748016.529411812278.12034676911364.05378481397
Winsorized Mean ( 15 / 28 )16747996.764705912009.04339977891394.61539168176
Winsorized Mean ( 16 / 28 )16747581.705882411650.01663792011437.55860840318
Winsorized Mean ( 17 / 28 )16745621.305882410981.00841627861524.96206824303
Winsorized Mean ( 18 / 28 )16744466.764705910493.42408208911595.71047864981
Winsorized Mean ( 19 / 28 )16746812.035294110017.7786340961671.70913303031
Winsorized Mean ( 20 / 28 )16749286.38823539400.622262333171781.72103088825
Winsorized Mean ( 21 / 28 )16750570.84705888938.6313311431873.95253551831
Winsorized Mean ( 22 / 28 )16750922.32941188581.273474773321952.03222210026
Winsorized Mean ( 23 / 28 )16750110.29411768356.181144324082004.51737520017
Winsorized Mean ( 24 / 28 )16749817.49411767924.750002924892113.60831419736
Winsorized Mean ( 25 / 28 )16750770.43529417447.742521177132249.10708012052
Winsorized Mean ( 26 / 28 )16752263.75294127251.228257435442310.26567613057
Winsorized Mean ( 27 / 28 )16752099.84705886990.386313996482396.44836416508
Winsorized Mean ( 28 / 28 )16751744.74117656562.879106043862552.49936354146
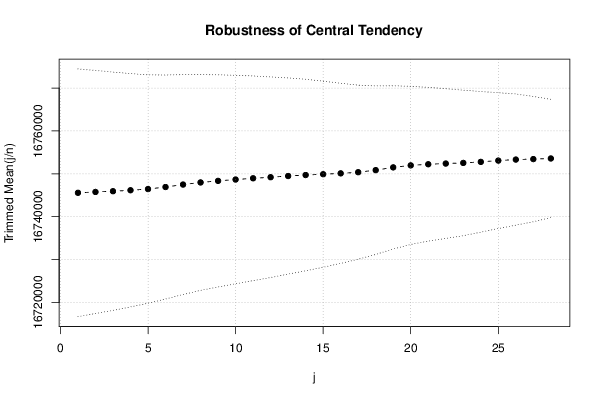
Trimmed Mean ( 1 / 28 )16745573.156626514441.93077804521159.51069244033
Trimmed Mean ( 2 / 28 )16745769.03703714174.12587416741181.43222274867
Trimmed Mean ( 3 / 28 )16745940.860759513891.7885243281205.45607438762
Trimmed Mean ( 4 / 28 )16746166.753246813602.43229285361231.11561173106
Trimmed Mean ( 5 / 28 )16746448.266666713315.17267389411257.6966650609
Trimmed Mean ( 6 / 28 )16746921.013698613059.38408218291282.36683355892
Trimmed Mean ( 7 / 28 )16747494.492957712821.39092980941306.21510447983
Trimmed Mean ( 8 / 28 )16747987.05797112581.51487071331331.15822936046
Trimmed Mean ( 9 / 28 )16748348.64179112370.47074540841353.89743741221
Trimmed Mean ( 10 / 28 )16748665.784615412155.98757026391377.81201961626
Trimmed Mean ( 11 / 28 )16748957.301587311931.59762185471403.74808407122
Trimmed Mean ( 12 / 28 )16749206.655737711695.09253952851432.15682980932
Trimmed Mean ( 13 / 28 )16749488.610169511439.12935022011464.2275733902
Trimmed Mean ( 14 / 28 )16749718.157894711164.97318432231500.20227378732
Trimmed Mean ( 15 / 28 )1674990610846.68949622921544.24131029315
Trimmed Mean ( 16 / 28 )16750110.132075510503.42256925751594.72876784958
Trimmed Mean ( 17 / 28 )16750373.509803910144.95378937371651.10397322352
Trimmed Mean ( 18 / 28 )16750858.42857149826.624757947331704.64008153197
Trimmed Mean ( 19 / 28 )16751500.61702139517.562345793281760.06208400887
Trimmed Mean ( 20 / 28 )16751966.73333339220.346685751821816.84781541025
Trimmed Mean ( 21 / 28 )16752231.65116288965.403767677131868.54179524624
Trimmed Mean ( 22 / 28 )16752395.60975618726.8189247271919.64514839297
Trimmed Mean ( 23 / 28 )16752541.56410268483.813764871561974.64749090425
Trimmed Mean ( 24 / 28 )16752784.40540548201.86471889512042.55800108615
Trimmed Mean ( 25 / 28 )16753084.62857147918.710501412852115.63292098914
Trimmed Mean ( 26 / 28 )16753323.06060617646.481309872782190.98463485093
Trimmed Mean ( 27 / 28 )16753434.77419357308.430269909422292.34379414845
Trimmed Mean ( 28 / 28 )16753579.68965526893.417056299252430.37372508104
Median16746558
Midrange16734545.5
Midmean - Weighted Average at Xnp16749916.3809524
Midmean - Weighted Average at X(n+1)p16752231.6511628
Midmean - Empirical Distribution Function16752231.6511628
Midmean - Empirical Distribution Function - Averaging16752231.6511628
Midmean - Empirical Distribution Function - Interpolation16752231.6511628
Midmean - Closest Observation16749653.7727273
Midmean - True Basic - Statistics Graphics Toolkit16752231.6511628
Midmean - MS Excel (old versions)16752231.6511628
Number of observations85

\begin{tabular}{lllllllll}
\hline
Central Tendency - Ungrouped Data \tabularnewline
Measure & Value & S.E. & Value/S.E. \tabularnewline
Arithmetic Mean & 16745313.6823529 & 14687.7134199283 & 1140.08989715396 \tabularnewline
Geometric Mean & 16744772.116451 &  &  \tabularnewline
Harmonic Mean & 16744230.0762231 &  &  \tabularnewline
Quadratic Mean & 16745854.7572269 &  &  \tabularnewline
Winsorized Mean ( 1 / 28 ) & 16745386.4941176 & 14672.7622152349 & 1141.25658471659 \tabularnewline
Winsorized Mean ( 2 / 28 ) & 16745449.6470588 & 14625.5250440237 & 1144.94690595066 \tabularnewline
Winsorized Mean ( 3 / 28 ) & 16745326.9647059 & 14534.0899341366 & 1152.14141653106 \tabularnewline
Winsorized Mean ( 4 / 28 ) & 16745173.1764706 & 14386.7888079005 & 1163.92708616637 \tabularnewline
Winsorized Mean ( 5 / 28 ) & 16744418.2352941 & 14109.7331401475 & 1186.7282016589 \tabularnewline
Winsorized Mean ( 6 / 28 ) & 16744046.8705882 & 13861.5084441008 & 1207.95272304683 \tabularnewline
Winsorized Mean ( 7 / 28 ) & 16744695.5647059 & 13680.3305289513 & 1223.99787996858 \tabularnewline
Winsorized Mean ( 8 / 28 ) & 16745706.9529412 & 13338.9921347155 & 1255.39521905553 \tabularnewline
Winsorized Mean ( 9 / 28 ) & 16746165.9529412 & 13146.57376553 & 1273.80458601687 \tabularnewline
Winsorized Mean ( 10 / 28 ) & 16746505.1294118 & 12967.9374047083 & 1291.37769614245 \tabularnewline
Winsorized Mean ( 11 / 28 ) & 16746988.8705882 & 12778.5455501059 & 1310.55516489899 \tabularnewline
Winsorized Mean ( 12 / 28 ) & 16746858.1411765 & 12601.7588323373 & 1328.93022029612 \tabularnewline
Winsorized Mean ( 13 / 28 ) & 16747487.4941176 & 12388.4791619857 & 1351.85984293437 \tabularnewline
Winsorized Mean ( 14 / 28 ) & 16748016.5294118 & 12278.1203467691 & 1364.05378481397 \tabularnewline
Winsorized Mean ( 15 / 28 ) & 16747996.7647059 & 12009.0433997789 & 1394.61539168176 \tabularnewline
Winsorized Mean ( 16 / 28 ) & 16747581.7058824 & 11650.0166379201 & 1437.55860840318 \tabularnewline
Winsorized Mean ( 17 / 28 ) & 16745621.3058824 & 10981.0084162786 & 1524.96206824303 \tabularnewline
Winsorized Mean ( 18 / 28 ) & 16744466.7647059 & 10493.4240820891 & 1595.71047864981 \tabularnewline
Winsorized Mean ( 19 / 28 ) & 16746812.0352941 & 10017.778634096 & 1671.70913303031 \tabularnewline
Winsorized Mean ( 20 / 28 ) & 16749286.3882353 & 9400.62226233317 & 1781.72103088825 \tabularnewline
Winsorized Mean ( 21 / 28 ) & 16750570.8470588 & 8938.631331143 & 1873.95253551831 \tabularnewline
Winsorized Mean ( 22 / 28 ) & 16750922.3294118 & 8581.27347477332 & 1952.03222210026 \tabularnewline
Winsorized Mean ( 23 / 28 ) & 16750110.2941176 & 8356.18114432408 & 2004.51737520017 \tabularnewline
Winsorized Mean ( 24 / 28 ) & 16749817.4941176 & 7924.75000292489 & 2113.60831419736 \tabularnewline
Winsorized Mean ( 25 / 28 ) & 16750770.4352941 & 7447.74252117713 & 2249.10708012052 \tabularnewline
Winsorized Mean ( 26 / 28 ) & 16752263.7529412 & 7251.22825743544 & 2310.26567613057 \tabularnewline
Winsorized Mean ( 27 / 28 ) & 16752099.8470588 & 6990.38631399648 & 2396.44836416508 \tabularnewline
Winsorized Mean ( 28 / 28 ) & 16751744.7411765 & 6562.87910604386 & 2552.49936354146 \tabularnewline
Trimmed Mean ( 1 / 28 ) & 16745573.1566265 & 14441.9307780452 & 1159.51069244033 \tabularnewline
Trimmed Mean ( 2 / 28 ) & 16745769.037037 & 14174.1258741674 & 1181.43222274867 \tabularnewline
Trimmed Mean ( 3 / 28 ) & 16745940.8607595 & 13891.788524328 & 1205.45607438762 \tabularnewline
Trimmed Mean ( 4 / 28 ) & 16746166.7532468 & 13602.4322928536 & 1231.11561173106 \tabularnewline
Trimmed Mean ( 5 / 28 ) & 16746448.2666667 & 13315.1726738941 & 1257.6966650609 \tabularnewline
Trimmed Mean ( 6 / 28 ) & 16746921.0136986 & 13059.3840821829 & 1282.36683355892 \tabularnewline
Trimmed Mean ( 7 / 28 ) & 16747494.4929577 & 12821.3909298094 & 1306.21510447983 \tabularnewline
Trimmed Mean ( 8 / 28 ) & 16747987.057971 & 12581.5148707133 & 1331.15822936046 \tabularnewline
Trimmed Mean ( 9 / 28 ) & 16748348.641791 & 12370.4707454084 & 1353.89743741221 \tabularnewline
Trimmed Mean ( 10 / 28 ) & 16748665.7846154 & 12155.9875702639 & 1377.81201961626 \tabularnewline
Trimmed Mean ( 11 / 28 ) & 16748957.3015873 & 11931.5976218547 & 1403.74808407122 \tabularnewline
Trimmed Mean ( 12 / 28 ) & 16749206.6557377 & 11695.0925395285 & 1432.15682980932 \tabularnewline
Trimmed Mean ( 13 / 28 ) & 16749488.6101695 & 11439.1293502201 & 1464.2275733902 \tabularnewline
Trimmed Mean ( 14 / 28 ) & 16749718.1578947 & 11164.9731843223 & 1500.20227378732 \tabularnewline
Trimmed Mean ( 15 / 28 ) & 16749906 & 10846.6894962292 & 1544.24131029315 \tabularnewline
Trimmed Mean ( 16 / 28 ) & 16750110.1320755 & 10503.4225692575 & 1594.72876784958 \tabularnewline
Trimmed Mean ( 17 / 28 ) & 16750373.5098039 & 10144.9537893737 & 1651.10397322352 \tabularnewline
Trimmed Mean ( 18 / 28 ) & 16750858.4285714 & 9826.62475794733 & 1704.64008153197 \tabularnewline
Trimmed Mean ( 19 / 28 ) & 16751500.6170213 & 9517.56234579328 & 1760.06208400887 \tabularnewline
Trimmed Mean ( 20 / 28 ) & 16751966.7333333 & 9220.34668575182 & 1816.84781541025 \tabularnewline
Trimmed Mean ( 21 / 28 ) & 16752231.6511628 & 8965.40376767713 & 1868.54179524624 \tabularnewline
Trimmed Mean ( 22 / 28 ) & 16752395.6097561 & 8726.818924727 & 1919.64514839297 \tabularnewline
Trimmed Mean ( 23 / 28 ) & 16752541.5641026 & 8483.81376487156 & 1974.64749090425 \tabularnewline
Trimmed Mean ( 24 / 28 ) & 16752784.4054054 & 8201.8647188951 & 2042.55800108615 \tabularnewline
Trimmed Mean ( 25 / 28 ) & 16753084.6285714 & 7918.71050141285 & 2115.63292098914 \tabularnewline
Trimmed Mean ( 26 / 28 ) & 16753323.0606061 & 7646.48130987278 & 2190.98463485093 \tabularnewline
Trimmed Mean ( 27 / 28 ) & 16753434.7741935 & 7308.43026990942 & 2292.34379414845 \tabularnewline
Trimmed Mean ( 28 / 28 ) & 16753579.6896552 & 6893.41705629925 & 2430.37372508104 \tabularnewline
Median & 16746558 &  &  \tabularnewline
Midrange & 16734545.5 &  &  \tabularnewline
Midmean - Weighted Average at Xnp & 16749916.3809524 &  &  \tabularnewline
Midmean - Weighted Average at X(n+1)p & 16752231.6511628 &  &  \tabularnewline
Midmean - Empirical Distribution Function & 16752231.6511628 &  &  \tabularnewline
Midmean - Empirical Distribution Function - Averaging & 16752231.6511628 &  &  \tabularnewline
Midmean - Empirical Distribution Function - Interpolation & 16752231.6511628 &  &  \tabularnewline
Midmean - Closest Observation & 16749653.7727273 &  &  \tabularnewline
Midmean - True Basic - Statistics Graphics Toolkit & 16752231.6511628 &  &  \tabularnewline
Midmean - MS Excel (old versions) & 16752231.6511628 &  &  \tabularnewline
Number of observations & 85 &  &  \tabularnewline
\hline
\end{tabular}
%Source: https://freestatistics.org/blog/index.php?pk=293493&T=1

[TABLE]
[ROW][C]Central Tendency - Ungrouped Data[/C][/ROW]
[ROW][C]Measure[/C][C]Value[/C][C]S.E.[/C][C]Value/S.E.[/C][/ROW]
[ROW][C]Arithmetic Mean[/C][C]16745313.6823529[/C][C]14687.7134199283[/C][C]1140.08989715396[/C][/ROW]
[ROW][C]Geometric Mean[/C][C]16744772.116451[/C][C][/C][C][/C][/ROW]
[ROW][C]Harmonic Mean[/C][C]16744230.0762231[/C][C][/C][C][/C][/ROW]
[ROW][C]Quadratic Mean[/C][C]16745854.7572269[/C][C][/C][C][/C][/ROW]
[ROW][C]Winsorized Mean ( 1 / 28 )[/C][C]16745386.4941176[/C][C]14672.7622152349[/C][C]1141.25658471659[/C][/ROW]
[ROW][C]Winsorized Mean ( 2 / 28 )[/C][C]16745449.6470588[/C][C]14625.5250440237[/C][C]1144.94690595066[/C][/ROW]
[ROW][C]Winsorized Mean ( 3 / 28 )[/C][C]16745326.9647059[/C][C]14534.0899341366[/C][C]1152.14141653106[/C][/ROW]
[ROW][C]Winsorized Mean ( 4 / 28 )[/C][C]16745173.1764706[/C][C]14386.7888079005[/C][C]1163.92708616637[/C][/ROW]
[ROW][C]Winsorized Mean ( 5 / 28 )[/C][C]16744418.2352941[/C][C]14109.7331401475[/C][C]1186.7282016589[/C][/ROW]
[ROW][C]Winsorized Mean ( 6 / 28 )[/C][C]16744046.8705882[/C][C]13861.5084441008[/C][C]1207.95272304683[/C][/ROW]
[ROW][C]Winsorized Mean ( 7 / 28 )[/C][C]16744695.5647059[/C][C]13680.3305289513[/C][C]1223.99787996858[/C][/ROW]
[ROW][C]Winsorized Mean ( 8 / 28 )[/C][C]16745706.9529412[/C][C]13338.9921347155[/C][C]1255.39521905553[/C][/ROW]
[ROW][C]Winsorized Mean ( 9 / 28 )[/C][C]16746165.9529412[/C][C]13146.57376553[/C][C]1273.80458601687[/C][/ROW]
[ROW][C]Winsorized Mean ( 10 / 28 )[/C][C]16746505.1294118[/C][C]12967.9374047083[/C][C]1291.37769614245[/C][/ROW]
[ROW][C]Winsorized Mean ( 11 / 28 )[/C][C]16746988.8705882[/C][C]12778.5455501059[/C][C]1310.55516489899[/C][/ROW]
[ROW][C]Winsorized Mean ( 12 / 28 )[/C][C]16746858.1411765[/C][C]12601.7588323373[/C][C]1328.93022029612[/C][/ROW]
[ROW][C]Winsorized Mean ( 13 / 28 )[/C][C]16747487.4941176[/C][C]12388.4791619857[/C][C]1351.85984293437[/C][/ROW]
[ROW][C]Winsorized Mean ( 14 / 28 )[/C][C]16748016.5294118[/C][C]12278.1203467691[/C][C]1364.05378481397[/C][/ROW]
[ROW][C]Winsorized Mean ( 15 / 28 )[/C][C]16747996.7647059[/C][C]12009.0433997789[/C][C]1394.61539168176[/C][/ROW]
[ROW][C]Winsorized Mean ( 16 / 28 )[/C][C]16747581.7058824[/C][C]11650.0166379201[/C][C]1437.55860840318[/C][/ROW]
[ROW][C]Winsorized Mean ( 17 / 28 )[/C][C]16745621.3058824[/C][C]10981.0084162786[/C][C]1524.96206824303[/C][/ROW]
[ROW][C]Winsorized Mean ( 18 / 28 )[/C][C]16744466.7647059[/C][C]10493.4240820891[/C][C]1595.71047864981[/C][/ROW]
[ROW][C]Winsorized Mean ( 19 / 28 )[/C][C]16746812.0352941[/C][C]10017.778634096[/C][C]1671.70913303031[/C][/ROW]
[ROW][C]Winsorized Mean ( 20 / 28 )[/C][C]16749286.3882353[/C][C]9400.62226233317[/C][C]1781.72103088825[/C][/ROW]
[ROW][C]Winsorized Mean ( 21 / 28 )[/C][C]16750570.8470588[/C][C]8938.631331143[/C][C]1873.95253551831[/C][/ROW]
[ROW][C]Winsorized Mean ( 22 / 28 )[/C][C]16750922.3294118[/C][C]8581.27347477332[/C][C]1952.03222210026[/C][/ROW]
[ROW][C]Winsorized Mean ( 23 / 28 )[/C][C]16750110.2941176[/C][C]8356.18114432408[/C][C]2004.51737520017[/C][/ROW]
[ROW][C]Winsorized Mean ( 24 / 28 )[/C][C]16749817.4941176[/C][C]7924.75000292489[/C][C]2113.60831419736[/C][/ROW]
[ROW][C]Winsorized Mean ( 25 / 28 )[/C][C]16750770.4352941[/C][C]7447.74252117713[/C][C]2249.10708012052[/C][/ROW]
[ROW][C]Winsorized Mean ( 26 / 28 )[/C][C]16752263.7529412[/C][C]7251.22825743544[/C][C]2310.26567613057[/C][/ROW]
[ROW][C]Winsorized Mean ( 27 / 28 )[/C][C]16752099.8470588[/C][C]6990.38631399648[/C][C]2396.44836416508[/C][/ROW]
[ROW][C]Winsorized Mean ( 28 / 28 )[/C][C]16751744.7411765[/C][C]6562.87910604386[/C][C]2552.49936354146[/C][/ROW]
[ROW][C]Trimmed Mean ( 1 / 28 )[/C][C]16745573.1566265[/C][C]14441.9307780452[/C][C]1159.51069244033[/C][/ROW]
[ROW][C]Trimmed Mean ( 2 / 28 )[/C][C]16745769.037037[/C][C]14174.1258741674[/C][C]1181.43222274867[/C][/ROW]
[ROW][C]Trimmed Mean ( 3 / 28 )[/C][C]16745940.8607595[/C][C]13891.788524328[/C][C]1205.45607438762[/C][/ROW]
[ROW][C]Trimmed Mean ( 4 / 28 )[/C][C]16746166.7532468[/C][C]13602.4322928536[/C][C]1231.11561173106[/C][/ROW]
[ROW][C]Trimmed Mean ( 5 / 28 )[/C][C]16746448.2666667[/C][C]13315.1726738941[/C][C]1257.6966650609[/C][/ROW]
[ROW][C]Trimmed Mean ( 6 / 28 )[/C][C]16746921.0136986[/C][C]13059.3840821829[/C][C]1282.36683355892[/C][/ROW]
[ROW][C]Trimmed Mean ( 7 / 28 )[/C][C]16747494.4929577[/C][C]12821.3909298094[/C][C]1306.21510447983[/C][/ROW]
[ROW][C]Trimmed Mean ( 8 / 28 )[/C][C]16747987.057971[/C][C]12581.5148707133[/C][C]1331.15822936046[/C][/ROW]
[ROW][C]Trimmed Mean ( 9 / 28 )[/C][C]16748348.641791[/C][C]12370.4707454084[/C][C]1353.89743741221[/C][/ROW]
[ROW][C]Trimmed Mean ( 10 / 28 )[/C][C]16748665.7846154[/C][C]12155.9875702639[/C][C]1377.81201961626[/C][/ROW]
[ROW][C]Trimmed Mean ( 11 / 28 )[/C][C]16748957.3015873[/C][C]11931.5976218547[/C][C]1403.74808407122[/C][/ROW]
[ROW][C]Trimmed Mean ( 12 / 28 )[/C][C]16749206.6557377[/C][C]11695.0925395285[/C][C]1432.15682980932[/C][/ROW]
[ROW][C]Trimmed Mean ( 13 / 28 )[/C][C]16749488.6101695[/C][C]11439.1293502201[/C][C]1464.2275733902[/C][/ROW]
[ROW][C]Trimmed Mean ( 14 / 28 )[/C][C]16749718.1578947[/C][C]11164.9731843223[/C][C]1500.20227378732[/C][/ROW]
[ROW][C]Trimmed Mean ( 15 / 28 )[/C][C]16749906[/C][C]10846.6894962292[/C][C]1544.24131029315[/C][/ROW]
[ROW][C]Trimmed Mean ( 16 / 28 )[/C][C]16750110.1320755[/C][C]10503.4225692575[/C][C]1594.72876784958[/C][/ROW]
[ROW][C]Trimmed Mean ( 17 / 28 )[/C][C]16750373.5098039[/C][C]10144.9537893737[/C][C]1651.10397322352[/C][/ROW]
[ROW][C]Trimmed Mean ( 18 / 28 )[/C][C]16750858.4285714[/C][C]9826.62475794733[/C][C]1704.64008153197[/C][/ROW]
[ROW][C]Trimmed Mean ( 19 / 28 )[/C][C]16751500.6170213[/C][C]9517.56234579328[/C][C]1760.06208400887[/C][/ROW]
[ROW][C]Trimmed Mean ( 20 / 28 )[/C][C]16751966.7333333[/C][C]9220.34668575182[/C][C]1816.84781541025[/C][/ROW]
[ROW][C]Trimmed Mean ( 21 / 28 )[/C][C]16752231.6511628[/C][C]8965.40376767713[/C][C]1868.54179524624[/C][/ROW]
[ROW][C]Trimmed Mean ( 22 / 28 )[/C][C]16752395.6097561[/C][C]8726.818924727[/C][C]1919.64514839297[/C][/ROW]
[ROW][C]Trimmed Mean ( 23 / 28 )[/C][C]16752541.5641026[/C][C]8483.81376487156[/C][C]1974.64749090425[/C][/ROW]
[ROW][C]Trimmed Mean ( 24 / 28 )[/C][C]16752784.4054054[/C][C]8201.8647188951[/C][C]2042.55800108615[/C][/ROW]
[ROW][C]Trimmed Mean ( 25 / 28 )[/C][C]16753084.6285714[/C][C]7918.71050141285[/C][C]2115.63292098914[/C][/ROW]
[ROW][C]Trimmed Mean ( 26 / 28 )[/C][C]16753323.0606061[/C][C]7646.48130987278[/C][C]2190.98463485093[/C][/ROW]
[ROW][C]Trimmed Mean ( 27 / 28 )[/C][C]16753434.7741935[/C][C]7308.43026990942[/C][C]2292.34379414845[/C][/ROW]
[ROW][C]Trimmed Mean ( 28 / 28 )[/C][C]16753579.6896552[/C][C]6893.41705629925[/C][C]2430.37372508104[/C][/ROW]
[ROW][C]Median[/C][C]16746558[/C][C][/C][C][/C][/ROW]
[ROW][C]Midrange[/C][C]16734545.5[/C][C][/C][C][/C][/ROW]
[ROW][C]Midmean - Weighted Average at Xnp[/C][C]16749916.3809524[/C][C][/C][C][/C][/ROW]
[ROW][C]Midmean - Weighted Average at X(n+1)p[/C][C]16752231.6511628[/C][C][/C][C][/C][/ROW]
[ROW][C]Midmean - Empirical Distribution Function[/C][C]16752231.6511628[/C][C][/C][C][/C][/ROW]
[ROW][C]Midmean - Empirical Distribution Function - Averaging[/C][C]16752231.6511628[/C][C][/C][C][/C][/ROW]
[ROW][C]Midmean - Empirical Distribution Function - Interpolation[/C][C]16752231.6511628[/C][C][/C][C][/C][/ROW]
[ROW][C]Midmean - Closest Observation[/C][C]16749653.7727273[/C][C][/C][C][/C][/ROW]
[ROW][C]Midmean - True Basic - Statistics Graphics Toolkit[/C][C]16752231.6511628[/C][C][/C][C][/C][/ROW]
[ROW][C]Midmean - MS Excel (old versions)[/C][C]16752231.6511628[/C][C][/C][C][/C][/ROW]
[ROW][C]Number of observations[/C][C]85[/C][C][/C][C][/C][/ROW]
[/TABLE]
Source: https://freestatistics.org/blog/index.php?pk=293493&T=1

Globally Unique Identifier (entire table): ba.freestatistics.org/blog/index.php?pk=293493&T=1

As an alternative you can also use a QR Code:  

The GUIDs for individual cells are displayed in the table below:

Central Tendency - Ungrouped Data
MeasureValueS.E.Value/S.E.
Arithmetic Mean16745313.682352914687.71341992831140.08989715396
Geometric Mean16744772.116451
Harmonic Mean16744230.0762231
Quadratic Mean16745854.7572269
Winsorized Mean ( 1 / 28 )16745386.494117614672.76221523491141.25658471659
Winsorized Mean ( 2 / 28 )16745449.647058814625.52504402371144.94690595066
Winsorized Mean ( 3 / 28 )16745326.964705914534.08993413661152.14141653106
Winsorized Mean ( 4 / 28 )16745173.176470614386.78880790051163.92708616637
Winsorized Mean ( 5 / 28 )16744418.235294114109.73314014751186.7282016589
Winsorized Mean ( 6 / 28 )16744046.870588213861.50844410081207.95272304683
Winsorized Mean ( 7 / 28 )16744695.564705913680.33052895131223.99787996858
Winsorized Mean ( 8 / 28 )16745706.952941213338.99213471551255.39521905553
Winsorized Mean ( 9 / 28 )16746165.952941213146.573765531273.80458601687
Winsorized Mean ( 10 / 28 )16746505.129411812967.93740470831291.37769614245
Winsorized Mean ( 11 / 28 )16746988.870588212778.54555010591310.55516489899
Winsorized Mean ( 12 / 28 )16746858.141176512601.75883233731328.93022029612
Winsorized Mean ( 13 / 28 )16747487.494117612388.47916198571351.85984293437
Winsorized Mean ( 14 / 28 )16748016.529411812278.12034676911364.05378481397
Winsorized Mean ( 15 / 28 )16747996.764705912009.04339977891394.61539168176
Winsorized Mean ( 16 / 28 )16747581.705882411650.01663792011437.55860840318
Winsorized Mean ( 17 / 28 )16745621.305882410981.00841627861524.96206824303
Winsorized Mean ( 18 / 28 )16744466.764705910493.42408208911595.71047864981
Winsorized Mean ( 19 / 28 )16746812.035294110017.7786340961671.70913303031
Winsorized Mean ( 20 / 28 )16749286.38823539400.622262333171781.72103088825
Winsorized Mean ( 21 / 28 )16750570.84705888938.6313311431873.95253551831
Winsorized Mean ( 22 / 28 )16750922.32941188581.273474773321952.03222210026
Winsorized Mean ( 23 / 28 )16750110.29411768356.181144324082004.51737520017
Winsorized Mean ( 24 / 28 )16749817.49411767924.750002924892113.60831419736
Winsorized Mean ( 25 / 28 )16750770.43529417447.742521177132249.10708012052
Winsorized Mean ( 26 / 28 )16752263.75294127251.228257435442310.26567613057
Winsorized Mean ( 27 / 28 )16752099.84705886990.386313996482396.44836416508
Winsorized Mean ( 28 / 28 )16751744.74117656562.879106043862552.49936354146
Trimmed Mean ( 1 / 28 )16745573.156626514441.93077804521159.51069244033
Trimmed Mean ( 2 / 28 )16745769.03703714174.12587416741181.43222274867
Trimmed Mean ( 3 / 28 )16745940.860759513891.7885243281205.45607438762
Trimmed Mean ( 4 / 28 )16746166.753246813602.43229285361231.11561173106
Trimmed Mean ( 5 / 28 )16746448.266666713315.17267389411257.6966650609
Trimmed Mean ( 6 / 28 )16746921.013698613059.38408218291282.36683355892
Trimmed Mean ( 7 / 28 )16747494.492957712821.39092980941306.21510447983
Trimmed Mean ( 8 / 28 )16747987.05797112581.51487071331331.15822936046
Trimmed Mean ( 9 / 28 )16748348.64179112370.47074540841353.89743741221
Trimmed Mean ( 10 / 28 )16748665.784615412155.98757026391377.81201961626
Trimmed Mean ( 11 / 28 )16748957.301587311931.59762185471403.74808407122
Trimmed Mean ( 12 / 28 )16749206.655737711695.09253952851432.15682980932
Trimmed Mean ( 13 / 28 )16749488.610169511439.12935022011464.2275733902
Trimmed Mean ( 14 / 28 )16749718.157894711164.97318432231500.20227378732
Trimmed Mean ( 15 / 28 )1674990610846.68949622921544.24131029315
Trimmed Mean ( 16 / 28 )16750110.132075510503.42256925751594.72876784958
Trimmed Mean ( 17 / 28 )16750373.509803910144.95378937371651.10397322352
Trimmed Mean ( 18 / 28 )16750858.42857149826.624757947331704.64008153197
Trimmed Mean ( 19 / 28 )16751500.61702139517.562345793281760.06208400887
Trimmed Mean ( 20 / 28 )16751966.73333339220.346685751821816.84781541025
Trimmed Mean ( 21 / 28 )16752231.65116288965.403767677131868.54179524624
Trimmed Mean ( 22 / 28 )16752395.60975618726.8189247271919.64514839297
Trimmed Mean ( 23 / 28 )16752541.56410268483.813764871561974.64749090425
Trimmed Mean ( 24 / 28 )16752784.40540548201.86471889512042.55800108615
Trimmed Mean ( 25 / 28 )16753084.62857147918.710501412852115.63292098914
Trimmed Mean ( 26 / 28 )16753323.06060617646.481309872782190.98463485093
Trimmed Mean ( 27 / 28 )16753434.77419357308.430269909422292.34379414845
Trimmed Mean ( 28 / 28 )16753579.68965526893.417056299252430.37372508104
Median16746558
Midrange16734545.5
Midmean - Weighted Average at Xnp16749916.3809524
Midmean - Weighted Average at X(n+1)p16752231.6511628
Midmean - Empirical Distribution Function16752231.6511628
Midmean - Empirical Distribution Function - Averaging16752231.6511628
Midmean - Empirical Distribution Function - Interpolation16752231.6511628
Midmean - Closest Observation16749653.7727273
Midmean - True Basic - Statistics Graphics Toolkit16752231.6511628
Midmean - MS Excel (old versions)16752231.6511628
Number of observations85


Parameters (Session):
Parameters (R input):
R code (references can be found in the software module):
geomean <- function(x) {
return(exp(mean(log(x))))
}
harmean <- function(x) {
return(1/mean(1/x))
}
quamean <- function(x) {
return(sqrt(mean(x*x)))
}
winmean <- function(x) {
x <-sort(x[!is.na(x)])
n<-length(x)
denom <- 3
nodenom <- n/denom
if (nodenom>40) denom <- n/40
sqrtn = sqrt(n)
roundnodenom = floor(nodenom)
win <- array(NA,dim=c(roundnodenom,2))
for (j in 1:roundnodenom) {
win[j,1] <- (j*x[j+1]+sum(x[(j+1):(n-j)])+j*x[n-j])/n
win[j,2] <- sd(c(rep(x[j+1],j),x[(j+1):(n-j)],rep(x[n-j],j)))/sqrtn
}
return(win)
}
trimean <- function(x) {
x <-sort(x[!is.na(x)])
n<-length(x)
denom <- 3
nodenom <- n/denom
if (nodenom>40) denom <- n/40
sqrtn = sqrt(n)
roundnodenom = floor(nodenom)
tri <- array(NA,dim=c(roundnodenom,2))
for (j in 1:roundnodenom) {
tri[j,1] <- mean(x,trim=j/n)
tri[j,2] <- sd(x[(j+1):(n-j)]) / sqrt(n-j*2)
}
return(tri)
}
midrange <- function(x) {
return((max(x)+min(x))/2)
}
q1 <- function(data,n,p,i,f) {
np <- n*p;
i <<- floor(np)
f <<- np - i
qvalue <- (1-f)*data[i] + f*data[i+1]
}
q2 <- function(data,n,p,i,f) {
np <- (n+1)*p
i <<- floor(np)
f <<- np - i
qvalue <- (1-f)*data[i] + f*data[i+1]
}
q3 <- function(data,n,p,i,f) {
np <- n*p
i <<- floor(np)
f <<- np - i
if (f==0) {
qvalue <- data[i]
} else {
qvalue <- data[i+1]
}
}
q4 <- function(data,n,p,i,f) {
np <- n*p
i <<- floor(np)
f <<- np - i
if (f==0) {
qvalue <- (data[i]+data[i+1])/2
} else {
qvalue <- data[i+1]
}
}
q5 <- function(data,n,p,i,f) {
np <- (n-1)*p
i <<- floor(np)
f <<- np - i
if (f==0) {
qvalue <- data[i+1]
} else {
qvalue <- data[i+1] + f*(data[i+2]-data[i+1])
}
}
q6 <- function(data,n,p,i,f) {
np <- n*p+0.5
i <<- floor(np)
f <<- np - i
qvalue <- data[i]
}
q7 <- function(data,n,p,i,f) {
np <- (n+1)*p
i <<- floor(np)
f <<- np - i
if (f==0) {
qvalue <- data[i]
} else {
qvalue <- f*data[i] + (1-f)*data[i+1]
}
}
q8 <- function(data,n,p,i,f) {
np <- (n+1)*p
i <<- floor(np)
f <<- np - i
if (f==0) {
qvalue <- data[i]
} else {
if (f == 0.5) {
qvalue <- (data[i]+data[i+1])/2
} else {
if (f < 0.5) {
qvalue <- data[i]
} else {
qvalue <- data[i+1]
}
}
}
}
midmean <- function(x,def) {
x <-sort(x[!is.na(x)])
n<-length(x)
if (def==1) {
qvalue1 <- q1(x,n,0.25,i,f)
qvalue3 <- q1(x,n,0.75,i,f)
}
if (def==2) {
qvalue1 <- q2(x,n,0.25,i,f)
qvalue3 <- q2(x,n,0.75,i,f)
}
if (def==3) {
qvalue1 <- q3(x,n,0.25,i,f)
qvalue3 <- q3(x,n,0.75,i,f)
}
if (def==4) {
qvalue1 <- q4(x,n,0.25,i,f)
qvalue3 <- q4(x,n,0.75,i,f)
}
if (def==5) {
qvalue1 <- q5(x,n,0.25,i,f)
qvalue3 <- q5(x,n,0.75,i,f)
}
if (def==6) {
qvalue1 <- q6(x,n,0.25,i,f)
qvalue3 <- q6(x,n,0.75,i,f)
}
if (def==7) {
qvalue1 <- q7(x,n,0.25,i,f)
qvalue3 <- q7(x,n,0.75,i,f)
}
if (def==8) {
qvalue1 <- q8(x,n,0.25,i,f)
qvalue3 <- q8(x,n,0.75,i,f)
}
midm <- 0
myn <- 0
roundno4 <- round(n/4)
round3no4 <- round(3*n/4)
for (i in 1:n) {
if ((x[i]>=qvalue1) & (x[i]<=qvalue3)){
midm = midm + x[i]
myn = myn + 1
}
}
midm = midm / myn
return(midm)
}
(arm <- mean(x))
sqrtn <- sqrt(length(x))
(armse <- sd(x) / sqrtn)
(armose <- arm / armse)
(geo <- geomean(x))
(har <- harmean(x))
(qua <- quamean(x))
(win <- winmean(x))
(tri <- trimean(x))
(midr <- midrange(x))
midm <- array(NA,dim=8)
for (j in 1:8) midm[j] <- midmean(x,j)
midm
bitmap(file='test1.png')
lb <- win[,1] - 2*win[,2]
ub <- win[,1] + 2*win[,2]
if ((ylimmin == '') | (ylimmax == '')) plot(win[,1],type='b',main=main, xlab='j', pch=19, ylab='Winsorized Mean(j/n)', ylim=c(min(lb),max(ub))) else plot(win[,1],type='l',main=main, xlab='j', pch=19, ylab='Winsorized Mean(j/n)', ylim=c(ylimmin,ylimmax))
lines(ub,lty=3)
lines(lb,lty=3)
grid()
dev.off()
bitmap(file='test2.png')
lb <- tri[,1] - 2*tri[,2]
ub <- tri[,1] + 2*tri[,2]
if ((ylimmin == '') | (ylimmax == '')) plot(tri[,1],type='b',main=main, xlab='j', pch=19, ylab='Trimmed Mean(j/n)', ylim=c(min(lb),max(ub))) else plot(tri[,1],type='l',main=main, xlab='j', pch=19, ylab='Trimmed Mean(j/n)', ylim=c(ylimmin,ylimmax))
lines(ub,lty=3)
lines(lb,lty=3)
grid()
dev.off()
load(file='createtable')
a<-table.start()
a<-table.row.start(a)
a<-table.element(a,'Central Tendency - Ungrouped Data',4,TRUE)
a<-table.row.end(a)
a<-table.row.start(a)
a<-table.element(a,'Measure',header=TRUE)
a<-table.element(a,'Value',header=TRUE)
a<-table.element(a,'S.E.',header=TRUE)
a<-table.element(a,'Value/S.E.',header=TRUE)
a<-table.row.end(a)
a<-table.row.start(a)
a<-table.element(a,hyperlink('arithmetic_mean.htm', 'Arithmetic Mean', 'click to view the definition of the Arithmetic Mean'),header=TRUE)
a<-table.element(a,arm)
a<-table.element(a,hyperlink('arithmetic_mean_standard_error.htm', armse, 'click to view the definition of the Standard Error of the Arithmetic Mean'))
a<-table.element(a,armose)
a<-table.row.end(a)
a<-table.row.start(a)
a<-table.element(a,hyperlink('geometric_mean.htm', 'Geometric Mean', 'click to view the definition of the Geometric Mean'),header=TRUE)
a<-table.element(a,geo)
a<-table.element(a,'')
a<-table.row.end(a)
a<-table.row.start(a)
a<-table.element(a,hyperlink('harmonic_mean.htm', 'Harmonic Mean', 'click to view the definition of the Harmonic Mean'),header=TRUE)
a<-table.element(a,har)
a<-table.element(a,'')
a<-table.row.end(a)
a<-table.row.start(a)
a<-table.element(a,hyperlink('quadratic_mean.htm', 'Quadratic Mean', 'click to view the definition of the Quadratic Mean'),header=TRUE)
a<-table.element(a,qua)
a<-table.element(a,'')
a<-table.row.end(a)
for (j in 1:length(win[,1])) {
a<-table.row.start(a)
mylabel <- paste('Winsorized Mean (',j)
mylabel <- paste(mylabel,'/')
mylabel <- paste(mylabel,length(win[,1]))
mylabel <- paste(mylabel,')')
a<-table.element(a,hyperlink('winsorized_mean.htm', mylabel, 'click to view the definition of the Winsorized Mean'),header=TRUE)
a<-table.element(a,win[j,1])
a<-table.element(a,win[j,2])
a<-table.element(a,win[j,1]/win[j,2])
a<-table.row.end(a)
}
for (j in 1:length(tri[,1])) {
a<-table.row.start(a)
mylabel <- paste('Trimmed Mean (',j)
mylabel <- paste(mylabel,'/')
mylabel <- paste(mylabel,length(tri[,1]))
mylabel <- paste(mylabel,')')
a<-table.element(a,hyperlink('arithmetic_mean.htm', mylabel, 'click to view the definition of the Trimmed Mean'),header=TRUE)
a<-table.element(a,tri[j,1])
a<-table.element(a,tri[j,2])
a<-table.element(a,tri[j,1]/tri[j,2])
a<-table.row.end(a)
}
a<-table.row.start(a)
a<-table.element(a,hyperlink('median_1.htm', 'Median', 'click to view the definition of the Median'),header=TRUE)
a<-table.element(a,median(x))
a<-table.element(a,'')
a<-table.row.end(a)
a<-table.row.start(a)
a<-table.element(a,hyperlink('midrange.htm', 'Midrange', 'click to view the definition of the Midrange'),header=TRUE)
a<-table.element(a,midr)
a<-table.element(a,'')
a<-table.row.end(a)
a<-table.row.start(a)
mymid <- hyperlink('midmean.htm', 'Midmean', 'click to view the definition of the Midmean')
mylabel <- paste(mymid,hyperlink('method_1.htm','Weighted Average at Xnp',''),sep=' - ')
a<-table.element(a,mylabel,header=TRUE)
a<-table.element(a,midm[1])
a<-table.element(a,'')
a<-table.row.end(a)
a<-table.row.start(a)
mymid <- hyperlink('midmean.htm', 'Midmean', 'click to view the definition of the Midmean')
mylabel <- paste(mymid,hyperlink('method_2.htm','Weighted Average at X(n+1)p',''),sep=' - ')
a<-table.element(a,mylabel,header=TRUE)
a<-table.element(a,midm[2])
a<-table.element(a,'')
a<-table.row.end(a)
a<-table.row.start(a)
mymid <- hyperlink('midmean.htm', 'Midmean', 'click to view the definition of the Midmean')
mylabel <- paste(mymid,hyperlink('method_3.htm','Empirical Distribution Function',''),sep=' - ')
a<-table.element(a,mylabel,header=TRUE)
a<-table.element(a,midm[3])
a<-table.element(a,'')
a<-table.row.end(a)
a<-table.row.start(a)
mymid <- hyperlink('midmean.htm', 'Midmean', 'click to view the definition of the Midmean')
mylabel <- paste(mymid,hyperlink('method_4.htm','Empirical Distribution Function - Averaging',''),sep=' - ')
a<-table.element(a,mylabel,header=TRUE)
a<-table.element(a,midm[4])
a<-table.element(a,'')
a<-table.row.end(a)
a<-table.row.start(a)
mymid <- hyperlink('midmean.htm', 'Midmean', 'click to view the definition of the Midmean')
mylabel <- paste(mymid,hyperlink('method_5.htm','Empirical Distribution Function - Interpolation',''),sep=' - ')
a<-table.element(a,mylabel,header=TRUE)
a<-table.element(a,midm[5])
a<-table.element(a,'')
a<-table.row.end(a)
a<-table.row.start(a)
mymid <- hyperlink('midmean.htm', 'Midmean', 'click to view the definition of the Midmean')
mylabel <- paste(mymid,hyperlink('method_6.htm','Closest Observation',''),sep=' - ')
a<-table.element(a,mylabel,header=TRUE)
a<-table.element(a,midm[6])
a<-table.element(a,'')
a<-table.row.end(a)
a<-table.row.start(a)
mymid <- hyperlink('midmean.htm', 'Midmean', 'click to view the definition of the Midmean')
mylabel <- paste(mymid,hyperlink('method_7.htm','True Basic - Statistics Graphics Toolkit',''),sep=' - ')
a<-table.element(a,mylabel,header=TRUE)
a<-table.element(a,midm[7])
a<-table.element(a,'')
a<-table.row.end(a)
a<-table.row.start(a)
mymid <- hyperlink('midmean.htm', 'Midmean', 'click to view the definition of the Midmean')
mylabel <- paste(mymid,hyperlink('method_8.htm','MS Excel (old versions)',''),sep=' - ')
a<-table.element(a,mylabel,header=TRUE)
a<-table.element(a,midm[8])
a<-table.element(a,'')
a<-table.row.end(a)
a<-table.row.start(a)
a<-table.element(a,'Number of observations',header=TRUE)
a<-table.element(a,length(x))
a<-table.element(a,'')
a<-table.row.end(a)
a<-table.end(a)
table.save(a,file='mytable.tab')