Free Statistics
of Irreproducible Research!
Description of Statistical Computation | |||||||||||||||||||||||||||||||||
|---|---|---|---|---|---|---|---|---|---|---|---|---|---|---|---|---|---|---|---|---|---|---|---|---|---|---|---|---|---|---|---|---|---|
| Author's title | |||||||||||||||||||||||||||||||||
| Author | *Unverified author* | ||||||||||||||||||||||||||||||||
| R Software Module | rwasp_meanversusmedian.wasp | ||||||||||||||||||||||||||||||||
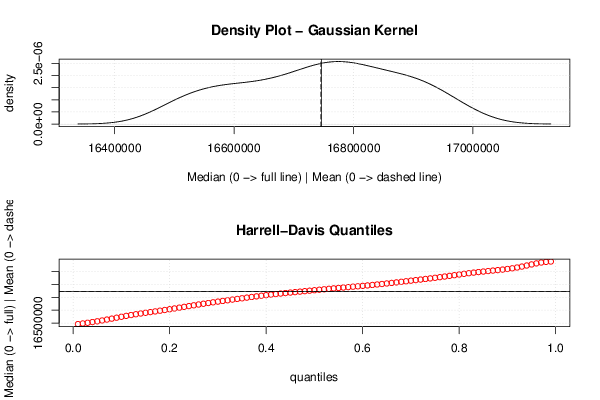
| Title produced by software | Mean versus Median | ||||||||||||||||||||||||||||||||
| Date of computation | Sat, 05 Mar 2016 16:13:59 +0000 | ||||||||||||||||||||||||||||||||
| Cite this page as follows | Statistical Computations at FreeStatistics.org, Office for Research Development and Education, URL https://freestatistics.org/blog/index.php?v=date/2016/Mar/05/t1457194504hx2sxrq574o277w.htm/, Retrieved Sat, 27 Apr 2024 07:55:28 +0000 | ||||||||||||||||||||||||||||||||
| Statistical Computations at FreeStatistics.org, Office for Research Development and Education, URL https://freestatistics.org/blog/index.php?pk=293507, Retrieved Sat, 27 Apr 2024 07:55:28 +0000 | |||||||||||||||||||||||||||||||||
| QR Codes: | |||||||||||||||||||||||||||||||||
|
| |||||||||||||||||||||||||||||||||
| Original text written by user: | |||||||||||||||||||||||||||||||||
| IsPrivate? | No (this computation is public) | ||||||||||||||||||||||||||||||||
| User-defined keywords | |||||||||||||||||||||||||||||||||
| Estimated Impact | 100 | ||||||||||||||||||||||||||||||||
Tree of Dependent Computations | |||||||||||||||||||||||||||||||||
| Family? (F = Feedback message, R = changed R code, M = changed R Module, P = changed Parameters, D = changed Data) | |||||||||||||||||||||||||||||||||
| - [Mean versus Median] [mean vs median] [2016-03-05 16:13:59] [50e1ac7d003038f762f5217b1e15faa4] [Current] | |||||||||||||||||||||||||||||||||
| Feedback Forum | |||||||||||||||||||||||||||||||||
Post a new message | |||||||||||||||||||||||||||||||||
Dataset | |||||||||||||||||||||||||||||||||
| Dataseries X: | |||||||||||||||||||||||||||||||||
16489042 16495231 16501683 16506782 16513615 16520661 16528400 16538542 16554596 16562317 16568499 16574989 16578604 16585167 16588947 16593973 16599333 16606135 16611675 16624215 16638805 16648268 16654119 16655799 16661142 16669012 16673931 16676905 16681513 16686550 16690580 16703472 16719078 16725328 16729674 16730348 16731280 16735690 16737631 16739764 16742830 16744696 16746558 16758167 16772610 16778726 16781377 16779575 16781367 16783870 16784986 16785783 16788992 16792122 16795289 16805879 16820076 16825762 16829252 16829289 16833919 16840299 16844980 16849473 16853737 16857811 16859859 16870851 16887455 16895020 16900158 16900726 16903174 16907715 16910467 16913766 16917152 16922460 16924725 16937725 16957605 16967706 16976281 16980049 16980049 | |||||||||||||||||||||||||||||||||
Tables (Output of Computation) | |||||||||||||||||||||||||||||||||
| |||||||||||||||||||||||||||||||||
Figures (Output of Computation) | |||||||||||||||||||||||||||||||||
Input Parameters & R Code | |||||||||||||||||||||||||||||||||
| Parameters (Session): | |||||||||||||||||||||||||||||||||
| Parameters (R input): | |||||||||||||||||||||||||||||||||
| R code (references can be found in the software module): | |||||||||||||||||||||||||||||||||
library(Hmisc) | |||||||||||||||||||||||||||||||||