Free Statistics
of Irreproducible Research!
Description of Statistical Computation | |||||||||||||||||||||||||||||||||
|---|---|---|---|---|---|---|---|---|---|---|---|---|---|---|---|---|---|---|---|---|---|---|---|---|---|---|---|---|---|---|---|---|---|
| Author's title | |||||||||||||||||||||||||||||||||
| Author | *Unverified author* | ||||||||||||||||||||||||||||||||
| R Software Module | rwasp_meanversusmedian.wasp | ||||||||||||||||||||||||||||||||
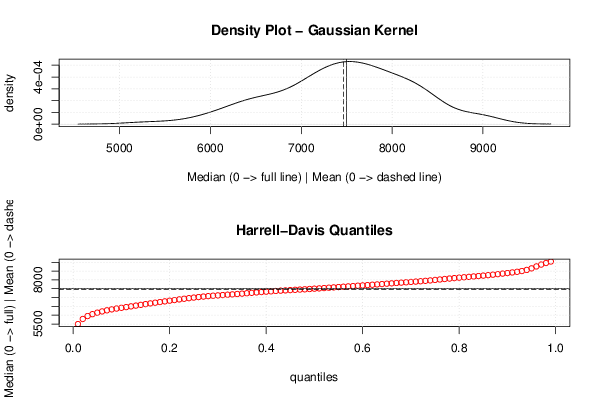
| Title produced by software | Mean versus Median | ||||||||||||||||||||||||||||||||
| Date of computation | Sat, 05 Mar 2016 17:11:27 +0000 | ||||||||||||||||||||||||||||||||
| Cite this page as follows | Statistical Computations at FreeStatistics.org, Office for Research Development and Education, URL https://freestatistics.org/blog/index.php?v=date/2016/Mar/05/t1457197907jzbrq6ulv7nzqzr.htm/, Retrieved Sat, 27 Apr 2024 07:42:55 +0000 | ||||||||||||||||||||||||||||||||
| Statistical Computations at FreeStatistics.org, Office for Research Development and Education, URL https://freestatistics.org/blog/index.php?pk=293518, Retrieved Sat, 27 Apr 2024 07:42:55 +0000 | |||||||||||||||||||||||||||||||||
| QR Codes: | |||||||||||||||||||||||||||||||||
|
| |||||||||||||||||||||||||||||||||
| Original text written by user: | |||||||||||||||||||||||||||||||||
| IsPrivate? | No (this computation is public) | ||||||||||||||||||||||||||||||||
| User-defined keywords | |||||||||||||||||||||||||||||||||
| Estimated Impact | 78 | ||||||||||||||||||||||||||||||||
Tree of Dependent Computations | |||||||||||||||||||||||||||||||||
| Family? (F = Feedback message, R = changed R code, M = changed R Module, P = changed Parameters, D = changed Data) | |||||||||||||||||||||||||||||||||
| - [Mean versus Median] [] [2016-03-05 17:11:27] [3e335ee00fe90bc89d5a716289abc4a1] [Current] | |||||||||||||||||||||||||||||||||
| Feedback Forum | |||||||||||||||||||||||||||||||||
Post a new message | |||||||||||||||||||||||||||||||||
Dataset | |||||||||||||||||||||||||||||||||
| Dataseries X: | |||||||||||||||||||||||||||||||||
7612 7381 6978 6819 6688 6454 6679 6921 7807 7898 7832 7384 7620 7281 6929 6587 6071 5928 5964 6374 7160 7213 6890 6525 6739 6580 6391 6254 6114 5978 6315 6427 7132 7292 7708 7525 7450 7526 7263 7070 6893 6781 7188 7015 8273 8470 8230 8137 8122 8367 8141 7750 7504 7330 7608 7647 8942 8865 8320 8207 8105 8290 8162 8051 7699 7440 7656 7549 9086 8942 8764 8500 8239 8443 8349 8288 7970 7496 7745 7543 9036 9075 8859 8605 8419 8495 8284 7582 7691 7046 7442 7596 8597 8436 7881 7477 7508 7361 7299 6914 6768 6746 7052 7139 7714 7750 7622 7424 7444 7208 7128 7022 6688 6199 6400 6474 7182 7330 7410 7442 7753 7762 7814 7838 7298 7155 7076 7450 8216 8246 8335 8171 8485 8435 8369 8210 7888 8061 8139 7837 8943 8523 8104 7969 7921 7930 7706 7552 7379 6946 7128 7393 8092 8004 7903 7710 7867 7860 7723 7477 7126 7161 7162 7406 7944 8084 8088 7972 8184 7914 7845 7610 7278 6883 7123 7182 7912 7893 7671 7403 7663 7589 7450 7069 6670 6285 6506 6539 7291 7391 7126 6752 6835 6664 6562 6174 5741 5398 5203 5673 6379 6418 6272 6059 | |||||||||||||||||||||||||||||||||
Tables (Output of Computation) | |||||||||||||||||||||||||||||||||
| |||||||||||||||||||||||||||||||||
Figures (Output of Computation) | |||||||||||||||||||||||||||||||||
Input Parameters & R Code | |||||||||||||||||||||||||||||||||
| Parameters (Session): | |||||||||||||||||||||||||||||||||
| Parameters (R input): | |||||||||||||||||||||||||||||||||
| R code (references can be found in the software module): | |||||||||||||||||||||||||||||||||
library(Hmisc) | |||||||||||||||||||||||||||||||||