Free Statistics

of Irreproducible Research!

Author's title

Author*Unverified author*
R Software Modulerwasp_centraltendency.wasp
Title produced by softwareCentral Tendency
Date of computationMon, 07 Mar 2016 14:42:27 +0000
Cite this page as followsStatistical Computations at FreeStatistics.org, Office for Research Development and Education, URL https://freestatistics.org/blog/index.php?v=date/2016/Mar/07/t1457361878khr6hv2dxc9deju.htm/, Retrieved Wed, 01 May 2024 11:06:39 +0000
Statistical Computations at FreeStatistics.org, Office for Research Development and Education, URL https://freestatistics.org/blog/index.php?pk=293577, Retrieved Wed, 01 May 2024 11:06:39 +0000
QR Codes:

Original text written by user:
IsPrivate?No (this computation is public)
User-defined keywords
Estimated Impact107
Family? (F = Feedback message, R = changed R code, M = changed R Module, P = changed Parameters, D = changed Data)
-       [Central Tendency] [Uitvoer België] [2016-03-07 14:42:27] [30ac29e28bcab64021946a7872e1db5d] [Current]
Feedback Forum

Post a new message
Dataseries X:
13566,7
13941,5
14964,1
14086
13505,1
15300,4
14725,2
12484,9
16082,6
15915,8
15916,1
15713
14746
15253,2
18384,3
16848,5
16485,5
19257,1
17093,4
15700,1
19124,3
18640,8
18439,2
17106,3
18347,7
19372,7
22263,8
19422,9
21268,6
20310
19256
17535,9
19857,4
19628,4
19727,5
18112,2
18889,3
20516,1
22317
19768,8
20015,8
20260,5
19434,3
17910
19134,4
20880,1
19680
17493,4
19087,8
19064,6
21191
20503,9
20364,1
19860,4
20924,1
17018,8
20607,4
21500,2
19868,3
18801,9
19787,5
19936,2
21047,6
21034,4
20132,8
20725,3
20827,8
16992,3
21818,2
21841,4
19252,2
17933,7


Summary of computational transaction
Raw Inputview raw input (R code)
Raw Outputview raw output of R engine
Computing time1 seconds
R Server'Sir Ronald Aylmer Fisher' @ fisher.wessa.net

\begin{tabular}{lllllllll}
\hline
Summary of computational transaction \tabularnewline
Raw Input & view raw input (R code)  \tabularnewline
Raw Output & view raw output of R engine  \tabularnewline
Computing time & 1 seconds \tabularnewline
R Server & 'Sir Ronald Aylmer Fisher' @ fisher.wessa.net \tabularnewline
\hline
\end{tabular}
%Source: https://freestatistics.org/blog/index.php?pk=293577&T=0

[TABLE]
[ROW][C]Summary of computational transaction[/C][/ROW]
[ROW][C]Raw Input[/C][C]view raw input (R code) [/C][/ROW]
[ROW][C]Raw Output[/C][C]view raw output of R engine [/C][/ROW]
[ROW][C]Computing time[/C][C]1 seconds[/C][/ROW]
[ROW][C]R Server[/C][C]'Sir Ronald Aylmer Fisher' @ fisher.wessa.net[/C][/ROW]
[/TABLE]
Source: https://freestatistics.org/blog/index.php?pk=293577&T=0

Globally Unique Identifier (entire table): ba.freestatistics.org/blog/index.php?pk=293577&T=0

As an alternative you can also use a QR Code:  

The GUIDs for individual cells are displayed in the table below:

Summary of computational transaction
Raw Inputview raw input (R code)
Raw Outputview raw output of R engine
Computing time1 seconds
R Server'Sir Ronald Aylmer Fisher' @ fisher.wessa.net


Central Tendency - Ungrouped Data
MeasureValueS.E.Value/S.E.
Arithmetic Mean18538.9555555556279.02339687747166.4422975385705
Geometric Mean18378.573560446
Harmonic Mean18206.3690366824
Quadratic Mean18687.4426037171
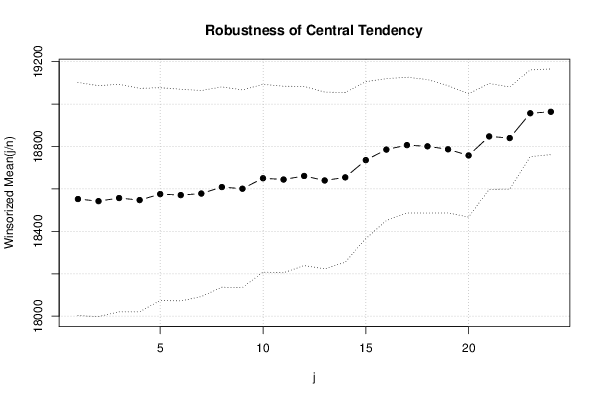
Winsorized Mean ( 1 / 24 )18552.3861111111274.8829265471867.4919550084419
Winsorized Mean ( 2 / 24 )18542.3638888889272.3243180171668.0892695294309
Winsorized Mean ( 3 / 24 )18557.0138888889268.25660808801369.1763532729099
Winsorized Mean ( 4 / 24 )18547.375263.41810718527970.4104026795487
Winsorized Mean ( 5 / 24 )18575.6805555556250.82594886139274.0580495753275
Winsorized Mean ( 6 / 24 )18570.9472222222249.48420946933574.4373652413654
Winsorized Mean ( 7 / 24 )18578.2097222222242.94304679764576.471460974541
Winsorized Mean ( 8 / 24 )18608.8652777778236.15017060282378.8009817239376
Winsorized Mean ( 9 / 24 )18600.9777777778233.00565721018379.8305843750341
Winsorized Mean ( 10 / 24 )18650.3805555556221.38723325581784.2432523378831
Winsorized Mean ( 11 / 24 )18644.3611111111219.89176928159884.7888084762041
Winsorized Mean ( 12 / 24 )18661.0777777778211.25330563129688.3350805896847
Winsorized Mean ( 13 / 24 )18639.8444444444208.36257641606189.4586963026611
Winsorized Mean ( 14 / 24 )18654.4666666667200.10695174368793.2224817984375
Winsorized Mean ( 15 / 24 )18735.8625184.964669927611101.294276941281
Winsorized Mean ( 16 / 24 )18785.4625167.302516795549112.284398703677
Winsorized Mean ( 17 / 24 )18806.6416666667160.130403196811117.445789751444
Winsorized Mean ( 18 / 24 )18800.8916666667157.447549265644119.410506891701
Winsorized Mean ( 19 / 24 )18786.8791666667149.981593927288125.261231560019
Winsorized Mean ( 20 / 24 )18757.9625145.374653002753129.031864307492
Winsorized Mean ( 21 / 24 )18847.65124.846030745079150.967154402247
Winsorized Mean ( 22 / 24 )18839.8888888889120.340039390141156.555448912644
Winsorized Mean ( 23 / 24 )18956.8694444444102.25552398574185.387240762544
Winsorized Mean ( 24 / 24 )18963.7694444444100.993980216933187.771285018282
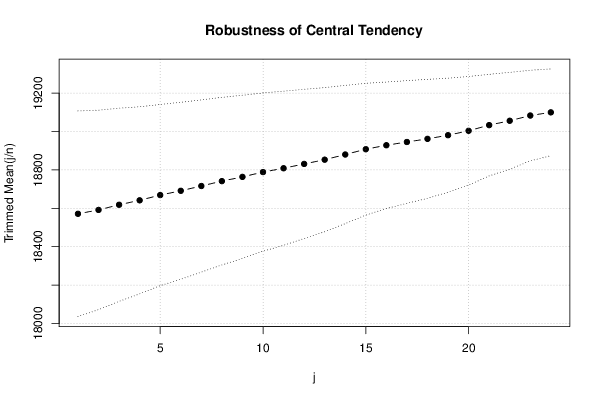
Trimmed Mean ( 1 / 24 )18571.47268.03120958190369.2884609556078
Trimmed Mean ( 2 / 24 )18591.6764705882259.8631842121171.5440955091699
Trimmed Mean ( 3 / 24 )18618.5742424242251.70871090138973.9687322530461
Trimmed Mean ( 4 / 24 )18641.659375243.80009396441476.4628883929839
Trimmed Mean ( 5 / 24 )18669.0322580645236.02350498681779.098190915804
Trimmed Mean ( 6 / 24 )18691.4366666667230.66016174125381.0345251020595
Trimmed Mean ( 7 / 24 )18716.3655172414224.41172599032983.4019052910273
Trimmed Mean ( 8 / 24 )18741.7410714286218.42262789183385.8049427036006
Trimmed Mean ( 9 / 24 )18763.887037037212.70718591417488.2146362681333
Trimmed Mean ( 10 / 24 )18788.95206.23244888987191.1056921504792
Trimmed Mean ( 11 / 24 )18808.904200.87622727786393.6342953812174
Trimmed Mean ( 12 / 24 )18831.3416666667194.30711551656296.9153477298241
Trimmed Mean ( 13 / 24 )18853.55187.876136803462100.350956330994
Trimmed Mean ( 14 / 24 )18880.45180.041787183241104.867043897893
Trimmed Mean ( 15 / 24 )18908.1214285714171.746832613035110.092984778203
Trimmed Mean ( 16 / 24 )18928.7925164.786370149413114.868678051693
Trimmed Mean ( 17 / 24 )18945.7657894737159.930689391798118.462353045076
Trimmed Mean ( 18 / 24 )18962.1333333333155.010533897047122.328030596471
Trimmed Mean ( 19 / 24 )18981.1029411765148.67531369895127.668154644765
Trimmed Mean ( 20 / 24 )19004.103125141.614832471372134.195710953101
Trimmed Mean ( 21 / 24 )19033.64132.365579666542143.795993248017
Trimmed Mean ( 22 / 24 )19056.4142857143126.205751291722150.994816723255
Trimmed Mean ( 23 / 24 )19083.6692307692118.002935787369161.721986859347
Trimmed Mean ( 24 / 24 )19100.2083333333113.121673610582168.846585483568
Median19193.3
Midrange17400.95
Midmean - Weighted Average at Xnp18908.8945945946
Midmean - Weighted Average at X(n+1)p18962.1333333333
Midmean - Empirical Distribution Function18908.8945945946
Midmean - Empirical Distribution Function - Averaging18962.1333333333
Midmean - Empirical Distribution Function - Interpolation18962.1333333333
Midmean - Closest Observation18908.8945945946
Midmean - True Basic - Statistics Graphics Toolkit18962.1333333333
Midmean - MS Excel (old versions)18945.7657894737
Number of observations72

\begin{tabular}{lllllllll}
\hline
Central Tendency - Ungrouped Data \tabularnewline
Measure & Value & S.E. & Value/S.E. \tabularnewline
Arithmetic Mean & 18538.9555555556 & 279.023396877471 & 66.4422975385705 \tabularnewline
Geometric Mean & 18378.573560446 &  &  \tabularnewline
Harmonic Mean & 18206.3690366824 &  &  \tabularnewline
Quadratic Mean & 18687.4426037171 &  &  \tabularnewline
Winsorized Mean ( 1 / 24 ) & 18552.3861111111 & 274.88292654718 & 67.4919550084419 \tabularnewline
Winsorized Mean ( 2 / 24 ) & 18542.3638888889 & 272.32431801716 & 68.0892695294309 \tabularnewline
Winsorized Mean ( 3 / 24 ) & 18557.0138888889 & 268.256608088013 & 69.1763532729099 \tabularnewline
Winsorized Mean ( 4 / 24 ) & 18547.375 & 263.418107185279 & 70.4104026795487 \tabularnewline
Winsorized Mean ( 5 / 24 ) & 18575.6805555556 & 250.825948861392 & 74.0580495753275 \tabularnewline
Winsorized Mean ( 6 / 24 ) & 18570.9472222222 & 249.484209469335 & 74.4373652413654 \tabularnewline
Winsorized Mean ( 7 / 24 ) & 18578.2097222222 & 242.943046797645 & 76.471460974541 \tabularnewline
Winsorized Mean ( 8 / 24 ) & 18608.8652777778 & 236.150170602823 & 78.8009817239376 \tabularnewline
Winsorized Mean ( 9 / 24 ) & 18600.9777777778 & 233.005657210183 & 79.8305843750341 \tabularnewline
Winsorized Mean ( 10 / 24 ) & 18650.3805555556 & 221.387233255817 & 84.2432523378831 \tabularnewline
Winsorized Mean ( 11 / 24 ) & 18644.3611111111 & 219.891769281598 & 84.7888084762041 \tabularnewline
Winsorized Mean ( 12 / 24 ) & 18661.0777777778 & 211.253305631296 & 88.3350805896847 \tabularnewline
Winsorized Mean ( 13 / 24 ) & 18639.8444444444 & 208.362576416061 & 89.4586963026611 \tabularnewline
Winsorized Mean ( 14 / 24 ) & 18654.4666666667 & 200.106951743687 & 93.2224817984375 \tabularnewline
Winsorized Mean ( 15 / 24 ) & 18735.8625 & 184.964669927611 & 101.294276941281 \tabularnewline
Winsorized Mean ( 16 / 24 ) & 18785.4625 & 167.302516795549 & 112.284398703677 \tabularnewline
Winsorized Mean ( 17 / 24 ) & 18806.6416666667 & 160.130403196811 & 117.445789751444 \tabularnewline
Winsorized Mean ( 18 / 24 ) & 18800.8916666667 & 157.447549265644 & 119.410506891701 \tabularnewline
Winsorized Mean ( 19 / 24 ) & 18786.8791666667 & 149.981593927288 & 125.261231560019 \tabularnewline
Winsorized Mean ( 20 / 24 ) & 18757.9625 & 145.374653002753 & 129.031864307492 \tabularnewline
Winsorized Mean ( 21 / 24 ) & 18847.65 & 124.846030745079 & 150.967154402247 \tabularnewline
Winsorized Mean ( 22 / 24 ) & 18839.8888888889 & 120.340039390141 & 156.555448912644 \tabularnewline
Winsorized Mean ( 23 / 24 ) & 18956.8694444444 & 102.25552398574 & 185.387240762544 \tabularnewline
Winsorized Mean ( 24 / 24 ) & 18963.7694444444 & 100.993980216933 & 187.771285018282 \tabularnewline
Trimmed Mean ( 1 / 24 ) & 18571.47 & 268.031209581903 & 69.2884609556078 \tabularnewline
Trimmed Mean ( 2 / 24 ) & 18591.6764705882 & 259.86318421211 & 71.5440955091699 \tabularnewline
Trimmed Mean ( 3 / 24 ) & 18618.5742424242 & 251.708710901389 & 73.9687322530461 \tabularnewline
Trimmed Mean ( 4 / 24 ) & 18641.659375 & 243.800093964414 & 76.4628883929839 \tabularnewline
Trimmed Mean ( 5 / 24 ) & 18669.0322580645 & 236.023504986817 & 79.098190915804 \tabularnewline
Trimmed Mean ( 6 / 24 ) & 18691.4366666667 & 230.660161741253 & 81.0345251020595 \tabularnewline
Trimmed Mean ( 7 / 24 ) & 18716.3655172414 & 224.411725990329 & 83.4019052910273 \tabularnewline
Trimmed Mean ( 8 / 24 ) & 18741.7410714286 & 218.422627891833 & 85.8049427036006 \tabularnewline
Trimmed Mean ( 9 / 24 ) & 18763.887037037 & 212.707185914174 & 88.2146362681333 \tabularnewline
Trimmed Mean ( 10 / 24 ) & 18788.95 & 206.232448889871 & 91.1056921504792 \tabularnewline
Trimmed Mean ( 11 / 24 ) & 18808.904 & 200.876227277863 & 93.6342953812174 \tabularnewline
Trimmed Mean ( 12 / 24 ) & 18831.3416666667 & 194.307115516562 & 96.9153477298241 \tabularnewline
Trimmed Mean ( 13 / 24 ) & 18853.55 & 187.876136803462 & 100.350956330994 \tabularnewline
Trimmed Mean ( 14 / 24 ) & 18880.45 & 180.041787183241 & 104.867043897893 \tabularnewline
Trimmed Mean ( 15 / 24 ) & 18908.1214285714 & 171.746832613035 & 110.092984778203 \tabularnewline
Trimmed Mean ( 16 / 24 ) & 18928.7925 & 164.786370149413 & 114.868678051693 \tabularnewline
Trimmed Mean ( 17 / 24 ) & 18945.7657894737 & 159.930689391798 & 118.462353045076 \tabularnewline
Trimmed Mean ( 18 / 24 ) & 18962.1333333333 & 155.010533897047 & 122.328030596471 \tabularnewline
Trimmed Mean ( 19 / 24 ) & 18981.1029411765 & 148.67531369895 & 127.668154644765 \tabularnewline
Trimmed Mean ( 20 / 24 ) & 19004.103125 & 141.614832471372 & 134.195710953101 \tabularnewline
Trimmed Mean ( 21 / 24 ) & 19033.64 & 132.365579666542 & 143.795993248017 \tabularnewline
Trimmed Mean ( 22 / 24 ) & 19056.4142857143 & 126.205751291722 & 150.994816723255 \tabularnewline
Trimmed Mean ( 23 / 24 ) & 19083.6692307692 & 118.002935787369 & 161.721986859347 \tabularnewline
Trimmed Mean ( 24 / 24 ) & 19100.2083333333 & 113.121673610582 & 168.846585483568 \tabularnewline
Median & 19193.3 &  &  \tabularnewline
Midrange & 17400.95 &  &  \tabularnewline
Midmean - Weighted Average at Xnp & 18908.8945945946 &  &  \tabularnewline
Midmean - Weighted Average at X(n+1)p & 18962.1333333333 &  &  \tabularnewline
Midmean - Empirical Distribution Function & 18908.8945945946 &  &  \tabularnewline
Midmean - Empirical Distribution Function - Averaging & 18962.1333333333 &  &  \tabularnewline
Midmean - Empirical Distribution Function - Interpolation & 18962.1333333333 &  &  \tabularnewline
Midmean - Closest Observation & 18908.8945945946 &  &  \tabularnewline
Midmean - True Basic - Statistics Graphics Toolkit & 18962.1333333333 &  &  \tabularnewline
Midmean - MS Excel (old versions) & 18945.7657894737 &  &  \tabularnewline
Number of observations & 72 &  &  \tabularnewline
\hline
\end{tabular}
%Source: https://freestatistics.org/blog/index.php?pk=293577&T=1

[TABLE]
[ROW][C]Central Tendency - Ungrouped Data[/C][/ROW]
[ROW][C]Measure[/C][C]Value[/C][C]S.E.[/C][C]Value/S.E.[/C][/ROW]
[ROW][C]Arithmetic Mean[/C][C]18538.9555555556[/C][C]279.023396877471[/C][C]66.4422975385705[/C][/ROW]
[ROW][C]Geometric Mean[/C][C]18378.573560446[/C][C][/C][C][/C][/ROW]
[ROW][C]Harmonic Mean[/C][C]18206.3690366824[/C][C][/C][C][/C][/ROW]
[ROW][C]Quadratic Mean[/C][C]18687.4426037171[/C][C][/C][C][/C][/ROW]
[ROW][C]Winsorized Mean ( 1 / 24 )[/C][C]18552.3861111111[/C][C]274.88292654718[/C][C]67.4919550084419[/C][/ROW]
[ROW][C]Winsorized Mean ( 2 / 24 )[/C][C]18542.3638888889[/C][C]272.32431801716[/C][C]68.0892695294309[/C][/ROW]
[ROW][C]Winsorized Mean ( 3 / 24 )[/C][C]18557.0138888889[/C][C]268.256608088013[/C][C]69.1763532729099[/C][/ROW]
[ROW][C]Winsorized Mean ( 4 / 24 )[/C][C]18547.375[/C][C]263.418107185279[/C][C]70.4104026795487[/C][/ROW]
[ROW][C]Winsorized Mean ( 5 / 24 )[/C][C]18575.6805555556[/C][C]250.825948861392[/C][C]74.0580495753275[/C][/ROW]
[ROW][C]Winsorized Mean ( 6 / 24 )[/C][C]18570.9472222222[/C][C]249.484209469335[/C][C]74.4373652413654[/C][/ROW]
[ROW][C]Winsorized Mean ( 7 / 24 )[/C][C]18578.2097222222[/C][C]242.943046797645[/C][C]76.471460974541[/C][/ROW]
[ROW][C]Winsorized Mean ( 8 / 24 )[/C][C]18608.8652777778[/C][C]236.150170602823[/C][C]78.8009817239376[/C][/ROW]
[ROW][C]Winsorized Mean ( 9 / 24 )[/C][C]18600.9777777778[/C][C]233.005657210183[/C][C]79.8305843750341[/C][/ROW]
[ROW][C]Winsorized Mean ( 10 / 24 )[/C][C]18650.3805555556[/C][C]221.387233255817[/C][C]84.2432523378831[/C][/ROW]
[ROW][C]Winsorized Mean ( 11 / 24 )[/C][C]18644.3611111111[/C][C]219.891769281598[/C][C]84.7888084762041[/C][/ROW]
[ROW][C]Winsorized Mean ( 12 / 24 )[/C][C]18661.0777777778[/C][C]211.253305631296[/C][C]88.3350805896847[/C][/ROW]
[ROW][C]Winsorized Mean ( 13 / 24 )[/C][C]18639.8444444444[/C][C]208.362576416061[/C][C]89.4586963026611[/C][/ROW]
[ROW][C]Winsorized Mean ( 14 / 24 )[/C][C]18654.4666666667[/C][C]200.106951743687[/C][C]93.2224817984375[/C][/ROW]
[ROW][C]Winsorized Mean ( 15 / 24 )[/C][C]18735.8625[/C][C]184.964669927611[/C][C]101.294276941281[/C][/ROW]
[ROW][C]Winsorized Mean ( 16 / 24 )[/C][C]18785.4625[/C][C]167.302516795549[/C][C]112.284398703677[/C][/ROW]
[ROW][C]Winsorized Mean ( 17 / 24 )[/C][C]18806.6416666667[/C][C]160.130403196811[/C][C]117.445789751444[/C][/ROW]
[ROW][C]Winsorized Mean ( 18 / 24 )[/C][C]18800.8916666667[/C][C]157.447549265644[/C][C]119.410506891701[/C][/ROW]
[ROW][C]Winsorized Mean ( 19 / 24 )[/C][C]18786.8791666667[/C][C]149.981593927288[/C][C]125.261231560019[/C][/ROW]
[ROW][C]Winsorized Mean ( 20 / 24 )[/C][C]18757.9625[/C][C]145.374653002753[/C][C]129.031864307492[/C][/ROW]
[ROW][C]Winsorized Mean ( 21 / 24 )[/C][C]18847.65[/C][C]124.846030745079[/C][C]150.967154402247[/C][/ROW]
[ROW][C]Winsorized Mean ( 22 / 24 )[/C][C]18839.8888888889[/C][C]120.340039390141[/C][C]156.555448912644[/C][/ROW]
[ROW][C]Winsorized Mean ( 23 / 24 )[/C][C]18956.8694444444[/C][C]102.25552398574[/C][C]185.387240762544[/C][/ROW]
[ROW][C]Winsorized Mean ( 24 / 24 )[/C][C]18963.7694444444[/C][C]100.993980216933[/C][C]187.771285018282[/C][/ROW]
[ROW][C]Trimmed Mean ( 1 / 24 )[/C][C]18571.47[/C][C]268.031209581903[/C][C]69.2884609556078[/C][/ROW]
[ROW][C]Trimmed Mean ( 2 / 24 )[/C][C]18591.6764705882[/C][C]259.86318421211[/C][C]71.5440955091699[/C][/ROW]
[ROW][C]Trimmed Mean ( 3 / 24 )[/C][C]18618.5742424242[/C][C]251.708710901389[/C][C]73.9687322530461[/C][/ROW]
[ROW][C]Trimmed Mean ( 4 / 24 )[/C][C]18641.659375[/C][C]243.800093964414[/C][C]76.4628883929839[/C][/ROW]
[ROW][C]Trimmed Mean ( 5 / 24 )[/C][C]18669.0322580645[/C][C]236.023504986817[/C][C]79.098190915804[/C][/ROW]
[ROW][C]Trimmed Mean ( 6 / 24 )[/C][C]18691.4366666667[/C][C]230.660161741253[/C][C]81.0345251020595[/C][/ROW]
[ROW][C]Trimmed Mean ( 7 / 24 )[/C][C]18716.3655172414[/C][C]224.411725990329[/C][C]83.4019052910273[/C][/ROW]
[ROW][C]Trimmed Mean ( 8 / 24 )[/C][C]18741.7410714286[/C][C]218.422627891833[/C][C]85.8049427036006[/C][/ROW]
[ROW][C]Trimmed Mean ( 9 / 24 )[/C][C]18763.887037037[/C][C]212.707185914174[/C][C]88.2146362681333[/C][/ROW]
[ROW][C]Trimmed Mean ( 10 / 24 )[/C][C]18788.95[/C][C]206.232448889871[/C][C]91.1056921504792[/C][/ROW]
[ROW][C]Trimmed Mean ( 11 / 24 )[/C][C]18808.904[/C][C]200.876227277863[/C][C]93.6342953812174[/C][/ROW]
[ROW][C]Trimmed Mean ( 12 / 24 )[/C][C]18831.3416666667[/C][C]194.307115516562[/C][C]96.9153477298241[/C][/ROW]
[ROW][C]Trimmed Mean ( 13 / 24 )[/C][C]18853.55[/C][C]187.876136803462[/C][C]100.350956330994[/C][/ROW]
[ROW][C]Trimmed Mean ( 14 / 24 )[/C][C]18880.45[/C][C]180.041787183241[/C][C]104.867043897893[/C][/ROW]
[ROW][C]Trimmed Mean ( 15 / 24 )[/C][C]18908.1214285714[/C][C]171.746832613035[/C][C]110.092984778203[/C][/ROW]
[ROW][C]Trimmed Mean ( 16 / 24 )[/C][C]18928.7925[/C][C]164.786370149413[/C][C]114.868678051693[/C][/ROW]
[ROW][C]Trimmed Mean ( 17 / 24 )[/C][C]18945.7657894737[/C][C]159.930689391798[/C][C]118.462353045076[/C][/ROW]
[ROW][C]Trimmed Mean ( 18 / 24 )[/C][C]18962.1333333333[/C][C]155.010533897047[/C][C]122.328030596471[/C][/ROW]
[ROW][C]Trimmed Mean ( 19 / 24 )[/C][C]18981.1029411765[/C][C]148.67531369895[/C][C]127.668154644765[/C][/ROW]
[ROW][C]Trimmed Mean ( 20 / 24 )[/C][C]19004.103125[/C][C]141.614832471372[/C][C]134.195710953101[/C][/ROW]
[ROW][C]Trimmed Mean ( 21 / 24 )[/C][C]19033.64[/C][C]132.365579666542[/C][C]143.795993248017[/C][/ROW]
[ROW][C]Trimmed Mean ( 22 / 24 )[/C][C]19056.4142857143[/C][C]126.205751291722[/C][C]150.994816723255[/C][/ROW]
[ROW][C]Trimmed Mean ( 23 / 24 )[/C][C]19083.6692307692[/C][C]118.002935787369[/C][C]161.721986859347[/C][/ROW]
[ROW][C]Trimmed Mean ( 24 / 24 )[/C][C]19100.2083333333[/C][C]113.121673610582[/C][C]168.846585483568[/C][/ROW]
[ROW][C]Median[/C][C]19193.3[/C][C][/C][C][/C][/ROW]
[ROW][C]Midrange[/C][C]17400.95[/C][C][/C][C][/C][/ROW]
[ROW][C]Midmean - Weighted Average at Xnp[/C][C]18908.8945945946[/C][C][/C][C][/C][/ROW]
[ROW][C]Midmean - Weighted Average at X(n+1)p[/C][C]18962.1333333333[/C][C][/C][C][/C][/ROW]
[ROW][C]Midmean - Empirical Distribution Function[/C][C]18908.8945945946[/C][C][/C][C][/C][/ROW]
[ROW][C]Midmean - Empirical Distribution Function - Averaging[/C][C]18962.1333333333[/C][C][/C][C][/C][/ROW]
[ROW][C]Midmean - Empirical Distribution Function - Interpolation[/C][C]18962.1333333333[/C][C][/C][C][/C][/ROW]
[ROW][C]Midmean - Closest Observation[/C][C]18908.8945945946[/C][C][/C][C][/C][/ROW]
[ROW][C]Midmean - True Basic - Statistics Graphics Toolkit[/C][C]18962.1333333333[/C][C][/C][C][/C][/ROW]
[ROW][C]Midmean - MS Excel (old versions)[/C][C]18945.7657894737[/C][C][/C][C][/C][/ROW]
[ROW][C]Number of observations[/C][C]72[/C][C][/C][C][/C][/ROW]
[/TABLE]
Source: https://freestatistics.org/blog/index.php?pk=293577&T=1

Globally Unique Identifier (entire table): ba.freestatistics.org/blog/index.php?pk=293577&T=1

As an alternative you can also use a QR Code:  

The GUIDs for individual cells are displayed in the table below:

Central Tendency - Ungrouped Data
MeasureValueS.E.Value/S.E.
Arithmetic Mean18538.9555555556279.02339687747166.4422975385705
Geometric Mean18378.573560446
Harmonic Mean18206.3690366824
Quadratic Mean18687.4426037171
Winsorized Mean ( 1 / 24 )18552.3861111111274.8829265471867.4919550084419
Winsorized Mean ( 2 / 24 )18542.3638888889272.3243180171668.0892695294309
Winsorized Mean ( 3 / 24 )18557.0138888889268.25660808801369.1763532729099
Winsorized Mean ( 4 / 24 )18547.375263.41810718527970.4104026795487
Winsorized Mean ( 5 / 24 )18575.6805555556250.82594886139274.0580495753275
Winsorized Mean ( 6 / 24 )18570.9472222222249.48420946933574.4373652413654
Winsorized Mean ( 7 / 24 )18578.2097222222242.94304679764576.471460974541
Winsorized Mean ( 8 / 24 )18608.8652777778236.15017060282378.8009817239376
Winsorized Mean ( 9 / 24 )18600.9777777778233.00565721018379.8305843750341
Winsorized Mean ( 10 / 24 )18650.3805555556221.38723325581784.2432523378831
Winsorized Mean ( 11 / 24 )18644.3611111111219.89176928159884.7888084762041
Winsorized Mean ( 12 / 24 )18661.0777777778211.25330563129688.3350805896847
Winsorized Mean ( 13 / 24 )18639.8444444444208.36257641606189.4586963026611
Winsorized Mean ( 14 / 24 )18654.4666666667200.10695174368793.2224817984375
Winsorized Mean ( 15 / 24 )18735.8625184.964669927611101.294276941281
Winsorized Mean ( 16 / 24 )18785.4625167.302516795549112.284398703677
Winsorized Mean ( 17 / 24 )18806.6416666667160.130403196811117.445789751444
Winsorized Mean ( 18 / 24 )18800.8916666667157.447549265644119.410506891701
Winsorized Mean ( 19 / 24 )18786.8791666667149.981593927288125.261231560019
Winsorized Mean ( 20 / 24 )18757.9625145.374653002753129.031864307492
Winsorized Mean ( 21 / 24 )18847.65124.846030745079150.967154402247
Winsorized Mean ( 22 / 24 )18839.8888888889120.340039390141156.555448912644
Winsorized Mean ( 23 / 24 )18956.8694444444102.25552398574185.387240762544
Winsorized Mean ( 24 / 24 )18963.7694444444100.993980216933187.771285018282
Trimmed Mean ( 1 / 24 )18571.47268.03120958190369.2884609556078
Trimmed Mean ( 2 / 24 )18591.6764705882259.8631842121171.5440955091699
Trimmed Mean ( 3 / 24 )18618.5742424242251.70871090138973.9687322530461
Trimmed Mean ( 4 / 24 )18641.659375243.80009396441476.4628883929839
Trimmed Mean ( 5 / 24 )18669.0322580645236.02350498681779.098190915804
Trimmed Mean ( 6 / 24 )18691.4366666667230.66016174125381.0345251020595
Trimmed Mean ( 7 / 24 )18716.3655172414224.41172599032983.4019052910273
Trimmed Mean ( 8 / 24 )18741.7410714286218.42262789183385.8049427036006
Trimmed Mean ( 9 / 24 )18763.887037037212.70718591417488.2146362681333
Trimmed Mean ( 10 / 24 )18788.95206.23244888987191.1056921504792
Trimmed Mean ( 11 / 24 )18808.904200.87622727786393.6342953812174
Trimmed Mean ( 12 / 24 )18831.3416666667194.30711551656296.9153477298241
Trimmed Mean ( 13 / 24 )18853.55187.876136803462100.350956330994
Trimmed Mean ( 14 / 24 )18880.45180.041787183241104.867043897893
Trimmed Mean ( 15 / 24 )18908.1214285714171.746832613035110.092984778203
Trimmed Mean ( 16 / 24 )18928.7925164.786370149413114.868678051693
Trimmed Mean ( 17 / 24 )18945.7657894737159.930689391798118.462353045076
Trimmed Mean ( 18 / 24 )18962.1333333333155.010533897047122.328030596471
Trimmed Mean ( 19 / 24 )18981.1029411765148.67531369895127.668154644765
Trimmed Mean ( 20 / 24 )19004.103125141.614832471372134.195710953101
Trimmed Mean ( 21 / 24 )19033.64132.365579666542143.795993248017
Trimmed Mean ( 22 / 24 )19056.4142857143126.205751291722150.994816723255
Trimmed Mean ( 23 / 24 )19083.6692307692118.002935787369161.721986859347
Trimmed Mean ( 24 / 24 )19100.2083333333113.121673610582168.846585483568
Median19193.3
Midrange17400.95
Midmean - Weighted Average at Xnp18908.8945945946
Midmean - Weighted Average at X(n+1)p18962.1333333333
Midmean - Empirical Distribution Function18908.8945945946
Midmean - Empirical Distribution Function - Averaging18962.1333333333
Midmean - Empirical Distribution Function - Interpolation18962.1333333333
Midmean - Closest Observation18908.8945945946
Midmean - True Basic - Statistics Graphics Toolkit18962.1333333333
Midmean - MS Excel (old versions)18945.7657894737
Number of observations72


Parameters (Session):
Parameters (R input):
R code (references can be found in the software module):
geomean <- function(x) {
return(exp(mean(log(x))))
}
harmean <- function(x) {
return(1/mean(1/x))
}
quamean <- function(x) {
return(sqrt(mean(x*x)))
}
winmean <- function(x) {
x <-sort(x[!is.na(x)])
n<-length(x)
denom <- 3
nodenom <- n/denom
if (nodenom>40) denom <- n/40
sqrtn = sqrt(n)
roundnodenom = floor(nodenom)
win <- array(NA,dim=c(roundnodenom,2))
for (j in 1:roundnodenom) {
win[j,1] <- (j*x[j+1]+sum(x[(j+1):(n-j)])+j*x[n-j])/n
win[j,2] <- sd(c(rep(x[j+1],j),x[(j+1):(n-j)],rep(x[n-j],j)))/sqrtn
}
return(win)
}
trimean <- function(x) {
x <-sort(x[!is.na(x)])
n<-length(x)
denom <- 3
nodenom <- n/denom
if (nodenom>40) denom <- n/40
sqrtn = sqrt(n)
roundnodenom = floor(nodenom)
tri <- array(NA,dim=c(roundnodenom,2))
for (j in 1:roundnodenom) {
tri[j,1] <- mean(x,trim=j/n)
tri[j,2] <- sd(x[(j+1):(n-j)]) / sqrt(n-j*2)
}
return(tri)
}
midrange <- function(x) {
return((max(x)+min(x))/2)
}
q1 <- function(data,n,p,i,f) {
np <- n*p;
i <<- floor(np)
f <<- np - i
qvalue <- (1-f)*data[i] + f*data[i+1]
}
q2 <- function(data,n,p,i,f) {
np <- (n+1)*p
i <<- floor(np)
f <<- np - i
qvalue <- (1-f)*data[i] + f*data[i+1]
}
q3 <- function(data,n,p,i,f) {
np <- n*p
i <<- floor(np)
f <<- np - i
if (f==0) {
qvalue <- data[i]
} else {
qvalue <- data[i+1]
}
}
q4 <- function(data,n,p,i,f) {
np <- n*p
i <<- floor(np)
f <<- np - i
if (f==0) {
qvalue <- (data[i]+data[i+1])/2
} else {
qvalue <- data[i+1]
}
}
q5 <- function(data,n,p,i,f) {
np <- (n-1)*p
i <<- floor(np)
f <<- np - i
if (f==0) {
qvalue <- data[i+1]
} else {
qvalue <- data[i+1] + f*(data[i+2]-data[i+1])
}
}
q6 <- function(data,n,p,i,f) {
np <- n*p+0.5
i <<- floor(np)
f <<- np - i
qvalue <- data[i]
}
q7 <- function(data,n,p,i,f) {
np <- (n+1)*p
i <<- floor(np)
f <<- np - i
if (f==0) {
qvalue <- data[i]
} else {
qvalue <- f*data[i] + (1-f)*data[i+1]
}
}
q8 <- function(data,n,p,i,f) {
np <- (n+1)*p
i <<- floor(np)
f <<- np - i
if (f==0) {
qvalue <- data[i]
} else {
if (f == 0.5) {
qvalue <- (data[i]+data[i+1])/2
} else {
if (f < 0.5) {
qvalue <- data[i]
} else {
qvalue <- data[i+1]
}
}
}
}
midmean <- function(x,def) {
x <-sort(x[!is.na(x)])
n<-length(x)
if (def==1) {
qvalue1 <- q1(x,n,0.25,i,f)
qvalue3 <- q1(x,n,0.75,i,f)
}
if (def==2) {
qvalue1 <- q2(x,n,0.25,i,f)
qvalue3 <- q2(x,n,0.75,i,f)
}
if (def==3) {
qvalue1 <- q3(x,n,0.25,i,f)
qvalue3 <- q3(x,n,0.75,i,f)
}
if (def==4) {
qvalue1 <- q4(x,n,0.25,i,f)
qvalue3 <- q4(x,n,0.75,i,f)
}
if (def==5) {
qvalue1 <- q5(x,n,0.25,i,f)
qvalue3 <- q5(x,n,0.75,i,f)
}
if (def==6) {
qvalue1 <- q6(x,n,0.25,i,f)
qvalue3 <- q6(x,n,0.75,i,f)
}
if (def==7) {
qvalue1 <- q7(x,n,0.25,i,f)
qvalue3 <- q7(x,n,0.75,i,f)
}
if (def==8) {
qvalue1 <- q8(x,n,0.25,i,f)
qvalue3 <- q8(x,n,0.75,i,f)
}
midm <- 0
myn <- 0
roundno4 <- round(n/4)
round3no4 <- round(3*n/4)
for (i in 1:n) {
if ((x[i]>=qvalue1) & (x[i]<=qvalue3)){
midm = midm + x[i]
myn = myn + 1
}
}
midm = midm / myn
return(midm)
}
(arm <- mean(x))
sqrtn <- sqrt(length(x))
(armse <- sd(x) / sqrtn)
(armose <- arm / armse)
(geo <- geomean(x))
(har <- harmean(x))
(qua <- quamean(x))
(win <- winmean(x))
(tri <- trimean(x))
(midr <- midrange(x))
midm <- array(NA,dim=8)
for (j in 1:8) midm[j] <- midmean(x,j)
midm
bitmap(file='test1.png')
lb <- win[,1] - 2*win[,2]
ub <- win[,1] + 2*win[,2]
if ((ylimmin == '') | (ylimmax == '')) plot(win[,1],type='b',main=main, xlab='j', pch=19, ylab='Winsorized Mean(j/n)', ylim=c(min(lb),max(ub))) else plot(win[,1],type='l',main=main, xlab='j', pch=19, ylab='Winsorized Mean(j/n)', ylim=c(ylimmin,ylimmax))
lines(ub,lty=3)
lines(lb,lty=3)
grid()
dev.off()
bitmap(file='test2.png')
lb <- tri[,1] - 2*tri[,2]
ub <- tri[,1] + 2*tri[,2]
if ((ylimmin == '') | (ylimmax == '')) plot(tri[,1],type='b',main=main, xlab='j', pch=19, ylab='Trimmed Mean(j/n)', ylim=c(min(lb),max(ub))) else plot(tri[,1],type='l',main=main, xlab='j', pch=19, ylab='Trimmed Mean(j/n)', ylim=c(ylimmin,ylimmax))
lines(ub,lty=3)
lines(lb,lty=3)
grid()
dev.off()
load(file='createtable')
a<-table.start()
a<-table.row.start(a)
a<-table.element(a,'Central Tendency - Ungrouped Data',4,TRUE)
a<-table.row.end(a)
a<-table.row.start(a)
a<-table.element(a,'Measure',header=TRUE)
a<-table.element(a,'Value',header=TRUE)
a<-table.element(a,'S.E.',header=TRUE)
a<-table.element(a,'Value/S.E.',header=TRUE)
a<-table.row.end(a)
a<-table.row.start(a)
a<-table.element(a,hyperlink('arithmetic_mean.htm', 'Arithmetic Mean', 'click to view the definition of the Arithmetic Mean'),header=TRUE)
a<-table.element(a,arm)
a<-table.element(a,hyperlink('arithmetic_mean_standard_error.htm', armse, 'click to view the definition of the Standard Error of the Arithmetic Mean'))
a<-table.element(a,armose)
a<-table.row.end(a)
a<-table.row.start(a)
a<-table.element(a,hyperlink('geometric_mean.htm', 'Geometric Mean', 'click to view the definition of the Geometric Mean'),header=TRUE)
a<-table.element(a,geo)
a<-table.element(a,'')
a<-table.row.end(a)
a<-table.row.start(a)
a<-table.element(a,hyperlink('harmonic_mean.htm', 'Harmonic Mean', 'click to view the definition of the Harmonic Mean'),header=TRUE)
a<-table.element(a,har)
a<-table.element(a,'')
a<-table.row.end(a)
a<-table.row.start(a)
a<-table.element(a,hyperlink('quadratic_mean.htm', 'Quadratic Mean', 'click to view the definition of the Quadratic Mean'),header=TRUE)
a<-table.element(a,qua)
a<-table.element(a,'')
a<-table.row.end(a)
for (j in 1:length(win[,1])) {
a<-table.row.start(a)
mylabel <- paste('Winsorized Mean (',j)
mylabel <- paste(mylabel,'/')
mylabel <- paste(mylabel,length(win[,1]))
mylabel <- paste(mylabel,')')
a<-table.element(a,hyperlink('winsorized_mean.htm', mylabel, 'click to view the definition of the Winsorized Mean'),header=TRUE)
a<-table.element(a,win[j,1])
a<-table.element(a,win[j,2])
a<-table.element(a,win[j,1]/win[j,2])
a<-table.row.end(a)
}
for (j in 1:length(tri[,1])) {
a<-table.row.start(a)
mylabel <- paste('Trimmed Mean (',j)
mylabel <- paste(mylabel,'/')
mylabel <- paste(mylabel,length(tri[,1]))
mylabel <- paste(mylabel,')')
a<-table.element(a,hyperlink('arithmetic_mean.htm', mylabel, 'click to view the definition of the Trimmed Mean'),header=TRUE)
a<-table.element(a,tri[j,1])
a<-table.element(a,tri[j,2])
a<-table.element(a,tri[j,1]/tri[j,2])
a<-table.row.end(a)
}
a<-table.row.start(a)
a<-table.element(a,hyperlink('median_1.htm', 'Median', 'click to view the definition of the Median'),header=TRUE)
a<-table.element(a,median(x))
a<-table.element(a,'')
a<-table.row.end(a)
a<-table.row.start(a)
a<-table.element(a,hyperlink('midrange.htm', 'Midrange', 'click to view the definition of the Midrange'),header=TRUE)
a<-table.element(a,midr)
a<-table.element(a,'')
a<-table.row.end(a)
a<-table.row.start(a)
mymid <- hyperlink('midmean.htm', 'Midmean', 'click to view the definition of the Midmean')
mylabel <- paste(mymid,hyperlink('method_1.htm','Weighted Average at Xnp',''),sep=' - ')
a<-table.element(a,mylabel,header=TRUE)
a<-table.element(a,midm[1])
a<-table.element(a,'')
a<-table.row.end(a)
a<-table.row.start(a)
mymid <- hyperlink('midmean.htm', 'Midmean', 'click to view the definition of the Midmean')
mylabel <- paste(mymid,hyperlink('method_2.htm','Weighted Average at X(n+1)p',''),sep=' - ')
a<-table.element(a,mylabel,header=TRUE)
a<-table.element(a,midm[2])
a<-table.element(a,'')
a<-table.row.end(a)
a<-table.row.start(a)
mymid <- hyperlink('midmean.htm', 'Midmean', 'click to view the definition of the Midmean')
mylabel <- paste(mymid,hyperlink('method_3.htm','Empirical Distribution Function',''),sep=' - ')
a<-table.element(a,mylabel,header=TRUE)
a<-table.element(a,midm[3])
a<-table.element(a,'')
a<-table.row.end(a)
a<-table.row.start(a)
mymid <- hyperlink('midmean.htm', 'Midmean', 'click to view the definition of the Midmean')
mylabel <- paste(mymid,hyperlink('method_4.htm','Empirical Distribution Function - Averaging',''),sep=' - ')
a<-table.element(a,mylabel,header=TRUE)
a<-table.element(a,midm[4])
a<-table.element(a,'')
a<-table.row.end(a)
a<-table.row.start(a)
mymid <- hyperlink('midmean.htm', 'Midmean', 'click to view the definition of the Midmean')
mylabel <- paste(mymid,hyperlink('method_5.htm','Empirical Distribution Function - Interpolation',''),sep=' - ')
a<-table.element(a,mylabel,header=TRUE)
a<-table.element(a,midm[5])
a<-table.element(a,'')
a<-table.row.end(a)
a<-table.row.start(a)
mymid <- hyperlink('midmean.htm', 'Midmean', 'click to view the definition of the Midmean')
mylabel <- paste(mymid,hyperlink('method_6.htm','Closest Observation',''),sep=' - ')
a<-table.element(a,mylabel,header=TRUE)
a<-table.element(a,midm[6])
a<-table.element(a,'')
a<-table.row.end(a)
a<-table.row.start(a)
mymid <- hyperlink('midmean.htm', 'Midmean', 'click to view the definition of the Midmean')
mylabel <- paste(mymid,hyperlink('method_7.htm','True Basic - Statistics Graphics Toolkit',''),sep=' - ')
a<-table.element(a,mylabel,header=TRUE)
a<-table.element(a,midm[7])
a<-table.element(a,'')
a<-table.row.end(a)
a<-table.row.start(a)
mymid <- hyperlink('midmean.htm', 'Midmean', 'click to view the definition of the Midmean')
mylabel <- paste(mymid,hyperlink('method_8.htm','MS Excel (old versions)',''),sep=' - ')
a<-table.element(a,mylabel,header=TRUE)
a<-table.element(a,midm[8])
a<-table.element(a,'')
a<-table.row.end(a)
a<-table.row.start(a)
a<-table.element(a,'Number of observations',header=TRUE)
a<-table.element(a,length(x))
a<-table.element(a,'')
a<-table.row.end(a)
a<-table.end(a)
table.save(a,file='mytable.tab')