Free Statistics

of Irreproducible Research!

Author's title

Author*Unverified author*
R Software Modulerwasp_autocorrelation.wasp
Title produced by software(Partial) Autocorrelation Function
Date of computationTue, 08 Mar 2016 09:59:22 +0000
Cite this page as followsStatistical Computations at FreeStatistics.org, Office for Research Development and Education, URL https://freestatistics.org/blog/index.php?v=date/2016/Mar/08/t1457431264xijgq52gu363f48.htm/, Retrieved Mon, 29 Apr 2024 01:15:07 +0000
Statistical Computations at FreeStatistics.org, Office for Research Development and Education, URL https://freestatistics.org/blog/index.php?pk=293657, Retrieved Mon, 29 Apr 2024 01:15:07 +0000
QR Codes:

Original text written by user:
IsPrivate?No (this computation is public)
User-defined keywords
Estimated Impact107
Family? (F = Feedback message, R = changed R code, M = changed R Module, P = changed Parameters, D = changed Data)
-       [(Partial) Autocorrelation Function] [] [2016-03-08 09:59:22] [409a9d71664281dd1fd3bb0995266dd0] [Current]
Feedback Forum

Post a new message
Dataseries X:
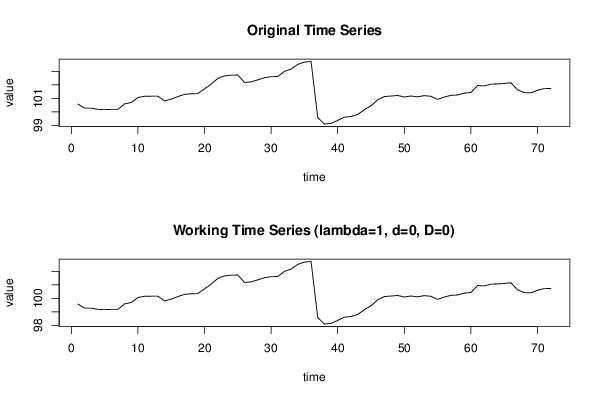
100.57
100.27
100.27
100.18
100.16
100.18
100.18
100.59
100.69
101.06
101.15
101.16
101.16
100.81
100.94
101.13
101.29
101.34
101.35
101.7
102.05
102.48
102.66
102.72
102.73
102.18
102.22
102.37
102.53
102.61
102.62
103
103.17
103.52
103.69
103.73
99.57
99.09
99.14
99.36
99.6
99.65
99.8
100.15
100.45
100.89
101.13
101.17
101.21
101.1
101.17
101.11
101.2
101.15
100.92
101.1
101.22
101.25
101.39
101.43
101.95
101.92
102.05
102.07
102.1
102.16
101.63
101.43
101.4
101.6
101.72
101.73


Summary of computational transaction
Raw Inputview raw input (R code)
Raw Outputview raw output of R engine
Computing time2 seconds
R Server'Gertrude Mary Cox' @ cox.wessa.net
R Framework error message
Warning: there are blank lines in the 'Data' field.
Please, use NA for missing data - blank lines are simply
 deleted and are NOT treated as missing values.

\begin{tabular}{lllllllll}
\hline
Summary of computational transaction \tabularnewline
Raw Input & view raw input (R code)  \tabularnewline
Raw Output & view raw output of R engine  \tabularnewline
Computing time & 2 seconds \tabularnewline
R Server & 'Gertrude Mary Cox' @ cox.wessa.net \tabularnewline
R Framework error message & 
Warning: there are blank lines in the 'Data' field.
Please, use NA for missing data - blank lines are simply
 deleted and are NOT treated as missing values.
\tabularnewline \hline \end{tabular} %Source: https://freestatistics.org/blog/index.php?pk=293657&T=0

[TABLE]
[ROW][C]Summary of computational transaction[/C][/ROW]
[ROW][C]Raw Input[/C][C]view raw input (R code) [/C][/ROW]
[ROW][C]Raw Output[/C][C]view raw output of R engine [/C][/ROW]
[ROW][C]Computing time[/C][C]2 seconds[/C][/ROW]
[ROW][C]R Server[/C][C]'Gertrude Mary Cox' @ cox.wessa.net[/C][/ROW]
[ROW][C]R Framework error message[/C][C]
Warning: there are blank lines in the 'Data' field.
Please, use NA for missing data - blank lines are simply
 deleted and are NOT treated as missing values.
[/C][/ROW] [/TABLE] Source: https://freestatistics.org/blog/index.php?pk=293657&T=0

Globally Unique Identifier (entire table): ba.freestatistics.org/blog/index.php?pk=293657&T=0

As an alternative you can also use a QR Code:  

The GUIDs for individual cells are displayed in the table below:

Summary of computational transaction
Raw Inputview raw input (R code)
Raw Outputview raw output of R engine
Computing time2 seconds
R Server'Gertrude Mary Cox' @ cox.wessa.net
R Framework error message
Warning: there are blank lines in the 'Data' field.
Please, use NA for missing data - blank lines are simply
 deleted and are NOT treated as missing values.


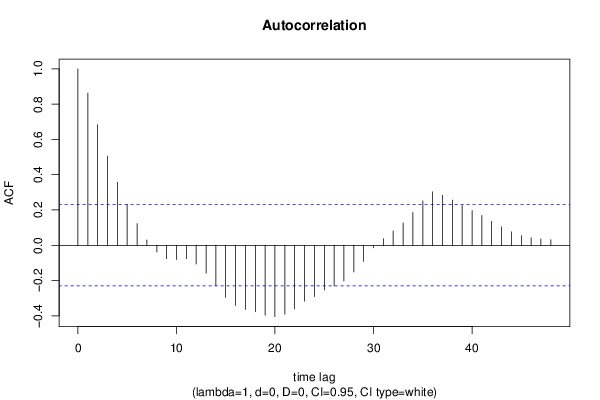
Autocorrelation Function
Time lag kACF(k)T-STATP-value
10.8630167.32290
20.6837525.80180
30.5058524.29232.7e-05
40.3569143.02850.001705
50.2314671.96410.026692
60.1224821.03930.151073
70.0297370.25230.400754
8-0.03828-0.32480.37313
9-0.076911-0.65260.258044
10-0.080829-0.68590.247502
11-0.075816-0.64330.261029
12-0.106148-0.90070.185376
13-0.15812-1.34170.091956
14-0.229403-1.94660.027745
15-0.294614-2.49990.007351
16-0.342245-2.9040.002444
17-0.364863-3.0960.001397
18-0.376961-3.19860.001027
19-0.397356-3.37170.000602
20-0.405023-3.43670.000491
21-0.391837-3.32480.000697
22-0.36091-3.06240.001543
23-0.316841-2.68850.004456
24-0.290313-2.46340.008077
25-0.253378-2.150.017458
26-0.231289-1.96260.026781
27-0.202426-1.71760.04508
28-0.151702-1.28720.101067
29-0.091422-0.77570.220222
30-0.013973-0.11860.452974
310.037350.31690.376107
320.0804780.68290.248438
330.1263351.0720.143653
340.1854381.57350.059994
350.2516482.13530.018069
360.3029692.57080.006107
370.2836372.40670.009331
380.2558582.1710.016613
390.225341.91210.029923
400.1963591.66620.050013
410.1689781.43380.077975
420.1357681.1520.12656
430.1041730.88390.189835
440.0758440.64360.260954
450.054590.46320.322306
460.042850.36360.358614
470.0355620.30180.381854
480.031340.26590.395528

\begin{tabular}{lllllllll}
\hline
Autocorrelation Function \tabularnewline
Time lag k & ACF(k) & T-STAT & P-value \tabularnewline
1 & 0.863016 & 7.3229 & 0 \tabularnewline
2 & 0.683752 & 5.8018 & 0 \tabularnewline
3 & 0.505852 & 4.2923 & 2.7e-05 \tabularnewline
4 & 0.356914 & 3.0285 & 0.001705 \tabularnewline
5 & 0.231467 & 1.9641 & 0.026692 \tabularnewline
6 & 0.122482 & 1.0393 & 0.151073 \tabularnewline
7 & 0.029737 & 0.2523 & 0.400754 \tabularnewline
8 & -0.03828 & -0.3248 & 0.37313 \tabularnewline
9 & -0.076911 & -0.6526 & 0.258044 \tabularnewline
10 & -0.080829 & -0.6859 & 0.247502 \tabularnewline
11 & -0.075816 & -0.6433 & 0.261029 \tabularnewline
12 & -0.106148 & -0.9007 & 0.185376 \tabularnewline
13 & -0.15812 & -1.3417 & 0.091956 \tabularnewline
14 & -0.229403 & -1.9466 & 0.027745 \tabularnewline
15 & -0.294614 & -2.4999 & 0.007351 \tabularnewline
16 & -0.342245 & -2.904 & 0.002444 \tabularnewline
17 & -0.364863 & -3.096 & 0.001397 \tabularnewline
18 & -0.376961 & -3.1986 & 0.001027 \tabularnewline
19 & -0.397356 & -3.3717 & 0.000602 \tabularnewline
20 & -0.405023 & -3.4367 & 0.000491 \tabularnewline
21 & -0.391837 & -3.3248 & 0.000697 \tabularnewline
22 & -0.36091 & -3.0624 & 0.001543 \tabularnewline
23 & -0.316841 & -2.6885 & 0.004456 \tabularnewline
24 & -0.290313 & -2.4634 & 0.008077 \tabularnewline
25 & -0.253378 & -2.15 & 0.017458 \tabularnewline
26 & -0.231289 & -1.9626 & 0.026781 \tabularnewline
27 & -0.202426 & -1.7176 & 0.04508 \tabularnewline
28 & -0.151702 & -1.2872 & 0.101067 \tabularnewline
29 & -0.091422 & -0.7757 & 0.220222 \tabularnewline
30 & -0.013973 & -0.1186 & 0.452974 \tabularnewline
31 & 0.03735 & 0.3169 & 0.376107 \tabularnewline
32 & 0.080478 & 0.6829 & 0.248438 \tabularnewline
33 & 0.126335 & 1.072 & 0.143653 \tabularnewline
34 & 0.185438 & 1.5735 & 0.059994 \tabularnewline
35 & 0.251648 & 2.1353 & 0.018069 \tabularnewline
36 & 0.302969 & 2.5708 & 0.006107 \tabularnewline
37 & 0.283637 & 2.4067 & 0.009331 \tabularnewline
38 & 0.255858 & 2.171 & 0.016613 \tabularnewline
39 & 0.22534 & 1.9121 & 0.029923 \tabularnewline
40 & 0.196359 & 1.6662 & 0.050013 \tabularnewline
41 & 0.168978 & 1.4338 & 0.077975 \tabularnewline
42 & 0.135768 & 1.152 & 0.12656 \tabularnewline
43 & 0.104173 & 0.8839 & 0.189835 \tabularnewline
44 & 0.075844 & 0.6436 & 0.260954 \tabularnewline
45 & 0.05459 & 0.4632 & 0.322306 \tabularnewline
46 & 0.04285 & 0.3636 & 0.358614 \tabularnewline
47 & 0.035562 & 0.3018 & 0.381854 \tabularnewline
48 & 0.03134 & 0.2659 & 0.395528 \tabularnewline
\hline
\end{tabular}
%Source: https://freestatistics.org/blog/index.php?pk=293657&T=1

[TABLE]
[ROW][C]Autocorrelation Function[/C][/ROW]
[ROW][C]Time lag k[/C][C]ACF(k)[/C][C]T-STAT[/C][C]P-value[/C][/ROW]
[ROW][C]1[/C][C]0.863016[/C][C]7.3229[/C][C]0[/C][/ROW]
[ROW][C]2[/C][C]0.683752[/C][C]5.8018[/C][C]0[/C][/ROW]
[ROW][C]3[/C][C]0.505852[/C][C]4.2923[/C][C]2.7e-05[/C][/ROW]
[ROW][C]4[/C][C]0.356914[/C][C]3.0285[/C][C]0.001705[/C][/ROW]
[ROW][C]5[/C][C]0.231467[/C][C]1.9641[/C][C]0.026692[/C][/ROW]
[ROW][C]6[/C][C]0.122482[/C][C]1.0393[/C][C]0.151073[/C][/ROW]
[ROW][C]7[/C][C]0.029737[/C][C]0.2523[/C][C]0.400754[/C][/ROW]
[ROW][C]8[/C][C]-0.03828[/C][C]-0.3248[/C][C]0.37313[/C][/ROW]
[ROW][C]9[/C][C]-0.076911[/C][C]-0.6526[/C][C]0.258044[/C][/ROW]
[ROW][C]10[/C][C]-0.080829[/C][C]-0.6859[/C][C]0.247502[/C][/ROW]
[ROW][C]11[/C][C]-0.075816[/C][C]-0.6433[/C][C]0.261029[/C][/ROW]
[ROW][C]12[/C][C]-0.106148[/C][C]-0.9007[/C][C]0.185376[/C][/ROW]
[ROW][C]13[/C][C]-0.15812[/C][C]-1.3417[/C][C]0.091956[/C][/ROW]
[ROW][C]14[/C][C]-0.229403[/C][C]-1.9466[/C][C]0.027745[/C][/ROW]
[ROW][C]15[/C][C]-0.294614[/C][C]-2.4999[/C][C]0.007351[/C][/ROW]
[ROW][C]16[/C][C]-0.342245[/C][C]-2.904[/C][C]0.002444[/C][/ROW]
[ROW][C]17[/C][C]-0.364863[/C][C]-3.096[/C][C]0.001397[/C][/ROW]
[ROW][C]18[/C][C]-0.376961[/C][C]-3.1986[/C][C]0.001027[/C][/ROW]
[ROW][C]19[/C][C]-0.397356[/C][C]-3.3717[/C][C]0.000602[/C][/ROW]
[ROW][C]20[/C][C]-0.405023[/C][C]-3.4367[/C][C]0.000491[/C][/ROW]
[ROW][C]21[/C][C]-0.391837[/C][C]-3.3248[/C][C]0.000697[/C][/ROW]
[ROW][C]22[/C][C]-0.36091[/C][C]-3.0624[/C][C]0.001543[/C][/ROW]
[ROW][C]23[/C][C]-0.316841[/C][C]-2.6885[/C][C]0.004456[/C][/ROW]
[ROW][C]24[/C][C]-0.290313[/C][C]-2.4634[/C][C]0.008077[/C][/ROW]
[ROW][C]25[/C][C]-0.253378[/C][C]-2.15[/C][C]0.017458[/C][/ROW]
[ROW][C]26[/C][C]-0.231289[/C][C]-1.9626[/C][C]0.026781[/C][/ROW]
[ROW][C]27[/C][C]-0.202426[/C][C]-1.7176[/C][C]0.04508[/C][/ROW]
[ROW][C]28[/C][C]-0.151702[/C][C]-1.2872[/C][C]0.101067[/C][/ROW]
[ROW][C]29[/C][C]-0.091422[/C][C]-0.7757[/C][C]0.220222[/C][/ROW]
[ROW][C]30[/C][C]-0.013973[/C][C]-0.1186[/C][C]0.452974[/C][/ROW]
[ROW][C]31[/C][C]0.03735[/C][C]0.3169[/C][C]0.376107[/C][/ROW]
[ROW][C]32[/C][C]0.080478[/C][C]0.6829[/C][C]0.248438[/C][/ROW]
[ROW][C]33[/C][C]0.126335[/C][C]1.072[/C][C]0.143653[/C][/ROW]
[ROW][C]34[/C][C]0.185438[/C][C]1.5735[/C][C]0.059994[/C][/ROW]
[ROW][C]35[/C][C]0.251648[/C][C]2.1353[/C][C]0.018069[/C][/ROW]
[ROW][C]36[/C][C]0.302969[/C][C]2.5708[/C][C]0.006107[/C][/ROW]
[ROW][C]37[/C][C]0.283637[/C][C]2.4067[/C][C]0.009331[/C][/ROW]
[ROW][C]38[/C][C]0.255858[/C][C]2.171[/C][C]0.016613[/C][/ROW]
[ROW][C]39[/C][C]0.22534[/C][C]1.9121[/C][C]0.029923[/C][/ROW]
[ROW][C]40[/C][C]0.196359[/C][C]1.6662[/C][C]0.050013[/C][/ROW]
[ROW][C]41[/C][C]0.168978[/C][C]1.4338[/C][C]0.077975[/C][/ROW]
[ROW][C]42[/C][C]0.135768[/C][C]1.152[/C][C]0.12656[/C][/ROW]
[ROW][C]43[/C][C]0.104173[/C][C]0.8839[/C][C]0.189835[/C][/ROW]
[ROW][C]44[/C][C]0.075844[/C][C]0.6436[/C][C]0.260954[/C][/ROW]
[ROW][C]45[/C][C]0.05459[/C][C]0.4632[/C][C]0.322306[/C][/ROW]
[ROW][C]46[/C][C]0.04285[/C][C]0.3636[/C][C]0.358614[/C][/ROW]
[ROW][C]47[/C][C]0.035562[/C][C]0.3018[/C][C]0.381854[/C][/ROW]
[ROW][C]48[/C][C]0.03134[/C][C]0.2659[/C][C]0.395528[/C][/ROW]
[/TABLE]
Source: https://freestatistics.org/blog/index.php?pk=293657&T=1

Globally Unique Identifier (entire table): ba.freestatistics.org/blog/index.php?pk=293657&T=1

As an alternative you can also use a QR Code:  

The GUIDs for individual cells are displayed in the table below:

Autocorrelation Function
Time lag kACF(k)T-STATP-value
10.8630167.32290
20.6837525.80180
30.5058524.29232.7e-05
40.3569143.02850.001705
50.2314671.96410.026692
60.1224821.03930.151073
70.0297370.25230.400754
8-0.03828-0.32480.37313
9-0.076911-0.65260.258044
10-0.080829-0.68590.247502
11-0.075816-0.64330.261029
12-0.106148-0.90070.185376
13-0.15812-1.34170.091956
14-0.229403-1.94660.027745
15-0.294614-2.49990.007351
16-0.342245-2.9040.002444
17-0.364863-3.0960.001397
18-0.376961-3.19860.001027
19-0.397356-3.37170.000602
20-0.405023-3.43670.000491
21-0.391837-3.32480.000697
22-0.36091-3.06240.001543
23-0.316841-2.68850.004456
24-0.290313-2.46340.008077
25-0.253378-2.150.017458
26-0.231289-1.96260.026781
27-0.202426-1.71760.04508
28-0.151702-1.28720.101067
29-0.091422-0.77570.220222
30-0.013973-0.11860.452974
310.037350.31690.376107
320.0804780.68290.248438
330.1263351.0720.143653
340.1854381.57350.059994
350.2516482.13530.018069
360.3029692.57080.006107
370.2836372.40670.009331
380.2558582.1710.016613
390.225341.91210.029923
400.1963591.66620.050013
410.1689781.43380.077975
420.1357681.1520.12656
430.1041730.88390.189835
440.0758440.64360.260954
450.054590.46320.322306
460.042850.36360.358614
470.0355620.30180.381854
480.031340.26590.395528


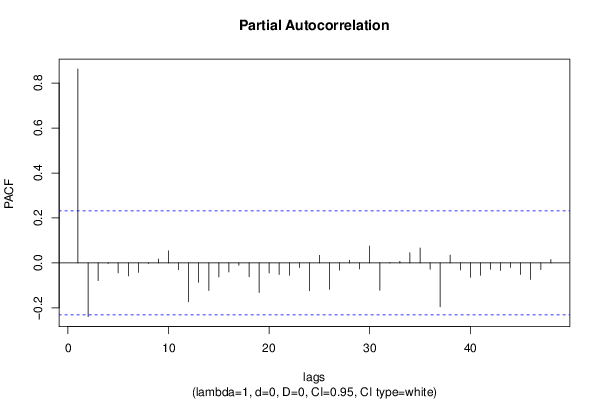
Partial Autocorrelation Function
Time lag kPACF(k)T-STATP-value
10.8630167.32290
2-0.239199-2.02970.023043
3-0.078774-0.66840.253001
4-0.002521-0.02140.491496
5-0.04446-0.37730.353546
6-0.057872-0.49110.312438
7-0.042081-0.35710.361041
8-0.002913-0.02470.490175
90.0170530.14470.442678
100.0535640.45450.325417
11-0.029879-0.25350.400289
12-0.172865-1.46680.073391
13-0.085897-0.72890.234227
14-0.122812-1.04210.150428
15-0.062782-0.53270.297932
16-0.040234-0.34140.366898
17-0.010467-0.08880.464739
18-0.061655-0.52320.301233
19-0.131678-1.11730.133785
20-0.044672-0.37910.352883
21-0.051957-0.44090.330315
22-0.055157-0.4680.320592
23-0.020578-0.17460.430939
24-0.124304-1.05480.147533
250.0336860.28580.387912
26-0.11724-0.99480.16158
27-0.032169-0.2730.392832
280.0121110.10280.459217
29-0.02655-0.22530.411198
300.0745990.6330.264372
31-0.122127-1.03630.151769
320.0020510.01740.493081
330.0068160.05780.47702
340.0451130.38280.3515
350.0663890.56330.28748
36-0.028445-0.24140.404981
37-0.195018-1.65480.051161
380.0347950.29520.384327
39-0.031003-0.26310.396624
40-0.064122-0.54410.294029
41-0.055143-0.46790.320634
42-0.028533-0.24210.404692
43-0.033708-0.2860.387841
44-0.020214-0.17150.432148
45-0.051764-0.43920.330905
46-0.0733-0.6220.267962
47-0.029818-0.2530.400488
480.0147940.12550.450228

\begin{tabular}{lllllllll}
\hline
Partial Autocorrelation Function \tabularnewline
Time lag k & PACF(k) & T-STAT & P-value \tabularnewline
1 & 0.863016 & 7.3229 & 0 \tabularnewline
2 & -0.239199 & -2.0297 & 0.023043 \tabularnewline
3 & -0.078774 & -0.6684 & 0.253001 \tabularnewline
4 & -0.002521 & -0.0214 & 0.491496 \tabularnewline
5 & -0.04446 & -0.3773 & 0.353546 \tabularnewline
6 & -0.057872 & -0.4911 & 0.312438 \tabularnewline
7 & -0.042081 & -0.3571 & 0.361041 \tabularnewline
8 & -0.002913 & -0.0247 & 0.490175 \tabularnewline
9 & 0.017053 & 0.1447 & 0.442678 \tabularnewline
10 & 0.053564 & 0.4545 & 0.325417 \tabularnewline
11 & -0.029879 & -0.2535 & 0.400289 \tabularnewline
12 & -0.172865 & -1.4668 & 0.073391 \tabularnewline
13 & -0.085897 & -0.7289 & 0.234227 \tabularnewline
14 & -0.122812 & -1.0421 & 0.150428 \tabularnewline
15 & -0.062782 & -0.5327 & 0.297932 \tabularnewline
16 & -0.040234 & -0.3414 & 0.366898 \tabularnewline
17 & -0.010467 & -0.0888 & 0.464739 \tabularnewline
18 & -0.061655 & -0.5232 & 0.301233 \tabularnewline
19 & -0.131678 & -1.1173 & 0.133785 \tabularnewline
20 & -0.044672 & -0.3791 & 0.352883 \tabularnewline
21 & -0.051957 & -0.4409 & 0.330315 \tabularnewline
22 & -0.055157 & -0.468 & 0.320592 \tabularnewline
23 & -0.020578 & -0.1746 & 0.430939 \tabularnewline
24 & -0.124304 & -1.0548 & 0.147533 \tabularnewline
25 & 0.033686 & 0.2858 & 0.387912 \tabularnewline
26 & -0.11724 & -0.9948 & 0.16158 \tabularnewline
27 & -0.032169 & -0.273 & 0.392832 \tabularnewline
28 & 0.012111 & 0.1028 & 0.459217 \tabularnewline
29 & -0.02655 & -0.2253 & 0.411198 \tabularnewline
30 & 0.074599 & 0.633 & 0.264372 \tabularnewline
31 & -0.122127 & -1.0363 & 0.151769 \tabularnewline
32 & 0.002051 & 0.0174 & 0.493081 \tabularnewline
33 & 0.006816 & 0.0578 & 0.47702 \tabularnewline
34 & 0.045113 & 0.3828 & 0.3515 \tabularnewline
35 & 0.066389 & 0.5633 & 0.28748 \tabularnewline
36 & -0.028445 & -0.2414 & 0.404981 \tabularnewline
37 & -0.195018 & -1.6548 & 0.051161 \tabularnewline
38 & 0.034795 & 0.2952 & 0.384327 \tabularnewline
39 & -0.031003 & -0.2631 & 0.396624 \tabularnewline
40 & -0.064122 & -0.5441 & 0.294029 \tabularnewline
41 & -0.055143 & -0.4679 & 0.320634 \tabularnewline
42 & -0.028533 & -0.2421 & 0.404692 \tabularnewline
43 & -0.033708 & -0.286 & 0.387841 \tabularnewline
44 & -0.020214 & -0.1715 & 0.432148 \tabularnewline
45 & -0.051764 & -0.4392 & 0.330905 \tabularnewline
46 & -0.0733 & -0.622 & 0.267962 \tabularnewline
47 & -0.029818 & -0.253 & 0.400488 \tabularnewline
48 & 0.014794 & 0.1255 & 0.450228 \tabularnewline
\hline
\end{tabular}
%Source: https://freestatistics.org/blog/index.php?pk=293657&T=2

[TABLE]
[ROW][C]Partial Autocorrelation Function[/C][/ROW]
[ROW][C]Time lag k[/C][C]PACF(k)[/C][C]T-STAT[/C][C]P-value[/C][/ROW]
[ROW][C]1[/C][C]0.863016[/C][C]7.3229[/C][C]0[/C][/ROW]
[ROW][C]2[/C][C]-0.239199[/C][C]-2.0297[/C][C]0.023043[/C][/ROW]
[ROW][C]3[/C][C]-0.078774[/C][C]-0.6684[/C][C]0.253001[/C][/ROW]
[ROW][C]4[/C][C]-0.002521[/C][C]-0.0214[/C][C]0.491496[/C][/ROW]
[ROW][C]5[/C][C]-0.04446[/C][C]-0.3773[/C][C]0.353546[/C][/ROW]
[ROW][C]6[/C][C]-0.057872[/C][C]-0.4911[/C][C]0.312438[/C][/ROW]
[ROW][C]7[/C][C]-0.042081[/C][C]-0.3571[/C][C]0.361041[/C][/ROW]
[ROW][C]8[/C][C]-0.002913[/C][C]-0.0247[/C][C]0.490175[/C][/ROW]
[ROW][C]9[/C][C]0.017053[/C][C]0.1447[/C][C]0.442678[/C][/ROW]
[ROW][C]10[/C][C]0.053564[/C][C]0.4545[/C][C]0.325417[/C][/ROW]
[ROW][C]11[/C][C]-0.029879[/C][C]-0.2535[/C][C]0.400289[/C][/ROW]
[ROW][C]12[/C][C]-0.172865[/C][C]-1.4668[/C][C]0.073391[/C][/ROW]
[ROW][C]13[/C][C]-0.085897[/C][C]-0.7289[/C][C]0.234227[/C][/ROW]
[ROW][C]14[/C][C]-0.122812[/C][C]-1.0421[/C][C]0.150428[/C][/ROW]
[ROW][C]15[/C][C]-0.062782[/C][C]-0.5327[/C][C]0.297932[/C][/ROW]
[ROW][C]16[/C][C]-0.040234[/C][C]-0.3414[/C][C]0.366898[/C][/ROW]
[ROW][C]17[/C][C]-0.010467[/C][C]-0.0888[/C][C]0.464739[/C][/ROW]
[ROW][C]18[/C][C]-0.061655[/C][C]-0.5232[/C][C]0.301233[/C][/ROW]
[ROW][C]19[/C][C]-0.131678[/C][C]-1.1173[/C][C]0.133785[/C][/ROW]
[ROW][C]20[/C][C]-0.044672[/C][C]-0.3791[/C][C]0.352883[/C][/ROW]
[ROW][C]21[/C][C]-0.051957[/C][C]-0.4409[/C][C]0.330315[/C][/ROW]
[ROW][C]22[/C][C]-0.055157[/C][C]-0.468[/C][C]0.320592[/C][/ROW]
[ROW][C]23[/C][C]-0.020578[/C][C]-0.1746[/C][C]0.430939[/C][/ROW]
[ROW][C]24[/C][C]-0.124304[/C][C]-1.0548[/C][C]0.147533[/C][/ROW]
[ROW][C]25[/C][C]0.033686[/C][C]0.2858[/C][C]0.387912[/C][/ROW]
[ROW][C]26[/C][C]-0.11724[/C][C]-0.9948[/C][C]0.16158[/C][/ROW]
[ROW][C]27[/C][C]-0.032169[/C][C]-0.273[/C][C]0.392832[/C][/ROW]
[ROW][C]28[/C][C]0.012111[/C][C]0.1028[/C][C]0.459217[/C][/ROW]
[ROW][C]29[/C][C]-0.02655[/C][C]-0.2253[/C][C]0.411198[/C][/ROW]
[ROW][C]30[/C][C]0.074599[/C][C]0.633[/C][C]0.264372[/C][/ROW]
[ROW][C]31[/C][C]-0.122127[/C][C]-1.0363[/C][C]0.151769[/C][/ROW]
[ROW][C]32[/C][C]0.002051[/C][C]0.0174[/C][C]0.493081[/C][/ROW]
[ROW][C]33[/C][C]0.006816[/C][C]0.0578[/C][C]0.47702[/C][/ROW]
[ROW][C]34[/C][C]0.045113[/C][C]0.3828[/C][C]0.3515[/C][/ROW]
[ROW][C]35[/C][C]0.066389[/C][C]0.5633[/C][C]0.28748[/C][/ROW]
[ROW][C]36[/C][C]-0.028445[/C][C]-0.2414[/C][C]0.404981[/C][/ROW]
[ROW][C]37[/C][C]-0.195018[/C][C]-1.6548[/C][C]0.051161[/C][/ROW]
[ROW][C]38[/C][C]0.034795[/C][C]0.2952[/C][C]0.384327[/C][/ROW]
[ROW][C]39[/C][C]-0.031003[/C][C]-0.2631[/C][C]0.396624[/C][/ROW]
[ROW][C]40[/C][C]-0.064122[/C][C]-0.5441[/C][C]0.294029[/C][/ROW]
[ROW][C]41[/C][C]-0.055143[/C][C]-0.4679[/C][C]0.320634[/C][/ROW]
[ROW][C]42[/C][C]-0.028533[/C][C]-0.2421[/C][C]0.404692[/C][/ROW]
[ROW][C]43[/C][C]-0.033708[/C][C]-0.286[/C][C]0.387841[/C][/ROW]
[ROW][C]44[/C][C]-0.020214[/C][C]-0.1715[/C][C]0.432148[/C][/ROW]
[ROW][C]45[/C][C]-0.051764[/C][C]-0.4392[/C][C]0.330905[/C][/ROW]
[ROW][C]46[/C][C]-0.0733[/C][C]-0.622[/C][C]0.267962[/C][/ROW]
[ROW][C]47[/C][C]-0.029818[/C][C]-0.253[/C][C]0.400488[/C][/ROW]
[ROW][C]48[/C][C]0.014794[/C][C]0.1255[/C][C]0.450228[/C][/ROW]
[/TABLE]
Source: https://freestatistics.org/blog/index.php?pk=293657&T=2

Globally Unique Identifier (entire table): ba.freestatistics.org/blog/index.php?pk=293657&T=2

As an alternative you can also use a QR Code:  

The GUIDs for individual cells are displayed in the table below:

Partial Autocorrelation Function
Time lag kPACF(k)T-STATP-value
10.8630167.32290
2-0.239199-2.02970.023043
3-0.078774-0.66840.253001
4-0.002521-0.02140.491496
5-0.04446-0.37730.353546
6-0.057872-0.49110.312438
7-0.042081-0.35710.361041
8-0.002913-0.02470.490175
90.0170530.14470.442678
100.0535640.45450.325417
11-0.029879-0.25350.400289
12-0.172865-1.46680.073391
13-0.085897-0.72890.234227
14-0.122812-1.04210.150428
15-0.062782-0.53270.297932
16-0.040234-0.34140.366898
17-0.010467-0.08880.464739
18-0.061655-0.52320.301233
19-0.131678-1.11730.133785
20-0.044672-0.37910.352883
21-0.051957-0.44090.330315
22-0.055157-0.4680.320592
23-0.020578-0.17460.430939
24-0.124304-1.05480.147533
250.0336860.28580.387912
26-0.11724-0.99480.16158
27-0.032169-0.2730.392832
280.0121110.10280.459217
29-0.02655-0.22530.411198
300.0745990.6330.264372
31-0.122127-1.03630.151769
320.0020510.01740.493081
330.0068160.05780.47702
340.0451130.38280.3515
350.0663890.56330.28748
36-0.028445-0.24140.404981
37-0.195018-1.65480.051161
380.0347950.29520.384327
39-0.031003-0.26310.396624
40-0.064122-0.54410.294029
41-0.055143-0.46790.320634
42-0.028533-0.24210.404692
43-0.033708-0.2860.387841
44-0.020214-0.17150.432148
45-0.051764-0.43920.330905
46-0.0733-0.6220.267962
47-0.029818-0.2530.400488
480.0147940.12550.450228


Parameters (Session):
par1 = 48 ; par2 = 1 ; par3 = 0 ; par4 = 0 ; par5 = 12 ; par6 = White Noise ; par7 = 0.95 ;
Parameters (R input):
par1 = 48 ; par2 = 1 ; par3 = 0 ; par4 = 0 ; par5 = 12 ; par6 = White Noise ; par7 = 0.95 ; par8 = ;
R code (references can be found in the software module):
par8 <- ''
par7 <- '0.95'
par6 <- 'White Noise'
par5 <- '12'
par4 <- '0'
par3 <- '1'
par2 <- '1'
par1 <- '48'
if (par1 == 'Default') {
par1 = 10*log10(length(x))
} else {
par1 <- as.numeric(par1)
}
par2 <- as.numeric(par2)
par3 <- as.numeric(par3)
par4 <- as.numeric(par4)
par5 <- as.numeric(par5)
if (par6 == 'White Noise') par6 <- 'white' else par6 <- 'ma'
par7 <- as.numeric(par7)
if (par8 != '') par8 <- as.numeric(par8)
x <- na.omit(x)
ox <- x
if (par8 == '') {
if (par2 == 0) {
x <- log(x)
} else {
x <- (x ^ par2 - 1) / par2
}
} else {
x <- log(x,base=par8)
}
if (par3 > 0) x <- diff(x,lag=1,difference=par3)
if (par4 > 0) x <- diff(x,lag=par5,difference=par4)
bitmap(file='picts.png')
op <- par(mfrow=c(2,1))
plot(ox,type='l',main='Original Time Series',xlab='time',ylab='value')
if (par8=='') {
mytitle <- paste('Working Time Series (lambda=',par2,', d=',par3,', D=',par4,')',sep='')
mysub <- paste('(lambda=',par2,', d=',par3,', D=',par4,', CI=', par7, ', CI type=',par6,')',sep='')
} else {
mytitle <- paste('Working Time Series (base=',par8,', d=',par3,', D=',par4,')',sep='')
mysub <- paste('(base=',par8,', d=',par3,', D=',par4,', CI=', par7, ', CI type=',par6,')',sep='')
}
plot(x,type='l', main=mytitle,xlab='time',ylab='value')
par(op)
dev.off()
bitmap(file='pic1.png')
racf <- acf(x, par1, main='Autocorrelation', xlab='time lag', ylab='ACF', ci.type=par6, ci=par7, sub=mysub)
dev.off()
bitmap(file='pic2.png')
rpacf <- pacf(x,par1,main='Partial Autocorrelation',xlab='lags',ylab='PACF',sub=mysub)
dev.off()
(myacf <- c(racf$acf))
(mypacf <- c(rpacf$acf))
lengthx <- length(x)
sqrtn <- sqrt(lengthx)
load(file='createtable')
a<-table.start()
a<-table.row.start(a)
a<-table.element(a,'Autocorrelation Function',4,TRUE)
a<-table.row.end(a)
a<-table.row.start(a)
a<-table.element(a,'Time lag k',header=TRUE)
a<-table.element(a,hyperlink('basics.htm','ACF(k)','click here for more information about the Autocorrelation Function'),header=TRUE)
a<-table.element(a,'T-STAT',header=TRUE)
a<-table.element(a,'P-value',header=TRUE)
a<-table.row.end(a)
for (i in 2:(par1+1)) {
a<-table.row.start(a)
a<-table.element(a,i-1,header=TRUE)
a<-table.element(a,round(myacf[i],6))
mytstat <- myacf[i]*sqrtn
a<-table.element(a,round(mytstat,4))
a<-table.element(a,round(1-pt(abs(mytstat),lengthx),6))
a<-table.row.end(a)
}
a<-table.end(a)
table.save(a,file='mytable.tab')
a<-table.start()
a<-table.row.start(a)
a<-table.element(a,'Partial Autocorrelation Function',4,TRUE)
a<-table.row.end(a)
a<-table.row.start(a)
a<-table.element(a,'Time lag k',header=TRUE)
a<-table.element(a,hyperlink('basics.htm','PACF(k)','click here for more information about the Partial Autocorrelation Function'),header=TRUE)
a<-table.element(a,'T-STAT',header=TRUE)
a<-table.element(a,'P-value',header=TRUE)
a<-table.row.end(a)
for (i in 1:par1) {
a<-table.row.start(a)
a<-table.element(a,i,header=TRUE)
a<-table.element(a,round(mypacf[i],6))
mytstat <- mypacf[i]*sqrtn
a<-table.element(a,round(mytstat,4))
a<-table.element(a,round(1-pt(abs(mytstat),lengthx),6))
a<-table.row.end(a)
}
a<-table.end(a)
table.save(a,file='mytable1.tab')