Free Statistics

of Irreproducible Research!

Author's title

Author*Unverified author*
R Software Modulerwasp_autocorrelation.wasp
Title produced by software(Partial) Autocorrelation Function
Date of computationTue, 08 Mar 2016 10:02:50 +0000
Cite this page as followsStatistical Computations at FreeStatistics.org, Office for Research Development and Education, URL https://freestatistics.org/blog/index.php?v=date/2016/Mar/08/t14574315547szacijwls7utd9.htm/, Retrieved Mon, 29 Apr 2024 05:12:36 +0000
Statistical Computations at FreeStatistics.org, Office for Research Development and Education, URL https://freestatistics.org/blog/index.php?pk=293660, Retrieved Mon, 29 Apr 2024 05:12:36 +0000
QR Codes:

Original text written by user:
IsPrivate?No (this computation is public)
User-defined keywords
Estimated Impact104
Family? (F = Feedback message, R = changed R code, M = changed R Module, P = changed Parameters, D = changed Data)
-       [(Partial) Autocorrelation Function] [] [2016-03-08 10:02:50] [409a9d71664281dd1fd3bb0995266dd0] [Current]
Feedback Forum

Post a new message
Dataseries X:
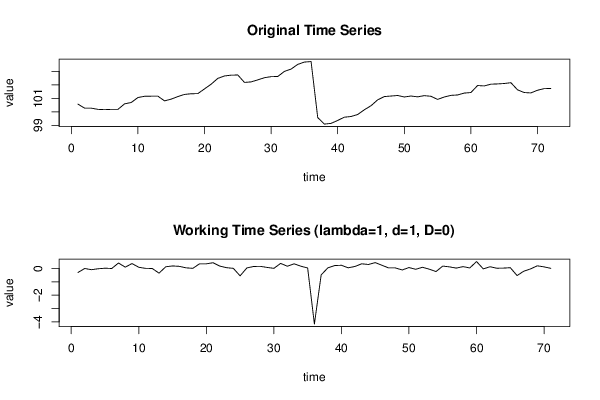
100.57
100.27
100.27
100.18
100.16
100.18
100.18
100.59
100.69
101.06
101.15
101.16
101.16
100.81
100.94
101.13
101.29
101.34
101.35
101.7
102.05
102.48
102.66
102.72
102.73
102.18
102.22
102.37
102.53
102.61
102.62
103
103.17
103.52
103.69
103.73
99.57
99.09
99.14
99.36
99.6
99.65
99.8
100.15
100.45
100.89
101.13
101.17
101.21
101.1
101.17
101.11
101.2
101.15
100.92
101.1
101.22
101.25
101.39
101.43
101.95
101.92
102.05
102.07
102.1
102.16
101.63
101.43
101.4
101.6
101.72
101.73


Summary of computational transaction
Raw Inputview raw input (R code)
Raw Outputview raw output of R engine
Computing time1 seconds
R Server'George Udny Yule' @ yule.wessa.net
R Framework error message
Warning: there are blank lines in the 'Data' field.
Please, use NA for missing data - blank lines are simply
 deleted and are NOT treated as missing values.

\begin{tabular}{lllllllll}
\hline
Summary of computational transaction \tabularnewline
Raw Input & view raw input (R code)  \tabularnewline
Raw Output & view raw output of R engine  \tabularnewline
Computing time & 1 seconds \tabularnewline
R Server & 'George Udny Yule' @ yule.wessa.net \tabularnewline
R Framework error message & 
Warning: there are blank lines in the 'Data' field.
Please, use NA for missing data - blank lines are simply
 deleted and are NOT treated as missing values.
\tabularnewline \hline \end{tabular} %Source: https://freestatistics.org/blog/index.php?pk=293660&T=0

[TABLE]
[ROW][C]Summary of computational transaction[/C][/ROW]
[ROW][C]Raw Input[/C][C]view raw input (R code) [/C][/ROW]
[ROW][C]Raw Output[/C][C]view raw output of R engine [/C][/ROW]
[ROW][C]Computing time[/C][C]1 seconds[/C][/ROW]
[ROW][C]R Server[/C][C]'George Udny Yule' @ yule.wessa.net[/C][/ROW]
[ROW][C]R Framework error message[/C][C]
Warning: there are blank lines in the 'Data' field.
Please, use NA for missing data - blank lines are simply
 deleted and are NOT treated as missing values.
[/C][/ROW] [/TABLE] Source: https://freestatistics.org/blog/index.php?pk=293660&T=0

Globally Unique Identifier (entire table): ba.freestatistics.org/blog/index.php?pk=293660&T=0

As an alternative you can also use a QR Code:  

The GUIDs for individual cells are displayed in the table below:

Summary of computational transaction
Raw Inputview raw input (R code)
Raw Outputview raw output of R engine
Computing time1 seconds
R Server'George Udny Yule' @ yule.wessa.net
R Framework error message
Warning: there are blank lines in the 'Data' field.
Please, use NA for missing data - blank lines are simply
 deleted and are NOT treated as missing values.


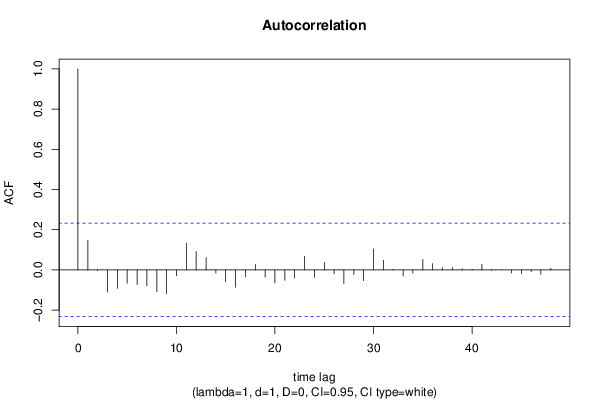
Autocorrelation Function
Time lag kACF(k)T-STATP-value
10.1478981.24620.108392
2-0.003976-0.03350.486685
3-0.110193-0.92850.178146
4-0.091261-0.7690.222229
5-0.066537-0.56070.2884
6-0.073084-0.61580.269993
7-0.078499-0.66140.255234
8-0.10813-0.91110.182659
9-0.118141-0.99550.161444
10-0.028747-0.24220.40465
110.1328091.11910.133441
120.0913270.76950.222065
130.0602050.50730.306758
14-0.015939-0.13430.446771
15-0.059169-0.49860.309814
16-0.086518-0.7290.234195
17-0.034454-0.29030.38621
180.0273670.23060.409143
19-0.035957-0.3030.381397
20-0.063735-0.5370.296459
21-0.051534-0.43420.332719
22-0.040783-0.34360.366065
230.067440.56830.285826
24-0.037338-0.31460.376988
250.0370030.31180.378055
26-0.018918-0.15940.436902
27-0.067706-0.57050.28507
28-0.023058-0.19430.423251
29-0.053567-0.45140.326551
300.1040230.87650.191853
310.0483660.40750.34242
320.0030990.02610.48962
33-0.029954-0.25240.400732
34-0.016447-0.13860.445086
350.0516260.4350.332437
360.0307160.25880.398264
370.0107820.09090.463933
380.0114830.09680.461595
390.0054420.04590.481777
400.0028660.02410.490401
410.0282060.23770.406412
42-0.00311-0.02620.489585
43-0.000273-0.00230.499084
44-0.014699-0.12390.45089
45-0.018461-0.15560.438414
46-0.008599-0.07250.471223
47-0.022307-0.1880.42572
480.0081780.06890.472628

\begin{tabular}{lllllllll}
\hline
Autocorrelation Function \tabularnewline
Time lag k & ACF(k) & T-STAT & P-value \tabularnewline
1 & 0.147898 & 1.2462 & 0.108392 \tabularnewline
2 & -0.003976 & -0.0335 & 0.486685 \tabularnewline
3 & -0.110193 & -0.9285 & 0.178146 \tabularnewline
4 & -0.091261 & -0.769 & 0.222229 \tabularnewline
5 & -0.066537 & -0.5607 & 0.2884 \tabularnewline
6 & -0.073084 & -0.6158 & 0.269993 \tabularnewline
7 & -0.078499 & -0.6614 & 0.255234 \tabularnewline
8 & -0.10813 & -0.9111 & 0.182659 \tabularnewline
9 & -0.118141 & -0.9955 & 0.161444 \tabularnewline
10 & -0.028747 & -0.2422 & 0.40465 \tabularnewline
11 & 0.132809 & 1.1191 & 0.133441 \tabularnewline
12 & 0.091327 & 0.7695 & 0.222065 \tabularnewline
13 & 0.060205 & 0.5073 & 0.306758 \tabularnewline
14 & -0.015939 & -0.1343 & 0.446771 \tabularnewline
15 & -0.059169 & -0.4986 & 0.309814 \tabularnewline
16 & -0.086518 & -0.729 & 0.234195 \tabularnewline
17 & -0.034454 & -0.2903 & 0.38621 \tabularnewline
18 & 0.027367 & 0.2306 & 0.409143 \tabularnewline
19 & -0.035957 & -0.303 & 0.381397 \tabularnewline
20 & -0.063735 & -0.537 & 0.296459 \tabularnewline
21 & -0.051534 & -0.4342 & 0.332719 \tabularnewline
22 & -0.040783 & -0.3436 & 0.366065 \tabularnewline
23 & 0.06744 & 0.5683 & 0.285826 \tabularnewline
24 & -0.037338 & -0.3146 & 0.376988 \tabularnewline
25 & 0.037003 & 0.3118 & 0.378055 \tabularnewline
26 & -0.018918 & -0.1594 & 0.436902 \tabularnewline
27 & -0.067706 & -0.5705 & 0.28507 \tabularnewline
28 & -0.023058 & -0.1943 & 0.423251 \tabularnewline
29 & -0.053567 & -0.4514 & 0.326551 \tabularnewline
30 & 0.104023 & 0.8765 & 0.191853 \tabularnewline
31 & 0.048366 & 0.4075 & 0.34242 \tabularnewline
32 & 0.003099 & 0.0261 & 0.48962 \tabularnewline
33 & -0.029954 & -0.2524 & 0.400732 \tabularnewline
34 & -0.016447 & -0.1386 & 0.445086 \tabularnewline
35 & 0.051626 & 0.435 & 0.332437 \tabularnewline
36 & 0.030716 & 0.2588 & 0.398264 \tabularnewline
37 & 0.010782 & 0.0909 & 0.463933 \tabularnewline
38 & 0.011483 & 0.0968 & 0.461595 \tabularnewline
39 & 0.005442 & 0.0459 & 0.481777 \tabularnewline
40 & 0.002866 & 0.0241 & 0.490401 \tabularnewline
41 & 0.028206 & 0.2377 & 0.406412 \tabularnewline
42 & -0.00311 & -0.0262 & 0.489585 \tabularnewline
43 & -0.000273 & -0.0023 & 0.499084 \tabularnewline
44 & -0.014699 & -0.1239 & 0.45089 \tabularnewline
45 & -0.018461 & -0.1556 & 0.438414 \tabularnewline
46 & -0.008599 & -0.0725 & 0.471223 \tabularnewline
47 & -0.022307 & -0.188 & 0.42572 \tabularnewline
48 & 0.008178 & 0.0689 & 0.472628 \tabularnewline
\hline
\end{tabular}
%Source: https://freestatistics.org/blog/index.php?pk=293660&T=1

[TABLE]
[ROW][C]Autocorrelation Function[/C][/ROW]
[ROW][C]Time lag k[/C][C]ACF(k)[/C][C]T-STAT[/C][C]P-value[/C][/ROW]
[ROW][C]1[/C][C]0.147898[/C][C]1.2462[/C][C]0.108392[/C][/ROW]
[ROW][C]2[/C][C]-0.003976[/C][C]-0.0335[/C][C]0.486685[/C][/ROW]
[ROW][C]3[/C][C]-0.110193[/C][C]-0.9285[/C][C]0.178146[/C][/ROW]
[ROW][C]4[/C][C]-0.091261[/C][C]-0.769[/C][C]0.222229[/C][/ROW]
[ROW][C]5[/C][C]-0.066537[/C][C]-0.5607[/C][C]0.2884[/C][/ROW]
[ROW][C]6[/C][C]-0.073084[/C][C]-0.6158[/C][C]0.269993[/C][/ROW]
[ROW][C]7[/C][C]-0.078499[/C][C]-0.6614[/C][C]0.255234[/C][/ROW]
[ROW][C]8[/C][C]-0.10813[/C][C]-0.9111[/C][C]0.182659[/C][/ROW]
[ROW][C]9[/C][C]-0.118141[/C][C]-0.9955[/C][C]0.161444[/C][/ROW]
[ROW][C]10[/C][C]-0.028747[/C][C]-0.2422[/C][C]0.40465[/C][/ROW]
[ROW][C]11[/C][C]0.132809[/C][C]1.1191[/C][C]0.133441[/C][/ROW]
[ROW][C]12[/C][C]0.091327[/C][C]0.7695[/C][C]0.222065[/C][/ROW]
[ROW][C]13[/C][C]0.060205[/C][C]0.5073[/C][C]0.306758[/C][/ROW]
[ROW][C]14[/C][C]-0.015939[/C][C]-0.1343[/C][C]0.446771[/C][/ROW]
[ROW][C]15[/C][C]-0.059169[/C][C]-0.4986[/C][C]0.309814[/C][/ROW]
[ROW][C]16[/C][C]-0.086518[/C][C]-0.729[/C][C]0.234195[/C][/ROW]
[ROW][C]17[/C][C]-0.034454[/C][C]-0.2903[/C][C]0.38621[/C][/ROW]
[ROW][C]18[/C][C]0.027367[/C][C]0.2306[/C][C]0.409143[/C][/ROW]
[ROW][C]19[/C][C]-0.035957[/C][C]-0.303[/C][C]0.381397[/C][/ROW]
[ROW][C]20[/C][C]-0.063735[/C][C]-0.537[/C][C]0.296459[/C][/ROW]
[ROW][C]21[/C][C]-0.051534[/C][C]-0.4342[/C][C]0.332719[/C][/ROW]
[ROW][C]22[/C][C]-0.040783[/C][C]-0.3436[/C][C]0.366065[/C][/ROW]
[ROW][C]23[/C][C]0.06744[/C][C]0.5683[/C][C]0.285826[/C][/ROW]
[ROW][C]24[/C][C]-0.037338[/C][C]-0.3146[/C][C]0.376988[/C][/ROW]
[ROW][C]25[/C][C]0.037003[/C][C]0.3118[/C][C]0.378055[/C][/ROW]
[ROW][C]26[/C][C]-0.018918[/C][C]-0.1594[/C][C]0.436902[/C][/ROW]
[ROW][C]27[/C][C]-0.067706[/C][C]-0.5705[/C][C]0.28507[/C][/ROW]
[ROW][C]28[/C][C]-0.023058[/C][C]-0.1943[/C][C]0.423251[/C][/ROW]
[ROW][C]29[/C][C]-0.053567[/C][C]-0.4514[/C][C]0.326551[/C][/ROW]
[ROW][C]30[/C][C]0.104023[/C][C]0.8765[/C][C]0.191853[/C][/ROW]
[ROW][C]31[/C][C]0.048366[/C][C]0.4075[/C][C]0.34242[/C][/ROW]
[ROW][C]32[/C][C]0.003099[/C][C]0.0261[/C][C]0.48962[/C][/ROW]
[ROW][C]33[/C][C]-0.029954[/C][C]-0.2524[/C][C]0.400732[/C][/ROW]
[ROW][C]34[/C][C]-0.016447[/C][C]-0.1386[/C][C]0.445086[/C][/ROW]
[ROW][C]35[/C][C]0.051626[/C][C]0.435[/C][C]0.332437[/C][/ROW]
[ROW][C]36[/C][C]0.030716[/C][C]0.2588[/C][C]0.398264[/C][/ROW]
[ROW][C]37[/C][C]0.010782[/C][C]0.0909[/C][C]0.463933[/C][/ROW]
[ROW][C]38[/C][C]0.011483[/C][C]0.0968[/C][C]0.461595[/C][/ROW]
[ROW][C]39[/C][C]0.005442[/C][C]0.0459[/C][C]0.481777[/C][/ROW]
[ROW][C]40[/C][C]0.002866[/C][C]0.0241[/C][C]0.490401[/C][/ROW]
[ROW][C]41[/C][C]0.028206[/C][C]0.2377[/C][C]0.406412[/C][/ROW]
[ROW][C]42[/C][C]-0.00311[/C][C]-0.0262[/C][C]0.489585[/C][/ROW]
[ROW][C]43[/C][C]-0.000273[/C][C]-0.0023[/C][C]0.499084[/C][/ROW]
[ROW][C]44[/C][C]-0.014699[/C][C]-0.1239[/C][C]0.45089[/C][/ROW]
[ROW][C]45[/C][C]-0.018461[/C][C]-0.1556[/C][C]0.438414[/C][/ROW]
[ROW][C]46[/C][C]-0.008599[/C][C]-0.0725[/C][C]0.471223[/C][/ROW]
[ROW][C]47[/C][C]-0.022307[/C][C]-0.188[/C][C]0.42572[/C][/ROW]
[ROW][C]48[/C][C]0.008178[/C][C]0.0689[/C][C]0.472628[/C][/ROW]
[/TABLE]
Source: https://freestatistics.org/blog/index.php?pk=293660&T=1

Globally Unique Identifier (entire table): ba.freestatistics.org/blog/index.php?pk=293660&T=1

As an alternative you can also use a QR Code:  

The GUIDs for individual cells are displayed in the table below:

Autocorrelation Function
Time lag kACF(k)T-STATP-value
10.1478981.24620.108392
2-0.003976-0.03350.486685
3-0.110193-0.92850.178146
4-0.091261-0.7690.222229
5-0.066537-0.56070.2884
6-0.073084-0.61580.269993
7-0.078499-0.66140.255234
8-0.10813-0.91110.182659
9-0.118141-0.99550.161444
10-0.028747-0.24220.40465
110.1328091.11910.133441
120.0913270.76950.222065
130.0602050.50730.306758
14-0.015939-0.13430.446771
15-0.059169-0.49860.309814
16-0.086518-0.7290.234195
17-0.034454-0.29030.38621
180.0273670.23060.409143
19-0.035957-0.3030.381397
20-0.063735-0.5370.296459
21-0.051534-0.43420.332719
22-0.040783-0.34360.366065
230.067440.56830.285826
24-0.037338-0.31460.376988
250.0370030.31180.378055
26-0.018918-0.15940.436902
27-0.067706-0.57050.28507
28-0.023058-0.19430.423251
29-0.053567-0.45140.326551
300.1040230.87650.191853
310.0483660.40750.34242
320.0030990.02610.48962
33-0.029954-0.25240.400732
34-0.016447-0.13860.445086
350.0516260.4350.332437
360.0307160.25880.398264
370.0107820.09090.463933
380.0114830.09680.461595
390.0054420.04590.481777
400.0028660.02410.490401
410.0282060.23770.406412
42-0.00311-0.02620.489585
43-0.000273-0.00230.499084
44-0.014699-0.12390.45089
45-0.018461-0.15560.438414
46-0.008599-0.07250.471223
47-0.022307-0.1880.42572
480.0081780.06890.472628


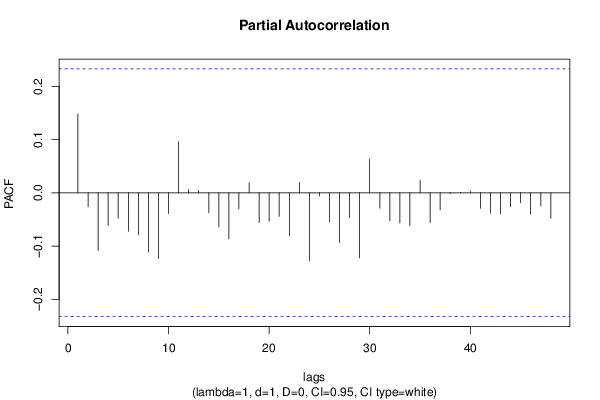
Partial Autocorrelation Function
Time lag kPACF(k)T-STATP-value
10.1478981.24620.108392
2-0.026427-0.22270.412211
3-0.10812-0.9110.18268
4-0.060969-0.51370.304518
5-0.047892-0.40350.343879
6-0.072182-0.60820.272493
7-0.078672-0.66290.25477
8-0.111315-0.9380.175722
9-0.123713-1.04240.150375
10-0.039059-0.32910.371518
110.0964840.8130.209471
120.0060120.05070.479869
130.0042960.03620.485613
14-0.037372-0.31490.376879
15-0.063705-0.53680.296545
16-0.086523-0.72910.234184
17-0.030411-0.25620.399251
180.0188060.15850.437271
19-0.055664-0.4690.320243
20-0.053473-0.45060.326836
21-0.044329-0.37350.354935
22-0.080927-0.68190.248759
230.0194580.1640.435117
24-0.127667-1.07570.142843
25-0.006018-0.05070.479851
26-0.054429-0.45860.323951
27-0.093278-0.7860.217248
28-0.046585-0.39250.34792
29-0.122034-1.02830.153654
300.0628260.52940.299095
31-0.029012-0.24450.403791
32-0.052526-0.44260.329704
33-0.056846-0.4790.316709
34-0.061984-0.52230.301547
350.0234810.19790.421863
36-0.055948-0.47140.319391
37-0.032078-0.27030.393859
38-0.001711-0.01440.494269
390.0002870.00240.499037
400.0026620.02240.491082
41-0.029073-0.2450.403591
42-0.03828-0.32260.373992
43-0.039584-0.33350.369853
44-0.026343-0.2220.412488
45-0.018748-0.1580.437464
46-0.040038-0.33740.368419
47-0.024705-0.20820.417848
48-0.047691-0.40190.3445

\begin{tabular}{lllllllll}
\hline
Partial Autocorrelation Function \tabularnewline
Time lag k & PACF(k) & T-STAT & P-value \tabularnewline
1 & 0.147898 & 1.2462 & 0.108392 \tabularnewline
2 & -0.026427 & -0.2227 & 0.412211 \tabularnewline
3 & -0.10812 & -0.911 & 0.18268 \tabularnewline
4 & -0.060969 & -0.5137 & 0.304518 \tabularnewline
5 & -0.047892 & -0.4035 & 0.343879 \tabularnewline
6 & -0.072182 & -0.6082 & 0.272493 \tabularnewline
7 & -0.078672 & -0.6629 & 0.25477 \tabularnewline
8 & -0.111315 & -0.938 & 0.175722 \tabularnewline
9 & -0.123713 & -1.0424 & 0.150375 \tabularnewline
10 & -0.039059 & -0.3291 & 0.371518 \tabularnewline
11 & 0.096484 & 0.813 & 0.209471 \tabularnewline
12 & 0.006012 & 0.0507 & 0.479869 \tabularnewline
13 & 0.004296 & 0.0362 & 0.485613 \tabularnewline
14 & -0.037372 & -0.3149 & 0.376879 \tabularnewline
15 & -0.063705 & -0.5368 & 0.296545 \tabularnewline
16 & -0.086523 & -0.7291 & 0.234184 \tabularnewline
17 & -0.030411 & -0.2562 & 0.399251 \tabularnewline
18 & 0.018806 & 0.1585 & 0.437271 \tabularnewline
19 & -0.055664 & -0.469 & 0.320243 \tabularnewline
20 & -0.053473 & -0.4506 & 0.326836 \tabularnewline
21 & -0.044329 & -0.3735 & 0.354935 \tabularnewline
22 & -0.080927 & -0.6819 & 0.248759 \tabularnewline
23 & 0.019458 & 0.164 & 0.435117 \tabularnewline
24 & -0.127667 & -1.0757 & 0.142843 \tabularnewline
25 & -0.006018 & -0.0507 & 0.479851 \tabularnewline
26 & -0.054429 & -0.4586 & 0.323951 \tabularnewline
27 & -0.093278 & -0.786 & 0.217248 \tabularnewline
28 & -0.046585 & -0.3925 & 0.34792 \tabularnewline
29 & -0.122034 & -1.0283 & 0.153654 \tabularnewline
30 & 0.062826 & 0.5294 & 0.299095 \tabularnewline
31 & -0.029012 & -0.2445 & 0.403791 \tabularnewline
32 & -0.052526 & -0.4426 & 0.329704 \tabularnewline
33 & -0.056846 & -0.479 & 0.316709 \tabularnewline
34 & -0.061984 & -0.5223 & 0.301547 \tabularnewline
35 & 0.023481 & 0.1979 & 0.421863 \tabularnewline
36 & -0.055948 & -0.4714 & 0.319391 \tabularnewline
37 & -0.032078 & -0.2703 & 0.393859 \tabularnewline
38 & -0.001711 & -0.0144 & 0.494269 \tabularnewline
39 & 0.000287 & 0.0024 & 0.499037 \tabularnewline
40 & 0.002662 & 0.0224 & 0.491082 \tabularnewline
41 & -0.029073 & -0.245 & 0.403591 \tabularnewline
42 & -0.03828 & -0.3226 & 0.373992 \tabularnewline
43 & -0.039584 & -0.3335 & 0.369853 \tabularnewline
44 & -0.026343 & -0.222 & 0.412488 \tabularnewline
45 & -0.018748 & -0.158 & 0.437464 \tabularnewline
46 & -0.040038 & -0.3374 & 0.368419 \tabularnewline
47 & -0.024705 & -0.2082 & 0.417848 \tabularnewline
48 & -0.047691 & -0.4019 & 0.3445 \tabularnewline
\hline
\end{tabular}
%Source: https://freestatistics.org/blog/index.php?pk=293660&T=2

[TABLE]
[ROW][C]Partial Autocorrelation Function[/C][/ROW]
[ROW][C]Time lag k[/C][C]PACF(k)[/C][C]T-STAT[/C][C]P-value[/C][/ROW]
[ROW][C]1[/C][C]0.147898[/C][C]1.2462[/C][C]0.108392[/C][/ROW]
[ROW][C]2[/C][C]-0.026427[/C][C]-0.2227[/C][C]0.412211[/C][/ROW]
[ROW][C]3[/C][C]-0.10812[/C][C]-0.911[/C][C]0.18268[/C][/ROW]
[ROW][C]4[/C][C]-0.060969[/C][C]-0.5137[/C][C]0.304518[/C][/ROW]
[ROW][C]5[/C][C]-0.047892[/C][C]-0.4035[/C][C]0.343879[/C][/ROW]
[ROW][C]6[/C][C]-0.072182[/C][C]-0.6082[/C][C]0.272493[/C][/ROW]
[ROW][C]7[/C][C]-0.078672[/C][C]-0.6629[/C][C]0.25477[/C][/ROW]
[ROW][C]8[/C][C]-0.111315[/C][C]-0.938[/C][C]0.175722[/C][/ROW]
[ROW][C]9[/C][C]-0.123713[/C][C]-1.0424[/C][C]0.150375[/C][/ROW]
[ROW][C]10[/C][C]-0.039059[/C][C]-0.3291[/C][C]0.371518[/C][/ROW]
[ROW][C]11[/C][C]0.096484[/C][C]0.813[/C][C]0.209471[/C][/ROW]
[ROW][C]12[/C][C]0.006012[/C][C]0.0507[/C][C]0.479869[/C][/ROW]
[ROW][C]13[/C][C]0.004296[/C][C]0.0362[/C][C]0.485613[/C][/ROW]
[ROW][C]14[/C][C]-0.037372[/C][C]-0.3149[/C][C]0.376879[/C][/ROW]
[ROW][C]15[/C][C]-0.063705[/C][C]-0.5368[/C][C]0.296545[/C][/ROW]
[ROW][C]16[/C][C]-0.086523[/C][C]-0.7291[/C][C]0.234184[/C][/ROW]
[ROW][C]17[/C][C]-0.030411[/C][C]-0.2562[/C][C]0.399251[/C][/ROW]
[ROW][C]18[/C][C]0.018806[/C][C]0.1585[/C][C]0.437271[/C][/ROW]
[ROW][C]19[/C][C]-0.055664[/C][C]-0.469[/C][C]0.320243[/C][/ROW]
[ROW][C]20[/C][C]-0.053473[/C][C]-0.4506[/C][C]0.326836[/C][/ROW]
[ROW][C]21[/C][C]-0.044329[/C][C]-0.3735[/C][C]0.354935[/C][/ROW]
[ROW][C]22[/C][C]-0.080927[/C][C]-0.6819[/C][C]0.248759[/C][/ROW]
[ROW][C]23[/C][C]0.019458[/C][C]0.164[/C][C]0.435117[/C][/ROW]
[ROW][C]24[/C][C]-0.127667[/C][C]-1.0757[/C][C]0.142843[/C][/ROW]
[ROW][C]25[/C][C]-0.006018[/C][C]-0.0507[/C][C]0.479851[/C][/ROW]
[ROW][C]26[/C][C]-0.054429[/C][C]-0.4586[/C][C]0.323951[/C][/ROW]
[ROW][C]27[/C][C]-0.093278[/C][C]-0.786[/C][C]0.217248[/C][/ROW]
[ROW][C]28[/C][C]-0.046585[/C][C]-0.3925[/C][C]0.34792[/C][/ROW]
[ROW][C]29[/C][C]-0.122034[/C][C]-1.0283[/C][C]0.153654[/C][/ROW]
[ROW][C]30[/C][C]0.062826[/C][C]0.5294[/C][C]0.299095[/C][/ROW]
[ROW][C]31[/C][C]-0.029012[/C][C]-0.2445[/C][C]0.403791[/C][/ROW]
[ROW][C]32[/C][C]-0.052526[/C][C]-0.4426[/C][C]0.329704[/C][/ROW]
[ROW][C]33[/C][C]-0.056846[/C][C]-0.479[/C][C]0.316709[/C][/ROW]
[ROW][C]34[/C][C]-0.061984[/C][C]-0.5223[/C][C]0.301547[/C][/ROW]
[ROW][C]35[/C][C]0.023481[/C][C]0.1979[/C][C]0.421863[/C][/ROW]
[ROW][C]36[/C][C]-0.055948[/C][C]-0.4714[/C][C]0.319391[/C][/ROW]
[ROW][C]37[/C][C]-0.032078[/C][C]-0.2703[/C][C]0.393859[/C][/ROW]
[ROW][C]38[/C][C]-0.001711[/C][C]-0.0144[/C][C]0.494269[/C][/ROW]
[ROW][C]39[/C][C]0.000287[/C][C]0.0024[/C][C]0.499037[/C][/ROW]
[ROW][C]40[/C][C]0.002662[/C][C]0.0224[/C][C]0.491082[/C][/ROW]
[ROW][C]41[/C][C]-0.029073[/C][C]-0.245[/C][C]0.403591[/C][/ROW]
[ROW][C]42[/C][C]-0.03828[/C][C]-0.3226[/C][C]0.373992[/C][/ROW]
[ROW][C]43[/C][C]-0.039584[/C][C]-0.3335[/C][C]0.369853[/C][/ROW]
[ROW][C]44[/C][C]-0.026343[/C][C]-0.222[/C][C]0.412488[/C][/ROW]
[ROW][C]45[/C][C]-0.018748[/C][C]-0.158[/C][C]0.437464[/C][/ROW]
[ROW][C]46[/C][C]-0.040038[/C][C]-0.3374[/C][C]0.368419[/C][/ROW]
[ROW][C]47[/C][C]-0.024705[/C][C]-0.2082[/C][C]0.417848[/C][/ROW]
[ROW][C]48[/C][C]-0.047691[/C][C]-0.4019[/C][C]0.3445[/C][/ROW]
[/TABLE]
Source: https://freestatistics.org/blog/index.php?pk=293660&T=2

Globally Unique Identifier (entire table): ba.freestatistics.org/blog/index.php?pk=293660&T=2

As an alternative you can also use a QR Code:  

The GUIDs for individual cells are displayed in the table below:

Partial Autocorrelation Function
Time lag kPACF(k)T-STATP-value
10.1478981.24620.108392
2-0.026427-0.22270.412211
3-0.10812-0.9110.18268
4-0.060969-0.51370.304518
5-0.047892-0.40350.343879
6-0.072182-0.60820.272493
7-0.078672-0.66290.25477
8-0.111315-0.9380.175722
9-0.123713-1.04240.150375
10-0.039059-0.32910.371518
110.0964840.8130.209471
120.0060120.05070.479869
130.0042960.03620.485613
14-0.037372-0.31490.376879
15-0.063705-0.53680.296545
16-0.086523-0.72910.234184
17-0.030411-0.25620.399251
180.0188060.15850.437271
19-0.055664-0.4690.320243
20-0.053473-0.45060.326836
21-0.044329-0.37350.354935
22-0.080927-0.68190.248759
230.0194580.1640.435117
24-0.127667-1.07570.142843
25-0.006018-0.05070.479851
26-0.054429-0.45860.323951
27-0.093278-0.7860.217248
28-0.046585-0.39250.34792
29-0.122034-1.02830.153654
300.0628260.52940.299095
31-0.029012-0.24450.403791
32-0.052526-0.44260.329704
33-0.056846-0.4790.316709
34-0.061984-0.52230.301547
350.0234810.19790.421863
36-0.055948-0.47140.319391
37-0.032078-0.27030.393859
38-0.001711-0.01440.494269
390.0002870.00240.499037
400.0026620.02240.491082
41-0.029073-0.2450.403591
42-0.03828-0.32260.373992
43-0.039584-0.33350.369853
44-0.026343-0.2220.412488
45-0.018748-0.1580.437464
46-0.040038-0.33740.368419
47-0.024705-0.20820.417848
48-0.047691-0.40190.3445


Parameters (Session):
par1 = 48 ; par2 = 1 ; par3 = 1 ; par4 = 0 ; par5 = 12 ; par6 = White Noise ; par7 = 0.95 ;
Parameters (R input):
par1 = 48 ; par2 = 1 ; par3 = 1 ; par4 = 0 ; par5 = 12 ; par6 = White Noise ; par7 = 0.95 ; par8 = ;
R code (references can be found in the software module):
par8 <- ''
par7 <- '0.95'
par6 <- 'White Noise'
par5 <- '12'
par4 <- '0'
par3 <- '0'
par2 <- '1'
par1 <- '48'
if (par1 == 'Default') {
par1 = 10*log10(length(x))
} else {
par1 <- as.numeric(par1)
}
par2 <- as.numeric(par2)
par3 <- as.numeric(par3)
par4 <- as.numeric(par4)
par5 <- as.numeric(par5)
if (par6 == 'White Noise') par6 <- 'white' else par6 <- 'ma'
par7 <- as.numeric(par7)
if (par8 != '') par8 <- as.numeric(par8)
x <- na.omit(x)
ox <- x
if (par8 == '') {
if (par2 == 0) {
x <- log(x)
} else {
x <- (x ^ par2 - 1) / par2
}
} else {
x <- log(x,base=par8)
}
if (par3 > 0) x <- diff(x,lag=1,difference=par3)
if (par4 > 0) x <- diff(x,lag=par5,difference=par4)
bitmap(file='picts.png')
op <- par(mfrow=c(2,1))
plot(ox,type='l',main='Original Time Series',xlab='time',ylab='value')
if (par8=='') {
mytitle <- paste('Working Time Series (lambda=',par2,', d=',par3,', D=',par4,')',sep='')
mysub <- paste('(lambda=',par2,', d=',par3,', D=',par4,', CI=', par7, ', CI type=',par6,')',sep='')
} else {
mytitle <- paste('Working Time Series (base=',par8,', d=',par3,', D=',par4,')',sep='')
mysub <- paste('(base=',par8,', d=',par3,', D=',par4,', CI=', par7, ', CI type=',par6,')',sep='')
}
plot(x,type='l', main=mytitle,xlab='time',ylab='value')
par(op)
dev.off()
bitmap(file='pic1.png')
racf <- acf(x, par1, main='Autocorrelation', xlab='time lag', ylab='ACF', ci.type=par6, ci=par7, sub=mysub)
dev.off()
bitmap(file='pic2.png')
rpacf <- pacf(x,par1,main='Partial Autocorrelation',xlab='lags',ylab='PACF',sub=mysub)
dev.off()
(myacf <- c(racf$acf))
(mypacf <- c(rpacf$acf))
lengthx <- length(x)
sqrtn <- sqrt(lengthx)
load(file='createtable')
a<-table.start()
a<-table.row.start(a)
a<-table.element(a,'Autocorrelation Function',4,TRUE)
a<-table.row.end(a)
a<-table.row.start(a)
a<-table.element(a,'Time lag k',header=TRUE)
a<-table.element(a,hyperlink('basics.htm','ACF(k)','click here for more information about the Autocorrelation Function'),header=TRUE)
a<-table.element(a,'T-STAT',header=TRUE)
a<-table.element(a,'P-value',header=TRUE)
a<-table.row.end(a)
for (i in 2:(par1+1)) {
a<-table.row.start(a)
a<-table.element(a,i-1,header=TRUE)
a<-table.element(a,round(myacf[i],6))
mytstat <- myacf[i]*sqrtn
a<-table.element(a,round(mytstat,4))
a<-table.element(a,round(1-pt(abs(mytstat),lengthx),6))
a<-table.row.end(a)
}
a<-table.end(a)
table.save(a,file='mytable.tab')
a<-table.start()
a<-table.row.start(a)
a<-table.element(a,'Partial Autocorrelation Function',4,TRUE)
a<-table.row.end(a)
a<-table.row.start(a)
a<-table.element(a,'Time lag k',header=TRUE)
a<-table.element(a,hyperlink('basics.htm','PACF(k)','click here for more information about the Partial Autocorrelation Function'),header=TRUE)
a<-table.element(a,'T-STAT',header=TRUE)
a<-table.element(a,'P-value',header=TRUE)
a<-table.row.end(a)
for (i in 1:par1) {
a<-table.row.start(a)
a<-table.element(a,i,header=TRUE)
a<-table.element(a,round(mypacf[i],6))
mytstat <- mypacf[i]*sqrtn
a<-table.element(a,round(mytstat,4))
a<-table.element(a,round(1-pt(abs(mytstat),lengthx),6))
a<-table.row.end(a)
}
a<-table.end(a)
table.save(a,file='mytable1.tab')