Free Statistics

of Irreproducible Research!

Author's title

Author*Unverified author*
R Software Modulerwasp_autocorrelation.wasp
Title produced by software(Partial) Autocorrelation Function
Date of computationTue, 08 Mar 2016 11:11:11 +0000
Cite this page as followsStatistical Computations at FreeStatistics.org, Office for Research Development and Education, URL https://freestatistics.org/blog/index.php?v=date/2016/Mar/08/t1457435515u6lw6dz1u543uu2.htm/, Retrieved Mon, 29 Apr 2024 01:18:22 +0000
Statistical Computations at FreeStatistics.org, Office for Research Development and Education, URL https://freestatistics.org/blog/index.php?pk=293669, Retrieved Mon, 29 Apr 2024 01:18:22 +0000
QR Codes:

Original text written by user:
IsPrivate?No (this computation is public)
User-defined keywords
Estimated Impact99
Family? (F = Feedback message, R = changed R code, M = changed R Module, P = changed Parameters, D = changed Data)
-       [(Partial) Autocorrelation Function] [] [2016-03-08 11:11:11] [3fd8a2781b4a66a294f894c9e659cf7e] [Current]
Feedback Forum

Post a new message
Dataseries X:
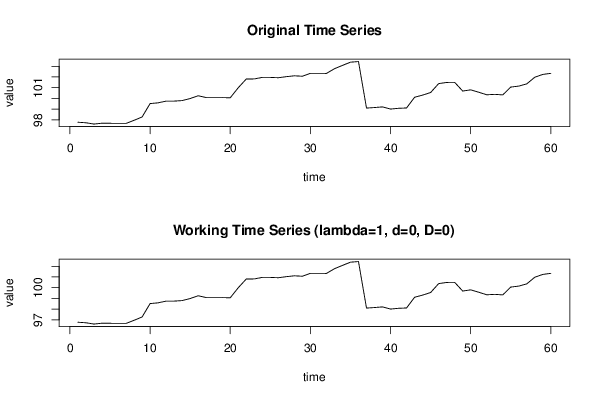
97,78
97,73
97,61
97,69
97,68
97,67
97,67
97,96
98,27
99,52
99,59
99,75
99,75
99,8
99,99
100,25
100,08
100,08
100,08
100,06
101
101,81
101,82
101,96
101,96
101,93
102,03
102,11
102,07
102,34
102,34
102,33
102,77
103,08
103,38
103,44
99,1
99,15
99,21
99,01
99,08
99,11
100,11
100,31
100,55
101,38
101,49
101,5
100,69
100,8
100,58
100,34
100,38
100,33
101,06
101,15
101,36
101,98
102,24
102,34


Summary of computational transaction
Raw Inputview raw input (R code)
Raw Outputview raw output of R engine
Computing time1 seconds
R Server'Gertrude Mary Cox' @ cox.wessa.net

\begin{tabular}{lllllllll}
\hline
Summary of computational transaction \tabularnewline
Raw Input & view raw input (R code)  \tabularnewline
Raw Output & view raw output of R engine  \tabularnewline
Computing time & 1 seconds \tabularnewline
R Server & 'Gertrude Mary Cox' @ cox.wessa.net \tabularnewline
\hline
\end{tabular}
%Source: https://freestatistics.org/blog/index.php?pk=293669&T=0

[TABLE]
[ROW][C]Summary of computational transaction[/C][/ROW]
[ROW][C]Raw Input[/C][C]view raw input (R code) [/C][/ROW]
[ROW][C]Raw Output[/C][C]view raw output of R engine [/C][/ROW]
[ROW][C]Computing time[/C][C]1 seconds[/C][/ROW]
[ROW][C]R Server[/C][C]'Gertrude Mary Cox' @ cox.wessa.net[/C][/ROW]
[/TABLE]
Source: https://freestatistics.org/blog/index.php?pk=293669&T=0

Globally Unique Identifier (entire table): ba.freestatistics.org/blog/index.php?pk=293669&T=0

As an alternative you can also use a QR Code:  

The GUIDs for individual cells are displayed in the table below:

Summary of computational transaction
Raw Inputview raw input (R code)
Raw Outputview raw output of R engine
Computing time1 seconds
R Server'Gertrude Mary Cox' @ cox.wessa.net


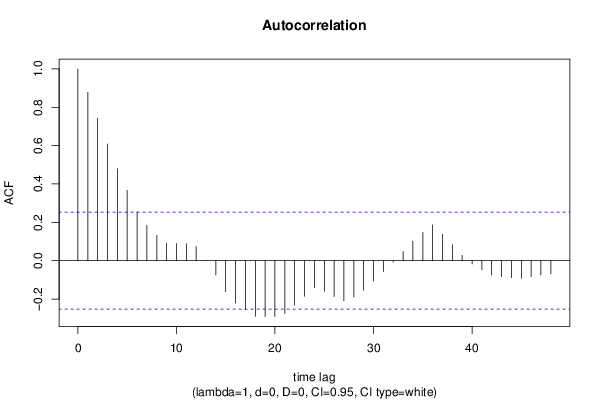
Autocorrelation Function
Time lag kACF(k)T-STATP-value
10.877766.79910
20.7431875.75670
30.608414.71277e-06
40.4793873.71330.000225
50.3668222.84140.003064
60.2535461.9640.027086
70.1833871.42050.080318
80.1321921.0240.154985
90.0913530.70760.240961
100.0898910.69630.244467
110.0879420.68120.249184
120.0741350.57420.283975
130.0022890.01770.492956
14-0.075072-0.58150.281538
15-0.161482-1.25080.107926
16-0.221093-1.71260.045977
17-0.254259-1.96950.02676
18-0.289751-2.24440.014253
19-0.291929-2.26130.01369
20-0.290482-2.25010.014062
21-0.27591-2.13720.018334
22-0.231877-1.79610.038756
23-0.185187-1.43440.078318
24-0.14039-1.08750.140592
25-0.159857-1.23820.110224
26-0.186894-1.44770.076457
27-0.208945-1.61850.055403
28-0.188757-1.46210.074465
29-0.153512-1.18910.119543
30-0.106135-0.82210.207133
31-0.056715-0.43930.331007
32-0.00676-0.05240.479207
330.0482710.37390.354895
340.1011320.78340.218246
350.1473951.14170.129055
360.1865271.44480.076854
370.1372091.06280.146063
380.0832360.64470.260776
390.0277440.21490.415286
40-0.01691-0.1310.448114
41-0.047779-0.37010.356307
42-0.074766-0.57910.282334
43-0.083028-0.64310.261296
44-0.088464-0.68520.247917
45-0.091763-0.71080.239983
46-0.083156-0.64410.260976
47-0.073909-0.57250.284562
48-0.067806-0.52520.300681

\begin{tabular}{lllllllll}
\hline
Autocorrelation Function \tabularnewline
Time lag k & ACF(k) & T-STAT & P-value \tabularnewline
1 & 0.87776 & 6.7991 & 0 \tabularnewline
2 & 0.743187 & 5.7567 & 0 \tabularnewline
3 & 0.60841 & 4.7127 & 7e-06 \tabularnewline
4 & 0.479387 & 3.7133 & 0.000225 \tabularnewline
5 & 0.366822 & 2.8414 & 0.003064 \tabularnewline
6 & 0.253546 & 1.964 & 0.027086 \tabularnewline
7 & 0.183387 & 1.4205 & 0.080318 \tabularnewline
8 & 0.132192 & 1.024 & 0.154985 \tabularnewline
9 & 0.091353 & 0.7076 & 0.240961 \tabularnewline
10 & 0.089891 & 0.6963 & 0.244467 \tabularnewline
11 & 0.087942 & 0.6812 & 0.249184 \tabularnewline
12 & 0.074135 & 0.5742 & 0.283975 \tabularnewline
13 & 0.002289 & 0.0177 & 0.492956 \tabularnewline
14 & -0.075072 & -0.5815 & 0.281538 \tabularnewline
15 & -0.161482 & -1.2508 & 0.107926 \tabularnewline
16 & -0.221093 & -1.7126 & 0.045977 \tabularnewline
17 & -0.254259 & -1.9695 & 0.02676 \tabularnewline
18 & -0.289751 & -2.2444 & 0.014253 \tabularnewline
19 & -0.291929 & -2.2613 & 0.01369 \tabularnewline
20 & -0.290482 & -2.2501 & 0.014062 \tabularnewline
21 & -0.27591 & -2.1372 & 0.018334 \tabularnewline
22 & -0.231877 & -1.7961 & 0.038756 \tabularnewline
23 & -0.185187 & -1.4344 & 0.078318 \tabularnewline
24 & -0.14039 & -1.0875 & 0.140592 \tabularnewline
25 & -0.159857 & -1.2382 & 0.110224 \tabularnewline
26 & -0.186894 & -1.4477 & 0.076457 \tabularnewline
27 & -0.208945 & -1.6185 & 0.055403 \tabularnewline
28 & -0.188757 & -1.4621 & 0.074465 \tabularnewline
29 & -0.153512 & -1.1891 & 0.119543 \tabularnewline
30 & -0.106135 & -0.8221 & 0.207133 \tabularnewline
31 & -0.056715 & -0.4393 & 0.331007 \tabularnewline
32 & -0.00676 & -0.0524 & 0.479207 \tabularnewline
33 & 0.048271 & 0.3739 & 0.354895 \tabularnewline
34 & 0.101132 & 0.7834 & 0.218246 \tabularnewline
35 & 0.147395 & 1.1417 & 0.129055 \tabularnewline
36 & 0.186527 & 1.4448 & 0.076854 \tabularnewline
37 & 0.137209 & 1.0628 & 0.146063 \tabularnewline
38 & 0.083236 & 0.6447 & 0.260776 \tabularnewline
39 & 0.027744 & 0.2149 & 0.415286 \tabularnewline
40 & -0.01691 & -0.131 & 0.448114 \tabularnewline
41 & -0.047779 & -0.3701 & 0.356307 \tabularnewline
42 & -0.074766 & -0.5791 & 0.282334 \tabularnewline
43 & -0.083028 & -0.6431 & 0.261296 \tabularnewline
44 & -0.088464 & -0.6852 & 0.247917 \tabularnewline
45 & -0.091763 & -0.7108 & 0.239983 \tabularnewline
46 & -0.083156 & -0.6441 & 0.260976 \tabularnewline
47 & -0.073909 & -0.5725 & 0.284562 \tabularnewline
48 & -0.067806 & -0.5252 & 0.300681 \tabularnewline
\hline
\end{tabular}
%Source: https://freestatistics.org/blog/index.php?pk=293669&T=1

[TABLE]
[ROW][C]Autocorrelation Function[/C][/ROW]
[ROW][C]Time lag k[/C][C]ACF(k)[/C][C]T-STAT[/C][C]P-value[/C][/ROW]
[ROW][C]1[/C][C]0.87776[/C][C]6.7991[/C][C]0[/C][/ROW]
[ROW][C]2[/C][C]0.743187[/C][C]5.7567[/C][C]0[/C][/ROW]
[ROW][C]3[/C][C]0.60841[/C][C]4.7127[/C][C]7e-06[/C][/ROW]
[ROW][C]4[/C][C]0.479387[/C][C]3.7133[/C][C]0.000225[/C][/ROW]
[ROW][C]5[/C][C]0.366822[/C][C]2.8414[/C][C]0.003064[/C][/ROW]
[ROW][C]6[/C][C]0.253546[/C][C]1.964[/C][C]0.027086[/C][/ROW]
[ROW][C]7[/C][C]0.183387[/C][C]1.4205[/C][C]0.080318[/C][/ROW]
[ROW][C]8[/C][C]0.132192[/C][C]1.024[/C][C]0.154985[/C][/ROW]
[ROW][C]9[/C][C]0.091353[/C][C]0.7076[/C][C]0.240961[/C][/ROW]
[ROW][C]10[/C][C]0.089891[/C][C]0.6963[/C][C]0.244467[/C][/ROW]
[ROW][C]11[/C][C]0.087942[/C][C]0.6812[/C][C]0.249184[/C][/ROW]
[ROW][C]12[/C][C]0.074135[/C][C]0.5742[/C][C]0.283975[/C][/ROW]
[ROW][C]13[/C][C]0.002289[/C][C]0.0177[/C][C]0.492956[/C][/ROW]
[ROW][C]14[/C][C]-0.075072[/C][C]-0.5815[/C][C]0.281538[/C][/ROW]
[ROW][C]15[/C][C]-0.161482[/C][C]-1.2508[/C][C]0.107926[/C][/ROW]
[ROW][C]16[/C][C]-0.221093[/C][C]-1.7126[/C][C]0.045977[/C][/ROW]
[ROW][C]17[/C][C]-0.254259[/C][C]-1.9695[/C][C]0.02676[/C][/ROW]
[ROW][C]18[/C][C]-0.289751[/C][C]-2.2444[/C][C]0.014253[/C][/ROW]
[ROW][C]19[/C][C]-0.291929[/C][C]-2.2613[/C][C]0.01369[/C][/ROW]
[ROW][C]20[/C][C]-0.290482[/C][C]-2.2501[/C][C]0.014062[/C][/ROW]
[ROW][C]21[/C][C]-0.27591[/C][C]-2.1372[/C][C]0.018334[/C][/ROW]
[ROW][C]22[/C][C]-0.231877[/C][C]-1.7961[/C][C]0.038756[/C][/ROW]
[ROW][C]23[/C][C]-0.185187[/C][C]-1.4344[/C][C]0.078318[/C][/ROW]
[ROW][C]24[/C][C]-0.14039[/C][C]-1.0875[/C][C]0.140592[/C][/ROW]
[ROW][C]25[/C][C]-0.159857[/C][C]-1.2382[/C][C]0.110224[/C][/ROW]
[ROW][C]26[/C][C]-0.186894[/C][C]-1.4477[/C][C]0.076457[/C][/ROW]
[ROW][C]27[/C][C]-0.208945[/C][C]-1.6185[/C][C]0.055403[/C][/ROW]
[ROW][C]28[/C][C]-0.188757[/C][C]-1.4621[/C][C]0.074465[/C][/ROW]
[ROW][C]29[/C][C]-0.153512[/C][C]-1.1891[/C][C]0.119543[/C][/ROW]
[ROW][C]30[/C][C]-0.106135[/C][C]-0.8221[/C][C]0.207133[/C][/ROW]
[ROW][C]31[/C][C]-0.056715[/C][C]-0.4393[/C][C]0.331007[/C][/ROW]
[ROW][C]32[/C][C]-0.00676[/C][C]-0.0524[/C][C]0.479207[/C][/ROW]
[ROW][C]33[/C][C]0.048271[/C][C]0.3739[/C][C]0.354895[/C][/ROW]
[ROW][C]34[/C][C]0.101132[/C][C]0.7834[/C][C]0.218246[/C][/ROW]
[ROW][C]35[/C][C]0.147395[/C][C]1.1417[/C][C]0.129055[/C][/ROW]
[ROW][C]36[/C][C]0.186527[/C][C]1.4448[/C][C]0.076854[/C][/ROW]
[ROW][C]37[/C][C]0.137209[/C][C]1.0628[/C][C]0.146063[/C][/ROW]
[ROW][C]38[/C][C]0.083236[/C][C]0.6447[/C][C]0.260776[/C][/ROW]
[ROW][C]39[/C][C]0.027744[/C][C]0.2149[/C][C]0.415286[/C][/ROW]
[ROW][C]40[/C][C]-0.01691[/C][C]-0.131[/C][C]0.448114[/C][/ROW]
[ROW][C]41[/C][C]-0.047779[/C][C]-0.3701[/C][C]0.356307[/C][/ROW]
[ROW][C]42[/C][C]-0.074766[/C][C]-0.5791[/C][C]0.282334[/C][/ROW]
[ROW][C]43[/C][C]-0.083028[/C][C]-0.6431[/C][C]0.261296[/C][/ROW]
[ROW][C]44[/C][C]-0.088464[/C][C]-0.6852[/C][C]0.247917[/C][/ROW]
[ROW][C]45[/C][C]-0.091763[/C][C]-0.7108[/C][C]0.239983[/C][/ROW]
[ROW][C]46[/C][C]-0.083156[/C][C]-0.6441[/C][C]0.260976[/C][/ROW]
[ROW][C]47[/C][C]-0.073909[/C][C]-0.5725[/C][C]0.284562[/C][/ROW]
[ROW][C]48[/C][C]-0.067806[/C][C]-0.5252[/C][C]0.300681[/C][/ROW]
[/TABLE]
Source: https://freestatistics.org/blog/index.php?pk=293669&T=1

Globally Unique Identifier (entire table): ba.freestatistics.org/blog/index.php?pk=293669&T=1

As an alternative you can also use a QR Code:  

The GUIDs for individual cells are displayed in the table below:

Autocorrelation Function
Time lag kACF(k)T-STATP-value
10.877766.79910
20.7431875.75670
30.608414.71277e-06
40.4793873.71330.000225
50.3668222.84140.003064
60.2535461.9640.027086
70.1833871.42050.080318
80.1321921.0240.154985
90.0913530.70760.240961
100.0898910.69630.244467
110.0879420.68120.249184
120.0741350.57420.283975
130.0022890.01770.492956
14-0.075072-0.58150.281538
15-0.161482-1.25080.107926
16-0.221093-1.71260.045977
17-0.254259-1.96950.02676
18-0.289751-2.24440.014253
19-0.291929-2.26130.01369
20-0.290482-2.25010.014062
21-0.27591-2.13720.018334
22-0.231877-1.79610.038756
23-0.185187-1.43440.078318
24-0.14039-1.08750.140592
25-0.159857-1.23820.110224
26-0.186894-1.44770.076457
27-0.208945-1.61850.055403
28-0.188757-1.46210.074465
29-0.153512-1.18910.119543
30-0.106135-0.82210.207133
31-0.056715-0.43930.331007
32-0.00676-0.05240.479207
330.0482710.37390.354895
340.1011320.78340.218246
350.1473951.14170.129055
360.1865271.44480.076854
370.1372091.06280.146063
380.0832360.64470.260776
390.0277440.21490.415286
40-0.01691-0.1310.448114
41-0.047779-0.37010.356307
42-0.074766-0.57910.282334
43-0.083028-0.64310.261296
44-0.088464-0.68520.247917
45-0.091763-0.71080.239983
46-0.083156-0.64410.260976
47-0.073909-0.57250.284562
48-0.067806-0.52520.300681


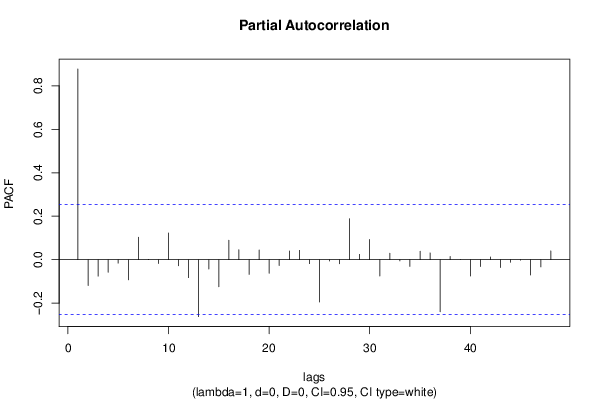
Partial Autocorrelation Function
Time lag kPACF(k)T-STATP-value
10.877766.79910
2-0.118829-0.92040.180513
3-0.075756-0.58680.27977
4-0.058297-0.45160.326604
5-0.016105-0.12480.450569
6-0.092941-0.71990.237185
70.1032790.80.213435
80.0012340.00960.496202
9-0.017397-0.13480.446628
100.1228550.95160.172551
11-0.027812-0.21540.415082
12-0.082904-0.64220.261603
13-0.262302-2.03180.023306
14-0.04297-0.33280.370206
15-0.12474-0.96620.168903
160.0892920.69170.245912
170.0457940.35470.362022
18-0.067771-0.5250.300775
190.0447160.34640.36514
20-0.062514-0.48420.314992
21-0.027246-0.2110.416783
220.0398360.30860.379358
230.0429470.33270.370273
24-0.018361-0.14220.443689
25-0.194624-1.50760.068458
26-0.006333-0.04910.48052
27-0.018946-0.14680.44191
280.1884641.45980.074776
290.0242440.18780.425836
300.0931160.72130.236771
31-0.075075-0.58150.281531
320.0295390.22880.409898
33-0.005696-0.04410.482476
34-0.031034-0.24040.405425
350.0384530.29790.38342
360.0310990.24090.405231
37-0.239788-1.85740.034083
380.0146260.11330.455087
390.0001179e-040.499641
40-0.074869-0.57990.282065
41-0.031454-0.24360.40417
420.0119890.09290.46316
43-0.035974-0.27870.390734
44-0.01199-0.09290.463155
45-0.002304-0.01790.492909
46-0.070988-0.54990.292224
47-0.033349-0.25830.398521
480.0403020.31220.377995

\begin{tabular}{lllllllll}
\hline
Partial Autocorrelation Function \tabularnewline
Time lag k & PACF(k) & T-STAT & P-value \tabularnewline
1 & 0.87776 & 6.7991 & 0 \tabularnewline
2 & -0.118829 & -0.9204 & 0.180513 \tabularnewline
3 & -0.075756 & -0.5868 & 0.27977 \tabularnewline
4 & -0.058297 & -0.4516 & 0.326604 \tabularnewline
5 & -0.016105 & -0.1248 & 0.450569 \tabularnewline
6 & -0.092941 & -0.7199 & 0.237185 \tabularnewline
7 & 0.103279 & 0.8 & 0.213435 \tabularnewline
8 & 0.001234 & 0.0096 & 0.496202 \tabularnewline
9 & -0.017397 & -0.1348 & 0.446628 \tabularnewline
10 & 0.122855 & 0.9516 & 0.172551 \tabularnewline
11 & -0.027812 & -0.2154 & 0.415082 \tabularnewline
12 & -0.082904 & -0.6422 & 0.261603 \tabularnewline
13 & -0.262302 & -2.0318 & 0.023306 \tabularnewline
14 & -0.04297 & -0.3328 & 0.370206 \tabularnewline
15 & -0.12474 & -0.9662 & 0.168903 \tabularnewline
16 & 0.089292 & 0.6917 & 0.245912 \tabularnewline
17 & 0.045794 & 0.3547 & 0.362022 \tabularnewline
18 & -0.067771 & -0.525 & 0.300775 \tabularnewline
19 & 0.044716 & 0.3464 & 0.36514 \tabularnewline
20 & -0.062514 & -0.4842 & 0.314992 \tabularnewline
21 & -0.027246 & -0.211 & 0.416783 \tabularnewline
22 & 0.039836 & 0.3086 & 0.379358 \tabularnewline
23 & 0.042947 & 0.3327 & 0.370273 \tabularnewline
24 & -0.018361 & -0.1422 & 0.443689 \tabularnewline
25 & -0.194624 & -1.5076 & 0.068458 \tabularnewline
26 & -0.006333 & -0.0491 & 0.48052 \tabularnewline
27 & -0.018946 & -0.1468 & 0.44191 \tabularnewline
28 & 0.188464 & 1.4598 & 0.074776 \tabularnewline
29 & 0.024244 & 0.1878 & 0.425836 \tabularnewline
30 & 0.093116 & 0.7213 & 0.236771 \tabularnewline
31 & -0.075075 & -0.5815 & 0.281531 \tabularnewline
32 & 0.029539 & 0.2288 & 0.409898 \tabularnewline
33 & -0.005696 & -0.0441 & 0.482476 \tabularnewline
34 & -0.031034 & -0.2404 & 0.405425 \tabularnewline
35 & 0.038453 & 0.2979 & 0.38342 \tabularnewline
36 & 0.031099 & 0.2409 & 0.405231 \tabularnewline
37 & -0.239788 & -1.8574 & 0.034083 \tabularnewline
38 & 0.014626 & 0.1133 & 0.455087 \tabularnewline
39 & 0.000117 & 9e-04 & 0.499641 \tabularnewline
40 & -0.074869 & -0.5799 & 0.282065 \tabularnewline
41 & -0.031454 & -0.2436 & 0.40417 \tabularnewline
42 & 0.011989 & 0.0929 & 0.46316 \tabularnewline
43 & -0.035974 & -0.2787 & 0.390734 \tabularnewline
44 & -0.01199 & -0.0929 & 0.463155 \tabularnewline
45 & -0.002304 & -0.0179 & 0.492909 \tabularnewline
46 & -0.070988 & -0.5499 & 0.292224 \tabularnewline
47 & -0.033349 & -0.2583 & 0.398521 \tabularnewline
48 & 0.040302 & 0.3122 & 0.377995 \tabularnewline
\hline
\end{tabular}
%Source: https://freestatistics.org/blog/index.php?pk=293669&T=2

[TABLE]
[ROW][C]Partial Autocorrelation Function[/C][/ROW]
[ROW][C]Time lag k[/C][C]PACF(k)[/C][C]T-STAT[/C][C]P-value[/C][/ROW]
[ROW][C]1[/C][C]0.87776[/C][C]6.7991[/C][C]0[/C][/ROW]
[ROW][C]2[/C][C]-0.118829[/C][C]-0.9204[/C][C]0.180513[/C][/ROW]
[ROW][C]3[/C][C]-0.075756[/C][C]-0.5868[/C][C]0.27977[/C][/ROW]
[ROW][C]4[/C][C]-0.058297[/C][C]-0.4516[/C][C]0.326604[/C][/ROW]
[ROW][C]5[/C][C]-0.016105[/C][C]-0.1248[/C][C]0.450569[/C][/ROW]
[ROW][C]6[/C][C]-0.092941[/C][C]-0.7199[/C][C]0.237185[/C][/ROW]
[ROW][C]7[/C][C]0.103279[/C][C]0.8[/C][C]0.213435[/C][/ROW]
[ROW][C]8[/C][C]0.001234[/C][C]0.0096[/C][C]0.496202[/C][/ROW]
[ROW][C]9[/C][C]-0.017397[/C][C]-0.1348[/C][C]0.446628[/C][/ROW]
[ROW][C]10[/C][C]0.122855[/C][C]0.9516[/C][C]0.172551[/C][/ROW]
[ROW][C]11[/C][C]-0.027812[/C][C]-0.2154[/C][C]0.415082[/C][/ROW]
[ROW][C]12[/C][C]-0.082904[/C][C]-0.6422[/C][C]0.261603[/C][/ROW]
[ROW][C]13[/C][C]-0.262302[/C][C]-2.0318[/C][C]0.023306[/C][/ROW]
[ROW][C]14[/C][C]-0.04297[/C][C]-0.3328[/C][C]0.370206[/C][/ROW]
[ROW][C]15[/C][C]-0.12474[/C][C]-0.9662[/C][C]0.168903[/C][/ROW]
[ROW][C]16[/C][C]0.089292[/C][C]0.6917[/C][C]0.245912[/C][/ROW]
[ROW][C]17[/C][C]0.045794[/C][C]0.3547[/C][C]0.362022[/C][/ROW]
[ROW][C]18[/C][C]-0.067771[/C][C]-0.525[/C][C]0.300775[/C][/ROW]
[ROW][C]19[/C][C]0.044716[/C][C]0.3464[/C][C]0.36514[/C][/ROW]
[ROW][C]20[/C][C]-0.062514[/C][C]-0.4842[/C][C]0.314992[/C][/ROW]
[ROW][C]21[/C][C]-0.027246[/C][C]-0.211[/C][C]0.416783[/C][/ROW]
[ROW][C]22[/C][C]0.039836[/C][C]0.3086[/C][C]0.379358[/C][/ROW]
[ROW][C]23[/C][C]0.042947[/C][C]0.3327[/C][C]0.370273[/C][/ROW]
[ROW][C]24[/C][C]-0.018361[/C][C]-0.1422[/C][C]0.443689[/C][/ROW]
[ROW][C]25[/C][C]-0.194624[/C][C]-1.5076[/C][C]0.068458[/C][/ROW]
[ROW][C]26[/C][C]-0.006333[/C][C]-0.0491[/C][C]0.48052[/C][/ROW]
[ROW][C]27[/C][C]-0.018946[/C][C]-0.1468[/C][C]0.44191[/C][/ROW]
[ROW][C]28[/C][C]0.188464[/C][C]1.4598[/C][C]0.074776[/C][/ROW]
[ROW][C]29[/C][C]0.024244[/C][C]0.1878[/C][C]0.425836[/C][/ROW]
[ROW][C]30[/C][C]0.093116[/C][C]0.7213[/C][C]0.236771[/C][/ROW]
[ROW][C]31[/C][C]-0.075075[/C][C]-0.5815[/C][C]0.281531[/C][/ROW]
[ROW][C]32[/C][C]0.029539[/C][C]0.2288[/C][C]0.409898[/C][/ROW]
[ROW][C]33[/C][C]-0.005696[/C][C]-0.0441[/C][C]0.482476[/C][/ROW]
[ROW][C]34[/C][C]-0.031034[/C][C]-0.2404[/C][C]0.405425[/C][/ROW]
[ROW][C]35[/C][C]0.038453[/C][C]0.2979[/C][C]0.38342[/C][/ROW]
[ROW][C]36[/C][C]0.031099[/C][C]0.2409[/C][C]0.405231[/C][/ROW]
[ROW][C]37[/C][C]-0.239788[/C][C]-1.8574[/C][C]0.034083[/C][/ROW]
[ROW][C]38[/C][C]0.014626[/C][C]0.1133[/C][C]0.455087[/C][/ROW]
[ROW][C]39[/C][C]0.000117[/C][C]9e-04[/C][C]0.499641[/C][/ROW]
[ROW][C]40[/C][C]-0.074869[/C][C]-0.5799[/C][C]0.282065[/C][/ROW]
[ROW][C]41[/C][C]-0.031454[/C][C]-0.2436[/C][C]0.40417[/C][/ROW]
[ROW][C]42[/C][C]0.011989[/C][C]0.0929[/C][C]0.46316[/C][/ROW]
[ROW][C]43[/C][C]-0.035974[/C][C]-0.2787[/C][C]0.390734[/C][/ROW]
[ROW][C]44[/C][C]-0.01199[/C][C]-0.0929[/C][C]0.463155[/C][/ROW]
[ROW][C]45[/C][C]-0.002304[/C][C]-0.0179[/C][C]0.492909[/C][/ROW]
[ROW][C]46[/C][C]-0.070988[/C][C]-0.5499[/C][C]0.292224[/C][/ROW]
[ROW][C]47[/C][C]-0.033349[/C][C]-0.2583[/C][C]0.398521[/C][/ROW]
[ROW][C]48[/C][C]0.040302[/C][C]0.3122[/C][C]0.377995[/C][/ROW]
[/TABLE]
Source: https://freestatistics.org/blog/index.php?pk=293669&T=2

Globally Unique Identifier (entire table): ba.freestatistics.org/blog/index.php?pk=293669&T=2

As an alternative you can also use a QR Code:  

The GUIDs for individual cells are displayed in the table below:

Partial Autocorrelation Function
Time lag kPACF(k)T-STATP-value
10.877766.79910
2-0.118829-0.92040.180513
3-0.075756-0.58680.27977
4-0.058297-0.45160.326604
5-0.016105-0.12480.450569
6-0.092941-0.71990.237185
70.1032790.80.213435
80.0012340.00960.496202
9-0.017397-0.13480.446628
100.1228550.95160.172551
11-0.027812-0.21540.415082
12-0.082904-0.64220.261603
13-0.262302-2.03180.023306
14-0.04297-0.33280.370206
15-0.12474-0.96620.168903
160.0892920.69170.245912
170.0457940.35470.362022
18-0.067771-0.5250.300775
190.0447160.34640.36514
20-0.062514-0.48420.314992
21-0.027246-0.2110.416783
220.0398360.30860.379358
230.0429470.33270.370273
24-0.018361-0.14220.443689
25-0.194624-1.50760.068458
26-0.006333-0.04910.48052
27-0.018946-0.14680.44191
280.1884641.45980.074776
290.0242440.18780.425836
300.0931160.72130.236771
31-0.075075-0.58150.281531
320.0295390.22880.409898
33-0.005696-0.04410.482476
34-0.031034-0.24040.405425
350.0384530.29790.38342
360.0310990.24090.405231
37-0.239788-1.85740.034083
380.0146260.11330.455087
390.0001179e-040.499641
40-0.074869-0.57990.282065
41-0.031454-0.24360.40417
420.0119890.09290.46316
43-0.035974-0.27870.390734
44-0.01199-0.09290.463155
45-0.002304-0.01790.492909
46-0.070988-0.54990.292224
47-0.033349-0.25830.398521
480.0403020.31220.377995


Parameters (Session):
par1 = 48 ; par2 = 1 ; par3 = 0 ; par4 = 0 ; par5 = 12 ; par6 = White Noise ; par7 = 0.95 ;
Parameters (R input):
par1 = 48 ; par2 = 1 ; par3 = 0 ; par4 = 0 ; par5 = 12 ; par6 = White Noise ; par7 = 0.95 ; par8 = ;
R code (references can be found in the software module):
if (par1 == 'Default') {
par1 = 10*log10(length(x))
} else {
par1 <- as.numeric(par1)
}
par2 <- as.numeric(par2)
par3 <- as.numeric(par3)
par4 <- as.numeric(par4)
par5 <- as.numeric(par5)
if (par6 == 'White Noise') par6 <- 'white' else par6 <- 'ma'
par7 <- as.numeric(par7)
if (par8 != '') par8 <- as.numeric(par8)
x <- na.omit(x)
ox <- x
if (par8 == '') {
if (par2 == 0) {
x <- log(x)
} else {
x <- (x ^ par2 - 1) / par2
}
} else {
x <- log(x,base=par8)
}
if (par3 > 0) x <- diff(x,lag=1,difference=par3)
if (par4 > 0) x <- diff(x,lag=par5,difference=par4)
bitmap(file='picts.png')
op <- par(mfrow=c(2,1))
plot(ox,type='l',main='Original Time Series',xlab='time',ylab='value')
if (par8=='') {
mytitle <- paste('Working Time Series (lambda=',par2,', d=',par3,', D=',par4,')',sep='')
mysub <- paste('(lambda=',par2,', d=',par3,', D=',par4,', CI=', par7, ', CI type=',par6,')',sep='')
} else {
mytitle <- paste('Working Time Series (base=',par8,', d=',par3,', D=',par4,')',sep='')
mysub <- paste('(base=',par8,', d=',par3,', D=',par4,', CI=', par7, ', CI type=',par6,')',sep='')
}
plot(x,type='l', main=mytitle,xlab='time',ylab='value')
par(op)
dev.off()
bitmap(file='pic1.png')
racf <- acf(x, par1, main='Autocorrelation', xlab='time lag', ylab='ACF', ci.type=par6, ci=par7, sub=mysub)
dev.off()
bitmap(file='pic2.png')
rpacf <- pacf(x,par1,main='Partial Autocorrelation',xlab='lags',ylab='PACF',sub=mysub)
dev.off()
(myacf <- c(racf$acf))
(mypacf <- c(rpacf$acf))
lengthx <- length(x)
sqrtn <- sqrt(lengthx)
load(file='createtable')
a<-table.start()
a<-table.row.start(a)
a<-table.element(a,'Autocorrelation Function',4,TRUE)
a<-table.row.end(a)
a<-table.row.start(a)
a<-table.element(a,'Time lag k',header=TRUE)
a<-table.element(a,hyperlink('basics.htm','ACF(k)','click here for more information about the Autocorrelation Function'),header=TRUE)
a<-table.element(a,'T-STAT',header=TRUE)
a<-table.element(a,'P-value',header=TRUE)
a<-table.row.end(a)
for (i in 2:(par1+1)) {
a<-table.row.start(a)
a<-table.element(a,i-1,header=TRUE)
a<-table.element(a,round(myacf[i],6))
mytstat <- myacf[i]*sqrtn
a<-table.element(a,round(mytstat,4))
a<-table.element(a,round(1-pt(abs(mytstat),lengthx),6))
a<-table.row.end(a)
}
a<-table.end(a)
table.save(a,file='mytable.tab')
a<-table.start()
a<-table.row.start(a)
a<-table.element(a,'Partial Autocorrelation Function',4,TRUE)
a<-table.row.end(a)
a<-table.row.start(a)
a<-table.element(a,'Time lag k',header=TRUE)
a<-table.element(a,hyperlink('basics.htm','PACF(k)','click here for more information about the Partial Autocorrelation Function'),header=TRUE)
a<-table.element(a,'T-STAT',header=TRUE)
a<-table.element(a,'P-value',header=TRUE)
a<-table.row.end(a)
for (i in 1:par1) {
a<-table.row.start(a)
a<-table.element(a,i,header=TRUE)
a<-table.element(a,round(mypacf[i],6))
mytstat <- mypacf[i]*sqrtn
a<-table.element(a,round(mytstat,4))
a<-table.element(a,round(1-pt(abs(mytstat),lengthx),6))
a<-table.row.end(a)
}
a<-table.end(a)
table.save(a,file='mytable1.tab')