Free Statistics

of Irreproducible Research!

Author's title

Author*Unverified author*
R Software Modulerwasp_centraltendency.wasp
Title produced by softwareCentral Tendency
Date of computationTue, 08 Mar 2016 21:00:09 +0000
Cite this page as followsStatistical Computations at FreeStatistics.org, Office for Research Development and Education, URL https://freestatistics.org/blog/index.php?v=date/2016/Mar/08/t1457470847zjqdee89an2thi9.htm/, Retrieved Mon, 29 Apr 2024 04:46:57 +0000
Statistical Computations at FreeStatistics.org, Office for Research Development and Education, URL https://freestatistics.org/blog/index.php?pk=293763, Retrieved Mon, 29 Apr 2024 04:46:57 +0000
QR Codes:

Original text written by user:
IsPrivate?No (this computation is public)
User-defined keywords
Estimated Impact66
Family? (F = Feedback message, R = changed R code, M = changed R Module, P = changed Parameters, D = changed Data)
-       [Central Tendency] [] [2016-03-08 21:00:09] [be6cd4bb5de010eb7c002bb036e110fa] [Current]
Feedback Forum

Post a new message
Dataseries X:
81432
81935
82229
82963
82975
82892
82692
82648
83479
84176
84589
84857
84586
84635
84927
85563
86962
87780
88515
88800
89218
89626
89939
90663
91302
91560
92290
93281
94535
94855
95536
96008
96627
96738
96212
94198
93123
93022
93993
94876
95251
96216
96632
97023
97799
98001
98069
98172
98448
98157
98009
98020
97802
98006
98262
98629
99043
99289
99682
99979


Summary of computational transaction
Raw Inputview raw input (R code)
Raw Outputview raw output of R engine
Computing time2 seconds
R Server'Sir Maurice George Kendall' @ kendall.wessa.net

\begin{tabular}{lllllllll}
\hline
Summary of computational transaction \tabularnewline
Raw Input & view raw input (R code)  \tabularnewline
Raw Output & view raw output of R engine  \tabularnewline
Computing time & 2 seconds \tabularnewline
R Server & 'Sir Maurice George Kendall' @ kendall.wessa.net \tabularnewline
\hline
\end{tabular}
%Source: https://freestatistics.org/blog/index.php?pk=293763&T=0

[TABLE]
[ROW][C]Summary of computational transaction[/C][/ROW]
[ROW][C]Raw Input[/C][C]view raw input (R code) [/C][/ROW]
[ROW][C]Raw Output[/C][C]view raw output of R engine [/C][/ROW]
[ROW][C]Computing time[/C][C]2 seconds[/C][/ROW]
[ROW][C]R Server[/C][C]'Sir Maurice George Kendall' @ kendall.wessa.net[/C][/ROW]
[/TABLE]
Source: https://freestatistics.org/blog/index.php?pk=293763&T=0

Globally Unique Identifier (entire table): ba.freestatistics.org/blog/index.php?pk=293763&T=0

As an alternative you can also use a QR Code:  

The GUIDs for individual cells are displayed in the table below:

Summary of computational transaction
Raw Inputview raw input (R code)
Raw Outputview raw output of R engine
Computing time2 seconds
R Server'Sir Maurice George Kendall' @ kendall.wessa.net


Central Tendency - Ungrouped Data
MeasureValueS.E.Value/S.E.
Arithmetic Mean91945.4333333333775.715746531032118.529801340903
Geometric Mean91748.596211252
Harmonic Mean91548.3337599085
Quadratic Mean92138.2931852984
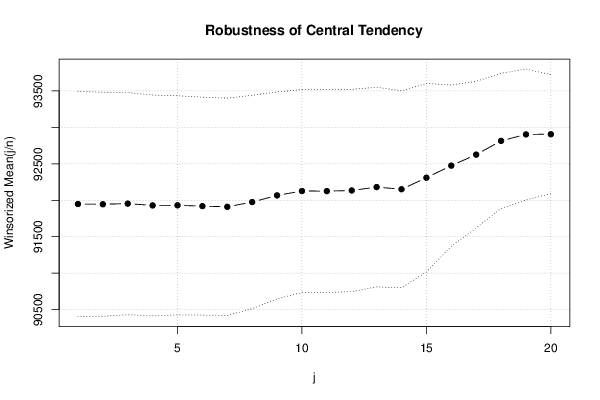
Winsorized Mean ( 1 / 20 )91948.8666666667772.978258319259118.95401413566
Winsorized Mean ( 2 / 20 )91945.5666666667768.681091575784119.614711060707
Winsorized Mean ( 3 / 20 )91954.2166666667762.303856810581120.626723641929
Winsorized Mean ( 4 / 20 )91929.55757.453055518003121.366663359925
Winsorized Mean ( 5 / 20 )91931.1333333333751.793508082324122.282425087484
Winsorized Mean ( 6 / 20 )91919.6333333333747.645610391869122.945459794989
Winsorized Mean ( 7 / 20 )91910.5333333333745.859466499205123.22768223983
Winsorized Mean ( 8 / 20 )91975.7333333333732.140355344978125.625821144629
Winsorized Mean ( 9 / 20 )92067.0833333333710.115486466522129.65085973755
Winsorized Mean ( 10 / 20 )92127.25696.235564162795132.321953577279
Winsorized Mean ( 11 / 20 )92125.7833333333695.845450522055132.39402982978
Winsorized Mean ( 12 / 20 )92134.3833333333694.07256662067132.74459727161
Winsorized Mean ( 13 / 20 )92181.4685.154658692243134.541010311376
Winsorized Mean ( 14 / 20 )92151.3675.560588851244136.407158026638
Winsorized Mean ( 15 / 20 )92309.55646.985502428847142.676380928879
Winsorized Mean ( 16 / 20 )92475.6833333333553.05006694599167.210328431918
Winsorized Mean ( 17 / 20 )92626.7503.304729778043184.037014793897
Winsorized Mean ( 18 / 20 )92815.4463.527020769071200.237301907456
Winsorized Mean ( 19 / 20 )92904.0666666667449.220415659812206.811764176412
Winsorized Mean ( 20 / 20 )92906.4408.737877686137227.300686018978
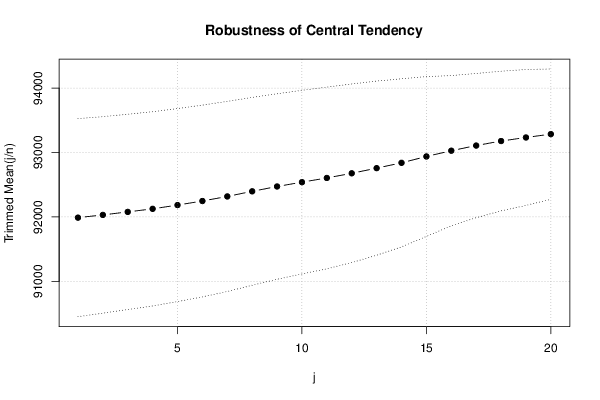
Trimmed Mean ( 1 / 20 )91988.1896551724768.985376355321119.62280751184
Trimmed Mean ( 2 / 20 )92030.3214285714763.324148225627120.565190610698
Trimmed Mean ( 3 / 20 )92077.4074074074758.30605084589121.425125521147
Trimmed Mean ( 4 / 20 )92124.7884615385754.119002103607122.16213648583
Trimmed Mean ( 5 / 20 )92183.36749.619383017754122.973554430911
Trimmed Mean ( 6 / 20 )92246.4166666667744.650141466165123.87886811522
Trimmed Mean ( 7 / 20 )92317.4565217391738.309674568779125.038936508124
Trimmed Mean ( 8 / 20 )92396.7272727273729.376696281037126.679022984751
Trimmed Mean ( 9 / 20 )92471.9047619048720.361649244404128.368722653267
Trimmed Mean ( 10 / 20 )92539.375713.087454347696129.772827211848
Trimmed Mean ( 11 / 20 )92604.4473684211705.493515608221131.261939790594
Trimmed Mean ( 12 / 20 )92676.9722222222693.5930872009133.618650376454
Trimmed Mean ( 13 / 20 )92756.7647058823676.088677824964137.196151552617
Trimmed Mean ( 14 / 20 )92839.75652.795588714539142.218715329889
Trimmed Mean ( 15 / 20 )92938.1620.721886656748149.725830517385
Trimmed Mean ( 16 / 20 )93027.8928571429583.005598045686159.566037048332
Trimmed Mean ( 17 / 20 )93107.5384615385560.274867242772166.181893754649
Trimmed Mean ( 18 / 20 )93178.25542.33331189929171.809933034877
Trimmed Mean ( 19 / 20 )93233.2272727273527.627311453284176.702807547865
Trimmed Mean ( 20 / 20 )93285.2506.253595698731184.265752959735
Median93637
Midrange90705.5
Midmean - Weighted Average at Xnp92679.6774193548
Midmean - Weighted Average at X(n+1)p92938.1
Midmean - Empirical Distribution Function92679.6774193548
Midmean - Empirical Distribution Function - Averaging92938.1
Midmean - Empirical Distribution Function - Interpolation92938.1
Midmean - Closest Observation92679.6774193548
Midmean - True Basic - Statistics Graphics Toolkit92938.1
Midmean - MS Excel (old versions)92839.75
Number of observations60

\begin{tabular}{lllllllll}
\hline
Central Tendency - Ungrouped Data \tabularnewline
Measure & Value & S.E. & Value/S.E. \tabularnewline
Arithmetic Mean & 91945.4333333333 & 775.715746531032 & 118.529801340903 \tabularnewline
Geometric Mean & 91748.596211252 &  &  \tabularnewline
Harmonic Mean & 91548.3337599085 &  &  \tabularnewline
Quadratic Mean & 92138.2931852984 &  &  \tabularnewline
Winsorized Mean ( 1 / 20 ) & 91948.8666666667 & 772.978258319259 & 118.95401413566 \tabularnewline
Winsorized Mean ( 2 / 20 ) & 91945.5666666667 & 768.681091575784 & 119.614711060707 \tabularnewline
Winsorized Mean ( 3 / 20 ) & 91954.2166666667 & 762.303856810581 & 120.626723641929 \tabularnewline
Winsorized Mean ( 4 / 20 ) & 91929.55 & 757.453055518003 & 121.366663359925 \tabularnewline
Winsorized Mean ( 5 / 20 ) & 91931.1333333333 & 751.793508082324 & 122.282425087484 \tabularnewline
Winsorized Mean ( 6 / 20 ) & 91919.6333333333 & 747.645610391869 & 122.945459794989 \tabularnewline
Winsorized Mean ( 7 / 20 ) & 91910.5333333333 & 745.859466499205 & 123.22768223983 \tabularnewline
Winsorized Mean ( 8 / 20 ) & 91975.7333333333 & 732.140355344978 & 125.625821144629 \tabularnewline
Winsorized Mean ( 9 / 20 ) & 92067.0833333333 & 710.115486466522 & 129.65085973755 \tabularnewline
Winsorized Mean ( 10 / 20 ) & 92127.25 & 696.235564162795 & 132.321953577279 \tabularnewline
Winsorized Mean ( 11 / 20 ) & 92125.7833333333 & 695.845450522055 & 132.39402982978 \tabularnewline
Winsorized Mean ( 12 / 20 ) & 92134.3833333333 & 694.07256662067 & 132.74459727161 \tabularnewline
Winsorized Mean ( 13 / 20 ) & 92181.4 & 685.154658692243 & 134.541010311376 \tabularnewline
Winsorized Mean ( 14 / 20 ) & 92151.3 & 675.560588851244 & 136.407158026638 \tabularnewline
Winsorized Mean ( 15 / 20 ) & 92309.55 & 646.985502428847 & 142.676380928879 \tabularnewline
Winsorized Mean ( 16 / 20 ) & 92475.6833333333 & 553.05006694599 & 167.210328431918 \tabularnewline
Winsorized Mean ( 17 / 20 ) & 92626.7 & 503.304729778043 & 184.037014793897 \tabularnewline
Winsorized Mean ( 18 / 20 ) & 92815.4 & 463.527020769071 & 200.237301907456 \tabularnewline
Winsorized Mean ( 19 / 20 ) & 92904.0666666667 & 449.220415659812 & 206.811764176412 \tabularnewline
Winsorized Mean ( 20 / 20 ) & 92906.4 & 408.737877686137 & 227.300686018978 \tabularnewline
Trimmed Mean ( 1 / 20 ) & 91988.1896551724 & 768.985376355321 & 119.62280751184 \tabularnewline
Trimmed Mean ( 2 / 20 ) & 92030.3214285714 & 763.324148225627 & 120.565190610698 \tabularnewline
Trimmed Mean ( 3 / 20 ) & 92077.4074074074 & 758.30605084589 & 121.425125521147 \tabularnewline
Trimmed Mean ( 4 / 20 ) & 92124.7884615385 & 754.119002103607 & 122.16213648583 \tabularnewline
Trimmed Mean ( 5 / 20 ) & 92183.36 & 749.619383017754 & 122.973554430911 \tabularnewline
Trimmed Mean ( 6 / 20 ) & 92246.4166666667 & 744.650141466165 & 123.87886811522 \tabularnewline
Trimmed Mean ( 7 / 20 ) & 92317.4565217391 & 738.309674568779 & 125.038936508124 \tabularnewline
Trimmed Mean ( 8 / 20 ) & 92396.7272727273 & 729.376696281037 & 126.679022984751 \tabularnewline
Trimmed Mean ( 9 / 20 ) & 92471.9047619048 & 720.361649244404 & 128.368722653267 \tabularnewline
Trimmed Mean ( 10 / 20 ) & 92539.375 & 713.087454347696 & 129.772827211848 \tabularnewline
Trimmed Mean ( 11 / 20 ) & 92604.4473684211 & 705.493515608221 & 131.261939790594 \tabularnewline
Trimmed Mean ( 12 / 20 ) & 92676.9722222222 & 693.5930872009 & 133.618650376454 \tabularnewline
Trimmed Mean ( 13 / 20 ) & 92756.7647058823 & 676.088677824964 & 137.196151552617 \tabularnewline
Trimmed Mean ( 14 / 20 ) & 92839.75 & 652.795588714539 & 142.218715329889 \tabularnewline
Trimmed Mean ( 15 / 20 ) & 92938.1 & 620.721886656748 & 149.725830517385 \tabularnewline
Trimmed Mean ( 16 / 20 ) & 93027.8928571429 & 583.005598045686 & 159.566037048332 \tabularnewline
Trimmed Mean ( 17 / 20 ) & 93107.5384615385 & 560.274867242772 & 166.181893754649 \tabularnewline
Trimmed Mean ( 18 / 20 ) & 93178.25 & 542.33331189929 & 171.809933034877 \tabularnewline
Trimmed Mean ( 19 / 20 ) & 93233.2272727273 & 527.627311453284 & 176.702807547865 \tabularnewline
Trimmed Mean ( 20 / 20 ) & 93285.2 & 506.253595698731 & 184.265752959735 \tabularnewline
Median & 93637 &  &  \tabularnewline
Midrange & 90705.5 &  &  \tabularnewline
Midmean - Weighted Average at Xnp & 92679.6774193548 &  &  \tabularnewline
Midmean - Weighted Average at X(n+1)p & 92938.1 &  &  \tabularnewline
Midmean - Empirical Distribution Function & 92679.6774193548 &  &  \tabularnewline
Midmean - Empirical Distribution Function - Averaging & 92938.1 &  &  \tabularnewline
Midmean - Empirical Distribution Function - Interpolation & 92938.1 &  &  \tabularnewline
Midmean - Closest Observation & 92679.6774193548 &  &  \tabularnewline
Midmean - True Basic - Statistics Graphics Toolkit & 92938.1 &  &  \tabularnewline
Midmean - MS Excel (old versions) & 92839.75 &  &  \tabularnewline
Number of observations & 60 &  &  \tabularnewline
\hline
\end{tabular}
%Source: https://freestatistics.org/blog/index.php?pk=293763&T=1

[TABLE]
[ROW][C]Central Tendency - Ungrouped Data[/C][/ROW]
[ROW][C]Measure[/C][C]Value[/C][C]S.E.[/C][C]Value/S.E.[/C][/ROW]
[ROW][C]Arithmetic Mean[/C][C]91945.4333333333[/C][C]775.715746531032[/C][C]118.529801340903[/C][/ROW]
[ROW][C]Geometric Mean[/C][C]91748.596211252[/C][C][/C][C][/C][/ROW]
[ROW][C]Harmonic Mean[/C][C]91548.3337599085[/C][C][/C][C][/C][/ROW]
[ROW][C]Quadratic Mean[/C][C]92138.2931852984[/C][C][/C][C][/C][/ROW]
[ROW][C]Winsorized Mean ( 1 / 20 )[/C][C]91948.8666666667[/C][C]772.978258319259[/C][C]118.95401413566[/C][/ROW]
[ROW][C]Winsorized Mean ( 2 / 20 )[/C][C]91945.5666666667[/C][C]768.681091575784[/C][C]119.614711060707[/C][/ROW]
[ROW][C]Winsorized Mean ( 3 / 20 )[/C][C]91954.2166666667[/C][C]762.303856810581[/C][C]120.626723641929[/C][/ROW]
[ROW][C]Winsorized Mean ( 4 / 20 )[/C][C]91929.55[/C][C]757.453055518003[/C][C]121.366663359925[/C][/ROW]
[ROW][C]Winsorized Mean ( 5 / 20 )[/C][C]91931.1333333333[/C][C]751.793508082324[/C][C]122.282425087484[/C][/ROW]
[ROW][C]Winsorized Mean ( 6 / 20 )[/C][C]91919.6333333333[/C][C]747.645610391869[/C][C]122.945459794989[/C][/ROW]
[ROW][C]Winsorized Mean ( 7 / 20 )[/C][C]91910.5333333333[/C][C]745.859466499205[/C][C]123.22768223983[/C][/ROW]
[ROW][C]Winsorized Mean ( 8 / 20 )[/C][C]91975.7333333333[/C][C]732.140355344978[/C][C]125.625821144629[/C][/ROW]
[ROW][C]Winsorized Mean ( 9 / 20 )[/C][C]92067.0833333333[/C][C]710.115486466522[/C][C]129.65085973755[/C][/ROW]
[ROW][C]Winsorized Mean ( 10 / 20 )[/C][C]92127.25[/C][C]696.235564162795[/C][C]132.321953577279[/C][/ROW]
[ROW][C]Winsorized Mean ( 11 / 20 )[/C][C]92125.7833333333[/C][C]695.845450522055[/C][C]132.39402982978[/C][/ROW]
[ROW][C]Winsorized Mean ( 12 / 20 )[/C][C]92134.3833333333[/C][C]694.07256662067[/C][C]132.74459727161[/C][/ROW]
[ROW][C]Winsorized Mean ( 13 / 20 )[/C][C]92181.4[/C][C]685.154658692243[/C][C]134.541010311376[/C][/ROW]
[ROW][C]Winsorized Mean ( 14 / 20 )[/C][C]92151.3[/C][C]675.560588851244[/C][C]136.407158026638[/C][/ROW]
[ROW][C]Winsorized Mean ( 15 / 20 )[/C][C]92309.55[/C][C]646.985502428847[/C][C]142.676380928879[/C][/ROW]
[ROW][C]Winsorized Mean ( 16 / 20 )[/C][C]92475.6833333333[/C][C]553.05006694599[/C][C]167.210328431918[/C][/ROW]
[ROW][C]Winsorized Mean ( 17 / 20 )[/C][C]92626.7[/C][C]503.304729778043[/C][C]184.037014793897[/C][/ROW]
[ROW][C]Winsorized Mean ( 18 / 20 )[/C][C]92815.4[/C][C]463.527020769071[/C][C]200.237301907456[/C][/ROW]
[ROW][C]Winsorized Mean ( 19 / 20 )[/C][C]92904.0666666667[/C][C]449.220415659812[/C][C]206.811764176412[/C][/ROW]
[ROW][C]Winsorized Mean ( 20 / 20 )[/C][C]92906.4[/C][C]408.737877686137[/C][C]227.300686018978[/C][/ROW]
[ROW][C]Trimmed Mean ( 1 / 20 )[/C][C]91988.1896551724[/C][C]768.985376355321[/C][C]119.62280751184[/C][/ROW]
[ROW][C]Trimmed Mean ( 2 / 20 )[/C][C]92030.3214285714[/C][C]763.324148225627[/C][C]120.565190610698[/C][/ROW]
[ROW][C]Trimmed Mean ( 3 / 20 )[/C][C]92077.4074074074[/C][C]758.30605084589[/C][C]121.425125521147[/C][/ROW]
[ROW][C]Trimmed Mean ( 4 / 20 )[/C][C]92124.7884615385[/C][C]754.119002103607[/C][C]122.16213648583[/C][/ROW]
[ROW][C]Trimmed Mean ( 5 / 20 )[/C][C]92183.36[/C][C]749.619383017754[/C][C]122.973554430911[/C][/ROW]
[ROW][C]Trimmed Mean ( 6 / 20 )[/C][C]92246.4166666667[/C][C]744.650141466165[/C][C]123.87886811522[/C][/ROW]
[ROW][C]Trimmed Mean ( 7 / 20 )[/C][C]92317.4565217391[/C][C]738.309674568779[/C][C]125.038936508124[/C][/ROW]
[ROW][C]Trimmed Mean ( 8 / 20 )[/C][C]92396.7272727273[/C][C]729.376696281037[/C][C]126.679022984751[/C][/ROW]
[ROW][C]Trimmed Mean ( 9 / 20 )[/C][C]92471.9047619048[/C][C]720.361649244404[/C][C]128.368722653267[/C][/ROW]
[ROW][C]Trimmed Mean ( 10 / 20 )[/C][C]92539.375[/C][C]713.087454347696[/C][C]129.772827211848[/C][/ROW]
[ROW][C]Trimmed Mean ( 11 / 20 )[/C][C]92604.4473684211[/C][C]705.493515608221[/C][C]131.261939790594[/C][/ROW]
[ROW][C]Trimmed Mean ( 12 / 20 )[/C][C]92676.9722222222[/C][C]693.5930872009[/C][C]133.618650376454[/C][/ROW]
[ROW][C]Trimmed Mean ( 13 / 20 )[/C][C]92756.7647058823[/C][C]676.088677824964[/C][C]137.196151552617[/C][/ROW]
[ROW][C]Trimmed Mean ( 14 / 20 )[/C][C]92839.75[/C][C]652.795588714539[/C][C]142.218715329889[/C][/ROW]
[ROW][C]Trimmed Mean ( 15 / 20 )[/C][C]92938.1[/C][C]620.721886656748[/C][C]149.725830517385[/C][/ROW]
[ROW][C]Trimmed Mean ( 16 / 20 )[/C][C]93027.8928571429[/C][C]583.005598045686[/C][C]159.566037048332[/C][/ROW]
[ROW][C]Trimmed Mean ( 17 / 20 )[/C][C]93107.5384615385[/C][C]560.274867242772[/C][C]166.181893754649[/C][/ROW]
[ROW][C]Trimmed Mean ( 18 / 20 )[/C][C]93178.25[/C][C]542.33331189929[/C][C]171.809933034877[/C][/ROW]
[ROW][C]Trimmed Mean ( 19 / 20 )[/C][C]93233.2272727273[/C][C]527.627311453284[/C][C]176.702807547865[/C][/ROW]
[ROW][C]Trimmed Mean ( 20 / 20 )[/C][C]93285.2[/C][C]506.253595698731[/C][C]184.265752959735[/C][/ROW]
[ROW][C]Median[/C][C]93637[/C][C][/C][C][/C][/ROW]
[ROW][C]Midrange[/C][C]90705.5[/C][C][/C][C][/C][/ROW]
[ROW][C]Midmean - Weighted Average at Xnp[/C][C]92679.6774193548[/C][C][/C][C][/C][/ROW]
[ROW][C]Midmean - Weighted Average at X(n+1)p[/C][C]92938.1[/C][C][/C][C][/C][/ROW]
[ROW][C]Midmean - Empirical Distribution Function[/C][C]92679.6774193548[/C][C][/C][C][/C][/ROW]
[ROW][C]Midmean - Empirical Distribution Function - Averaging[/C][C]92938.1[/C][C][/C][C][/C][/ROW]
[ROW][C]Midmean - Empirical Distribution Function - Interpolation[/C][C]92938.1[/C][C][/C][C][/C][/ROW]
[ROW][C]Midmean - Closest Observation[/C][C]92679.6774193548[/C][C][/C][C][/C][/ROW]
[ROW][C]Midmean - True Basic - Statistics Graphics Toolkit[/C][C]92938.1[/C][C][/C][C][/C][/ROW]
[ROW][C]Midmean - MS Excel (old versions)[/C][C]92839.75[/C][C][/C][C][/C][/ROW]
[ROW][C]Number of observations[/C][C]60[/C][C][/C][C][/C][/ROW]
[/TABLE]
Source: https://freestatistics.org/blog/index.php?pk=293763&T=1

Globally Unique Identifier (entire table): ba.freestatistics.org/blog/index.php?pk=293763&T=1

As an alternative you can also use a QR Code:  

The GUIDs for individual cells are displayed in the table below:

Central Tendency - Ungrouped Data
MeasureValueS.E.Value/S.E.
Arithmetic Mean91945.4333333333775.715746531032118.529801340903
Geometric Mean91748.596211252
Harmonic Mean91548.3337599085
Quadratic Mean92138.2931852984
Winsorized Mean ( 1 / 20 )91948.8666666667772.978258319259118.95401413566
Winsorized Mean ( 2 / 20 )91945.5666666667768.681091575784119.614711060707
Winsorized Mean ( 3 / 20 )91954.2166666667762.303856810581120.626723641929
Winsorized Mean ( 4 / 20 )91929.55757.453055518003121.366663359925
Winsorized Mean ( 5 / 20 )91931.1333333333751.793508082324122.282425087484
Winsorized Mean ( 6 / 20 )91919.6333333333747.645610391869122.945459794989
Winsorized Mean ( 7 / 20 )91910.5333333333745.859466499205123.22768223983
Winsorized Mean ( 8 / 20 )91975.7333333333732.140355344978125.625821144629
Winsorized Mean ( 9 / 20 )92067.0833333333710.115486466522129.65085973755
Winsorized Mean ( 10 / 20 )92127.25696.235564162795132.321953577279
Winsorized Mean ( 11 / 20 )92125.7833333333695.845450522055132.39402982978
Winsorized Mean ( 12 / 20 )92134.3833333333694.07256662067132.74459727161
Winsorized Mean ( 13 / 20 )92181.4685.154658692243134.541010311376
Winsorized Mean ( 14 / 20 )92151.3675.560588851244136.407158026638
Winsorized Mean ( 15 / 20 )92309.55646.985502428847142.676380928879
Winsorized Mean ( 16 / 20 )92475.6833333333553.05006694599167.210328431918
Winsorized Mean ( 17 / 20 )92626.7503.304729778043184.037014793897
Winsorized Mean ( 18 / 20 )92815.4463.527020769071200.237301907456
Winsorized Mean ( 19 / 20 )92904.0666666667449.220415659812206.811764176412
Winsorized Mean ( 20 / 20 )92906.4408.737877686137227.300686018978
Trimmed Mean ( 1 / 20 )91988.1896551724768.985376355321119.62280751184
Trimmed Mean ( 2 / 20 )92030.3214285714763.324148225627120.565190610698
Trimmed Mean ( 3 / 20 )92077.4074074074758.30605084589121.425125521147
Trimmed Mean ( 4 / 20 )92124.7884615385754.119002103607122.16213648583
Trimmed Mean ( 5 / 20 )92183.36749.619383017754122.973554430911
Trimmed Mean ( 6 / 20 )92246.4166666667744.650141466165123.87886811522
Trimmed Mean ( 7 / 20 )92317.4565217391738.309674568779125.038936508124
Trimmed Mean ( 8 / 20 )92396.7272727273729.376696281037126.679022984751
Trimmed Mean ( 9 / 20 )92471.9047619048720.361649244404128.368722653267
Trimmed Mean ( 10 / 20 )92539.375713.087454347696129.772827211848
Trimmed Mean ( 11 / 20 )92604.4473684211705.493515608221131.261939790594
Trimmed Mean ( 12 / 20 )92676.9722222222693.5930872009133.618650376454
Trimmed Mean ( 13 / 20 )92756.7647058823676.088677824964137.196151552617
Trimmed Mean ( 14 / 20 )92839.75652.795588714539142.218715329889
Trimmed Mean ( 15 / 20 )92938.1620.721886656748149.725830517385
Trimmed Mean ( 16 / 20 )93027.8928571429583.005598045686159.566037048332
Trimmed Mean ( 17 / 20 )93107.5384615385560.274867242772166.181893754649
Trimmed Mean ( 18 / 20 )93178.25542.33331189929171.809933034877
Trimmed Mean ( 19 / 20 )93233.2272727273527.627311453284176.702807547865
Trimmed Mean ( 20 / 20 )93285.2506.253595698731184.265752959735
Median93637
Midrange90705.5
Midmean - Weighted Average at Xnp92679.6774193548
Midmean - Weighted Average at X(n+1)p92938.1
Midmean - Empirical Distribution Function92679.6774193548
Midmean - Empirical Distribution Function - Averaging92938.1
Midmean - Empirical Distribution Function - Interpolation92938.1
Midmean - Closest Observation92679.6774193548
Midmean - True Basic - Statistics Graphics Toolkit92938.1
Midmean - MS Excel (old versions)92839.75
Number of observations60


Parameters (Session):
Parameters (R input):
R code (references can be found in the software module):
geomean <- function(x) {
return(exp(mean(log(x))))
}
harmean <- function(x) {
return(1/mean(1/x))
}
quamean <- function(x) {
return(sqrt(mean(x*x)))
}
winmean <- function(x) {
x <-sort(x[!is.na(x)])
n<-length(x)
denom <- 3
nodenom <- n/denom
if (nodenom>40) denom <- n/40
sqrtn = sqrt(n)
roundnodenom = floor(nodenom)
win <- array(NA,dim=c(roundnodenom,2))
for (j in 1:roundnodenom) {
win[j,1] <- (j*x[j+1]+sum(x[(j+1):(n-j)])+j*x[n-j])/n
win[j,2] <- sd(c(rep(x[j+1],j),x[(j+1):(n-j)],rep(x[n-j],j)))/sqrtn
}
return(win)
}
trimean <- function(x) {
x <-sort(x[!is.na(x)])
n<-length(x)
denom <- 3
nodenom <- n/denom
if (nodenom>40) denom <- n/40
sqrtn = sqrt(n)
roundnodenom = floor(nodenom)
tri <- array(NA,dim=c(roundnodenom,2))
for (j in 1:roundnodenom) {
tri[j,1] <- mean(x,trim=j/n)
tri[j,2] <- sd(x[(j+1):(n-j)]) / sqrt(n-j*2)
}
return(tri)
}
midrange <- function(x) {
return((max(x)+min(x))/2)
}
q1 <- function(data,n,p,i,f) {
np <- n*p;
i <<- floor(np)
f <<- np - i
qvalue <- (1-f)*data[i] + f*data[i+1]
}
q2 <- function(data,n,p,i,f) {
np <- (n+1)*p
i <<- floor(np)
f <<- np - i
qvalue <- (1-f)*data[i] + f*data[i+1]
}
q3 <- function(data,n,p,i,f) {
np <- n*p
i <<- floor(np)
f <<- np - i
if (f==0) {
qvalue <- data[i]
} else {
qvalue <- data[i+1]
}
}
q4 <- function(data,n,p,i,f) {
np <- n*p
i <<- floor(np)
f <<- np - i
if (f==0) {
qvalue <- (data[i]+data[i+1])/2
} else {
qvalue <- data[i+1]
}
}
q5 <- function(data,n,p,i,f) {
np <- (n-1)*p
i <<- floor(np)
f <<- np - i
if (f==0) {
qvalue <- data[i+1]
} else {
qvalue <- data[i+1] + f*(data[i+2]-data[i+1])
}
}
q6 <- function(data,n,p,i,f) {
np <- n*p+0.5
i <<- floor(np)
f <<- np - i
qvalue <- data[i]
}
q7 <- function(data,n,p,i,f) {
np <- (n+1)*p
i <<- floor(np)
f <<- np - i
if (f==0) {
qvalue <- data[i]
} else {
qvalue <- f*data[i] + (1-f)*data[i+1]
}
}
q8 <- function(data,n,p,i,f) {
np <- (n+1)*p
i <<- floor(np)
f <<- np - i
if (f==0) {
qvalue <- data[i]
} else {
if (f == 0.5) {
qvalue <- (data[i]+data[i+1])/2
} else {
if (f < 0.5) {
qvalue <- data[i]
} else {
qvalue <- data[i+1]
}
}
}
}
midmean <- function(x,def) {
x <-sort(x[!is.na(x)])
n<-length(x)
if (def==1) {
qvalue1 <- q1(x,n,0.25,i,f)
qvalue3 <- q1(x,n,0.75,i,f)
}
if (def==2) {
qvalue1 <- q2(x,n,0.25,i,f)
qvalue3 <- q2(x,n,0.75,i,f)
}
if (def==3) {
qvalue1 <- q3(x,n,0.25,i,f)
qvalue3 <- q3(x,n,0.75,i,f)
}
if (def==4) {
qvalue1 <- q4(x,n,0.25,i,f)
qvalue3 <- q4(x,n,0.75,i,f)
}
if (def==5) {
qvalue1 <- q5(x,n,0.25,i,f)
qvalue3 <- q5(x,n,0.75,i,f)
}
if (def==6) {
qvalue1 <- q6(x,n,0.25,i,f)
qvalue3 <- q6(x,n,0.75,i,f)
}
if (def==7) {
qvalue1 <- q7(x,n,0.25,i,f)
qvalue3 <- q7(x,n,0.75,i,f)
}
if (def==8) {
qvalue1 <- q8(x,n,0.25,i,f)
qvalue3 <- q8(x,n,0.75,i,f)
}
midm <- 0
myn <- 0
roundno4 <- round(n/4)
round3no4 <- round(3*n/4)
for (i in 1:n) {
if ((x[i]>=qvalue1) & (x[i]<=qvalue3)){
midm = midm + x[i]
myn = myn + 1
}
}
midm = midm / myn
return(midm)
}
(arm <- mean(x))
sqrtn <- sqrt(length(x))
(armse <- sd(x) / sqrtn)
(armose <- arm / armse)
(geo <- geomean(x))
(har <- harmean(x))
(qua <- quamean(x))
(win <- winmean(x))
(tri <- trimean(x))
(midr <- midrange(x))
midm <- array(NA,dim=8)
for (j in 1:8) midm[j] <- midmean(x,j)
midm
bitmap(file='test1.png')
lb <- win[,1] - 2*win[,2]
ub <- win[,1] + 2*win[,2]
if ((ylimmin == '') | (ylimmax == '')) plot(win[,1],type='b',main=main, xlab='j', pch=19, ylab='Winsorized Mean(j/n)', ylim=c(min(lb),max(ub))) else plot(win[,1],type='l',main=main, xlab='j', pch=19, ylab='Winsorized Mean(j/n)', ylim=c(ylimmin,ylimmax))
lines(ub,lty=3)
lines(lb,lty=3)
grid()
dev.off()
bitmap(file='test2.png')
lb <- tri[,1] - 2*tri[,2]
ub <- tri[,1] + 2*tri[,2]
if ((ylimmin == '') | (ylimmax == '')) plot(tri[,1],type='b',main=main, xlab='j', pch=19, ylab='Trimmed Mean(j/n)', ylim=c(min(lb),max(ub))) else plot(tri[,1],type='l',main=main, xlab='j', pch=19, ylab='Trimmed Mean(j/n)', ylim=c(ylimmin,ylimmax))
lines(ub,lty=3)
lines(lb,lty=3)
grid()
dev.off()
load(file='createtable')
a<-table.start()
a<-table.row.start(a)
a<-table.element(a,'Central Tendency - Ungrouped Data',4,TRUE)
a<-table.row.end(a)
a<-table.row.start(a)
a<-table.element(a,'Measure',header=TRUE)
a<-table.element(a,'Value',header=TRUE)
a<-table.element(a,'S.E.',header=TRUE)
a<-table.element(a,'Value/S.E.',header=TRUE)
a<-table.row.end(a)
a<-table.row.start(a)
a<-table.element(a,hyperlink('arithmetic_mean.htm', 'Arithmetic Mean', 'click to view the definition of the Arithmetic Mean'),header=TRUE)
a<-table.element(a,arm)
a<-table.element(a,hyperlink('arithmetic_mean_standard_error.htm', armse, 'click to view the definition of the Standard Error of the Arithmetic Mean'))
a<-table.element(a,armose)
a<-table.row.end(a)
a<-table.row.start(a)
a<-table.element(a,hyperlink('geometric_mean.htm', 'Geometric Mean', 'click to view the definition of the Geometric Mean'),header=TRUE)
a<-table.element(a,geo)
a<-table.element(a,'')
a<-table.row.end(a)
a<-table.row.start(a)
a<-table.element(a,hyperlink('harmonic_mean.htm', 'Harmonic Mean', 'click to view the definition of the Harmonic Mean'),header=TRUE)
a<-table.element(a,har)
a<-table.element(a,'')
a<-table.row.end(a)
a<-table.row.start(a)
a<-table.element(a,hyperlink('quadratic_mean.htm', 'Quadratic Mean', 'click to view the definition of the Quadratic Mean'),header=TRUE)
a<-table.element(a,qua)
a<-table.element(a,'')
a<-table.row.end(a)
for (j in 1:length(win[,1])) {
a<-table.row.start(a)
mylabel <- paste('Winsorized Mean (',j)
mylabel <- paste(mylabel,'/')
mylabel <- paste(mylabel,length(win[,1]))
mylabel <- paste(mylabel,')')
a<-table.element(a,hyperlink('winsorized_mean.htm', mylabel, 'click to view the definition of the Winsorized Mean'),header=TRUE)
a<-table.element(a,win[j,1])
a<-table.element(a,win[j,2])
a<-table.element(a,win[j,1]/win[j,2])
a<-table.row.end(a)
}
for (j in 1:length(tri[,1])) {
a<-table.row.start(a)
mylabel <- paste('Trimmed Mean (',j)
mylabel <- paste(mylabel,'/')
mylabel <- paste(mylabel,length(tri[,1]))
mylabel <- paste(mylabel,')')
a<-table.element(a,hyperlink('arithmetic_mean.htm', mylabel, 'click to view the definition of the Trimmed Mean'),header=TRUE)
a<-table.element(a,tri[j,1])
a<-table.element(a,tri[j,2])
a<-table.element(a,tri[j,1]/tri[j,2])
a<-table.row.end(a)
}
a<-table.row.start(a)
a<-table.element(a,hyperlink('median_1.htm', 'Median', 'click to view the definition of the Median'),header=TRUE)
a<-table.element(a,median(x))
a<-table.element(a,'')
a<-table.row.end(a)
a<-table.row.start(a)
a<-table.element(a,hyperlink('midrange.htm', 'Midrange', 'click to view the definition of the Midrange'),header=TRUE)
a<-table.element(a,midr)
a<-table.element(a,'')
a<-table.row.end(a)
a<-table.row.start(a)
mymid <- hyperlink('midmean.htm', 'Midmean', 'click to view the definition of the Midmean')
mylabel <- paste(mymid,hyperlink('method_1.htm','Weighted Average at Xnp',''),sep=' - ')
a<-table.element(a,mylabel,header=TRUE)
a<-table.element(a,midm[1])
a<-table.element(a,'')
a<-table.row.end(a)
a<-table.row.start(a)
mymid <- hyperlink('midmean.htm', 'Midmean', 'click to view the definition of the Midmean')
mylabel <- paste(mymid,hyperlink('method_2.htm','Weighted Average at X(n+1)p',''),sep=' - ')
a<-table.element(a,mylabel,header=TRUE)
a<-table.element(a,midm[2])
a<-table.element(a,'')
a<-table.row.end(a)
a<-table.row.start(a)
mymid <- hyperlink('midmean.htm', 'Midmean', 'click to view the definition of the Midmean')
mylabel <- paste(mymid,hyperlink('method_3.htm','Empirical Distribution Function',''),sep=' - ')
a<-table.element(a,mylabel,header=TRUE)
a<-table.element(a,midm[3])
a<-table.element(a,'')
a<-table.row.end(a)
a<-table.row.start(a)
mymid <- hyperlink('midmean.htm', 'Midmean', 'click to view the definition of the Midmean')
mylabel <- paste(mymid,hyperlink('method_4.htm','Empirical Distribution Function - Averaging',''),sep=' - ')
a<-table.element(a,mylabel,header=TRUE)
a<-table.element(a,midm[4])
a<-table.element(a,'')
a<-table.row.end(a)
a<-table.row.start(a)
mymid <- hyperlink('midmean.htm', 'Midmean', 'click to view the definition of the Midmean')
mylabel <- paste(mymid,hyperlink('method_5.htm','Empirical Distribution Function - Interpolation',''),sep=' - ')
a<-table.element(a,mylabel,header=TRUE)
a<-table.element(a,midm[5])
a<-table.element(a,'')
a<-table.row.end(a)
a<-table.row.start(a)
mymid <- hyperlink('midmean.htm', 'Midmean', 'click to view the definition of the Midmean')
mylabel <- paste(mymid,hyperlink('method_6.htm','Closest Observation',''),sep=' - ')
a<-table.element(a,mylabel,header=TRUE)
a<-table.element(a,midm[6])
a<-table.element(a,'')
a<-table.row.end(a)
a<-table.row.start(a)
mymid <- hyperlink('midmean.htm', 'Midmean', 'click to view the definition of the Midmean')
mylabel <- paste(mymid,hyperlink('method_7.htm','True Basic - Statistics Graphics Toolkit',''),sep=' - ')
a<-table.element(a,mylabel,header=TRUE)
a<-table.element(a,midm[7])
a<-table.element(a,'')
a<-table.row.end(a)
a<-table.row.start(a)
mymid <- hyperlink('midmean.htm', 'Midmean', 'click to view the definition of the Midmean')
mylabel <- paste(mymid,hyperlink('method_8.htm','MS Excel (old versions)',''),sep=' - ')
a<-table.element(a,mylabel,header=TRUE)
a<-table.element(a,midm[8])
a<-table.element(a,'')
a<-table.row.end(a)
a<-table.row.start(a)
a<-table.element(a,'Number of observations',header=TRUE)
a<-table.element(a,length(x))
a<-table.element(a,'')
a<-table.row.end(a)
a<-table.end(a)
table.save(a,file='mytable.tab')