Free Statistics

of Irreproducible Research!

Author's title

Author*Unverified author*
R Software Modulerwasp_autocorrelation.wasp
Title produced by software(Partial) Autocorrelation Function
Date of computationSat, 12 Mar 2016 10:43:41 +0000
Cite this page as followsStatistical Computations at FreeStatistics.org, Office for Research Development and Education, URL https://freestatistics.org/blog/index.php?v=date/2016/Mar/12/t145777952160wu1r5ma586hhb.htm/, Retrieved Sun, 05 May 2024 14:15:24 +0000
Statistical Computations at FreeStatistics.org, Office for Research Development and Education, URL https://freestatistics.org/blog/index.php?pk=293891, Retrieved Sun, 05 May 2024 14:15:24 +0000
QR Codes:

Original text written by user:
IsPrivate?No (this computation is public)
User-defined keywords
Estimated Impact99
Family? (F = Feedback message, R = changed R code, M = changed R Module, P = changed Parameters, D = changed Data)
-       [(Partial) Autocorrelation Function] [Autocorrelatie ei...] [2016-03-12 10:43:41] [f41d2dc125a0429ac7ee523034b5d7c0] [Current]
Feedback Forum

Post a new message
Dataseries X:
1.4272
1.3686
1.3569
1.3406
1.2565
1.2209
1.277
1.2894
1.3067
1.3898
1.3661
1.322
1.336
1.3649
1.3999
1.4442
1.4349
1.4388
1.4264
1.4343
1.377
1.3706
1.3556
1.3179
1.2905
1.3224
1.3201
1.3162
1.2789
1.2526
1.2288
1.24
1.2856
1.2974
1.2828
1.3119
1.3288
1.3359
1.2964
1.3026
1.2982
1.3189
1.308
1.331
1.3348
1.3635
1.3493
1.3704
1.361
1.3658
1.3823
1.3812
1.3732
1.3592
1.3539
1.3316
1.2901
1.2673
1.2472
1.2331
1.1621
1.135
1.0838
1.0779
1.115
1.1213
1.0996
1.1139
1.1221
1.1235
1.0736
1.0877


Summary of computational transaction
Raw Inputview raw input (R code)
Raw Outputview raw output of R engine
Computing time2 seconds
R Server'Gertrude Mary Cox' @ cox.wessa.net

\begin{tabular}{lllllllll}
\hline
Summary of computational transaction \tabularnewline
Raw Input & view raw input (R code)  \tabularnewline
Raw Output & view raw output of R engine  \tabularnewline
Computing time & 2 seconds \tabularnewline
R Server & 'Gertrude Mary Cox' @ cox.wessa.net \tabularnewline
\hline
\end{tabular}
%Source: https://freestatistics.org/blog/index.php?pk=293891&T=0

[TABLE]
[ROW][C]Summary of computational transaction[/C][/ROW]
[ROW][C]Raw Input[/C][C]view raw input (R code) [/C][/ROW]
[ROW][C]Raw Output[/C][C]view raw output of R engine [/C][/ROW]
[ROW][C]Computing time[/C][C]2 seconds[/C][/ROW]
[ROW][C]R Server[/C][C]'Gertrude Mary Cox' @ cox.wessa.net[/C][/ROW]
[/TABLE]
Source: https://freestatistics.org/blog/index.php?pk=293891&T=0

Globally Unique Identifier (entire table): ba.freestatistics.org/blog/index.php?pk=293891&T=0

As an alternative you can also use a QR Code:  

The GUIDs for individual cells are displayed in the table below:

Summary of computational transaction
Raw Inputview raw input (R code)
Raw Outputview raw output of R engine
Computing time2 seconds
R Server'Gertrude Mary Cox' @ cox.wessa.net


Autocorrelation Function
Time lag kACF(k)T-STATP-value
10.2050041.72740.044222
20.0100450.08460.466392
30.0854840.72030.236851
40.0566920.47770.317167
5-0.198727-1.67450.049216
60.1078630.90890.183248
70.0181710.15310.439372
8-0.054254-0.45720.324479
9-0.066549-0.56080.288366
100.0455880.38410.351015
11-0.228653-1.92670.029012
12-0.114457-0.96440.169051
13-0.145527-1.22620.112081
14-0.145209-1.22350.112584
15-0.164815-1.38880.084624
160.0118990.10030.460208
17-0.01906-0.16060.436431
180.1450021.22180.112911
190.0776270.65410.25758
200.0009650.00810.496769
21-0.186023-1.56750.060727
220.0421760.35540.361678
230.0009030.00760.496976
240.0222770.18770.425821
25-0.084214-0.70960.240138
260.1011960.85270.198347
27-0.00458-0.03860.484661
280.0288550.24310.404299
29-0.039456-0.33250.370261
30-0.00156-0.01310.494775
31-0.064422-0.54280.294473
320.1250111.05340.147873
330.075260.63410.264011
340.0473370.39890.345593
350.0095340.08030.468098
360.0938180.79050.215926
370.0525560.44280.329611
380.0453790.38240.351664
390.0134130.1130.455167
40-0.00761-0.06410.474527
41-0.043424-0.36590.357764
420.0032270.02720.489192
43-0.090844-0.76550.223266
44-0.088333-0.74430.229573
45-0.103665-0.87350.192669
46-0.093264-0.78590.217282
47-0.1439-1.21250.114666
48-0.106939-0.90110.185295

\begin{tabular}{lllllllll}
\hline
Autocorrelation Function \tabularnewline
Time lag k & ACF(k) & T-STAT & P-value \tabularnewline
1 & 0.205004 & 1.7274 & 0.044222 \tabularnewline
2 & 0.010045 & 0.0846 & 0.466392 \tabularnewline
3 & 0.085484 & 0.7203 & 0.236851 \tabularnewline
4 & 0.056692 & 0.4777 & 0.317167 \tabularnewline
5 & -0.198727 & -1.6745 & 0.049216 \tabularnewline
6 & 0.107863 & 0.9089 & 0.183248 \tabularnewline
7 & 0.018171 & 0.1531 & 0.439372 \tabularnewline
8 & -0.054254 & -0.4572 & 0.324479 \tabularnewline
9 & -0.066549 & -0.5608 & 0.288366 \tabularnewline
10 & 0.045588 & 0.3841 & 0.351015 \tabularnewline
11 & -0.228653 & -1.9267 & 0.029012 \tabularnewline
12 & -0.114457 & -0.9644 & 0.169051 \tabularnewline
13 & -0.145527 & -1.2262 & 0.112081 \tabularnewline
14 & -0.145209 & -1.2235 & 0.112584 \tabularnewline
15 & -0.164815 & -1.3888 & 0.084624 \tabularnewline
16 & 0.011899 & 0.1003 & 0.460208 \tabularnewline
17 & -0.01906 & -0.1606 & 0.436431 \tabularnewline
18 & 0.145002 & 1.2218 & 0.112911 \tabularnewline
19 & 0.077627 & 0.6541 & 0.25758 \tabularnewline
20 & 0.000965 & 0.0081 & 0.496769 \tabularnewline
21 & -0.186023 & -1.5675 & 0.060727 \tabularnewline
22 & 0.042176 & 0.3554 & 0.361678 \tabularnewline
23 & 0.000903 & 0.0076 & 0.496976 \tabularnewline
24 & 0.022277 & 0.1877 & 0.425821 \tabularnewline
25 & -0.084214 & -0.7096 & 0.240138 \tabularnewline
26 & 0.101196 & 0.8527 & 0.198347 \tabularnewline
27 & -0.00458 & -0.0386 & 0.484661 \tabularnewline
28 & 0.028855 & 0.2431 & 0.404299 \tabularnewline
29 & -0.039456 & -0.3325 & 0.370261 \tabularnewline
30 & -0.00156 & -0.0131 & 0.494775 \tabularnewline
31 & -0.064422 & -0.5428 & 0.294473 \tabularnewline
32 & 0.125011 & 1.0534 & 0.147873 \tabularnewline
33 & 0.07526 & 0.6341 & 0.264011 \tabularnewline
34 & 0.047337 & 0.3989 & 0.345593 \tabularnewline
35 & 0.009534 & 0.0803 & 0.468098 \tabularnewline
36 & 0.093818 & 0.7905 & 0.215926 \tabularnewline
37 & 0.052556 & 0.4428 & 0.329611 \tabularnewline
38 & 0.045379 & 0.3824 & 0.351664 \tabularnewline
39 & 0.013413 & 0.113 & 0.455167 \tabularnewline
40 & -0.00761 & -0.0641 & 0.474527 \tabularnewline
41 & -0.043424 & -0.3659 & 0.357764 \tabularnewline
42 & 0.003227 & 0.0272 & 0.489192 \tabularnewline
43 & -0.090844 & -0.7655 & 0.223266 \tabularnewline
44 & -0.088333 & -0.7443 & 0.229573 \tabularnewline
45 & -0.103665 & -0.8735 & 0.192669 \tabularnewline
46 & -0.093264 & -0.7859 & 0.217282 \tabularnewline
47 & -0.1439 & -1.2125 & 0.114666 \tabularnewline
48 & -0.106939 & -0.9011 & 0.185295 \tabularnewline
\hline
\end{tabular}
%Source: https://freestatistics.org/blog/index.php?pk=293891&T=1

[TABLE]
[ROW][C]Autocorrelation Function[/C][/ROW]
[ROW][C]Time lag k[/C][C]ACF(k)[/C][C]T-STAT[/C][C]P-value[/C][/ROW]
[ROW][C]1[/C][C]0.205004[/C][C]1.7274[/C][C]0.044222[/C][/ROW]
[ROW][C]2[/C][C]0.010045[/C][C]0.0846[/C][C]0.466392[/C][/ROW]
[ROW][C]3[/C][C]0.085484[/C][C]0.7203[/C][C]0.236851[/C][/ROW]
[ROW][C]4[/C][C]0.056692[/C][C]0.4777[/C][C]0.317167[/C][/ROW]
[ROW][C]5[/C][C]-0.198727[/C][C]-1.6745[/C][C]0.049216[/C][/ROW]
[ROW][C]6[/C][C]0.107863[/C][C]0.9089[/C][C]0.183248[/C][/ROW]
[ROW][C]7[/C][C]0.018171[/C][C]0.1531[/C][C]0.439372[/C][/ROW]
[ROW][C]8[/C][C]-0.054254[/C][C]-0.4572[/C][C]0.324479[/C][/ROW]
[ROW][C]9[/C][C]-0.066549[/C][C]-0.5608[/C][C]0.288366[/C][/ROW]
[ROW][C]10[/C][C]0.045588[/C][C]0.3841[/C][C]0.351015[/C][/ROW]
[ROW][C]11[/C][C]-0.228653[/C][C]-1.9267[/C][C]0.029012[/C][/ROW]
[ROW][C]12[/C][C]-0.114457[/C][C]-0.9644[/C][C]0.169051[/C][/ROW]
[ROW][C]13[/C][C]-0.145527[/C][C]-1.2262[/C][C]0.112081[/C][/ROW]
[ROW][C]14[/C][C]-0.145209[/C][C]-1.2235[/C][C]0.112584[/C][/ROW]
[ROW][C]15[/C][C]-0.164815[/C][C]-1.3888[/C][C]0.084624[/C][/ROW]
[ROW][C]16[/C][C]0.011899[/C][C]0.1003[/C][C]0.460208[/C][/ROW]
[ROW][C]17[/C][C]-0.01906[/C][C]-0.1606[/C][C]0.436431[/C][/ROW]
[ROW][C]18[/C][C]0.145002[/C][C]1.2218[/C][C]0.112911[/C][/ROW]
[ROW][C]19[/C][C]0.077627[/C][C]0.6541[/C][C]0.25758[/C][/ROW]
[ROW][C]20[/C][C]0.000965[/C][C]0.0081[/C][C]0.496769[/C][/ROW]
[ROW][C]21[/C][C]-0.186023[/C][C]-1.5675[/C][C]0.060727[/C][/ROW]
[ROW][C]22[/C][C]0.042176[/C][C]0.3554[/C][C]0.361678[/C][/ROW]
[ROW][C]23[/C][C]0.000903[/C][C]0.0076[/C][C]0.496976[/C][/ROW]
[ROW][C]24[/C][C]0.022277[/C][C]0.1877[/C][C]0.425821[/C][/ROW]
[ROW][C]25[/C][C]-0.084214[/C][C]-0.7096[/C][C]0.240138[/C][/ROW]
[ROW][C]26[/C][C]0.101196[/C][C]0.8527[/C][C]0.198347[/C][/ROW]
[ROW][C]27[/C][C]-0.00458[/C][C]-0.0386[/C][C]0.484661[/C][/ROW]
[ROW][C]28[/C][C]0.028855[/C][C]0.2431[/C][C]0.404299[/C][/ROW]
[ROW][C]29[/C][C]-0.039456[/C][C]-0.3325[/C][C]0.370261[/C][/ROW]
[ROW][C]30[/C][C]-0.00156[/C][C]-0.0131[/C][C]0.494775[/C][/ROW]
[ROW][C]31[/C][C]-0.064422[/C][C]-0.5428[/C][C]0.294473[/C][/ROW]
[ROW][C]32[/C][C]0.125011[/C][C]1.0534[/C][C]0.147873[/C][/ROW]
[ROW][C]33[/C][C]0.07526[/C][C]0.6341[/C][C]0.264011[/C][/ROW]
[ROW][C]34[/C][C]0.047337[/C][C]0.3989[/C][C]0.345593[/C][/ROW]
[ROW][C]35[/C][C]0.009534[/C][C]0.0803[/C][C]0.468098[/C][/ROW]
[ROW][C]36[/C][C]0.093818[/C][C]0.7905[/C][C]0.215926[/C][/ROW]
[ROW][C]37[/C][C]0.052556[/C][C]0.4428[/C][C]0.329611[/C][/ROW]
[ROW][C]38[/C][C]0.045379[/C][C]0.3824[/C][C]0.351664[/C][/ROW]
[ROW][C]39[/C][C]0.013413[/C][C]0.113[/C][C]0.455167[/C][/ROW]
[ROW][C]40[/C][C]-0.00761[/C][C]-0.0641[/C][C]0.474527[/C][/ROW]
[ROW][C]41[/C][C]-0.043424[/C][C]-0.3659[/C][C]0.357764[/C][/ROW]
[ROW][C]42[/C][C]0.003227[/C][C]0.0272[/C][C]0.489192[/C][/ROW]
[ROW][C]43[/C][C]-0.090844[/C][C]-0.7655[/C][C]0.223266[/C][/ROW]
[ROW][C]44[/C][C]-0.088333[/C][C]-0.7443[/C][C]0.229573[/C][/ROW]
[ROW][C]45[/C][C]-0.103665[/C][C]-0.8735[/C][C]0.192669[/C][/ROW]
[ROW][C]46[/C][C]-0.093264[/C][C]-0.7859[/C][C]0.217282[/C][/ROW]
[ROW][C]47[/C][C]-0.1439[/C][C]-1.2125[/C][C]0.114666[/C][/ROW]
[ROW][C]48[/C][C]-0.106939[/C][C]-0.9011[/C][C]0.185295[/C][/ROW]
[/TABLE]
Source: https://freestatistics.org/blog/index.php?pk=293891&T=1

Globally Unique Identifier (entire table): ba.freestatistics.org/blog/index.php?pk=293891&T=1

As an alternative you can also use a QR Code:  

The GUIDs for individual cells are displayed in the table below:

Autocorrelation Function
Time lag kACF(k)T-STATP-value
10.2050041.72740.044222
20.0100450.08460.466392
30.0854840.72030.236851
40.0566920.47770.317167
5-0.198727-1.67450.049216
60.1078630.90890.183248
70.0181710.15310.439372
8-0.054254-0.45720.324479
9-0.066549-0.56080.288366
100.0455880.38410.351015
11-0.228653-1.92670.029012
12-0.114457-0.96440.169051
13-0.145527-1.22620.112081
14-0.145209-1.22350.112584
15-0.164815-1.38880.084624
160.0118990.10030.460208
17-0.01906-0.16060.436431
180.1450021.22180.112911
190.0776270.65410.25758
200.0009650.00810.496769
21-0.186023-1.56750.060727
220.0421760.35540.361678
230.0009030.00760.496976
240.0222770.18770.425821
25-0.084214-0.70960.240138
260.1011960.85270.198347
27-0.00458-0.03860.484661
280.0288550.24310.404299
29-0.039456-0.33250.370261
30-0.00156-0.01310.494775
31-0.064422-0.54280.294473
320.1250111.05340.147873
330.075260.63410.264011
340.0473370.39890.345593
350.0095340.08030.468098
360.0938180.79050.215926
370.0525560.44280.329611
380.0453790.38240.351664
390.0134130.1130.455167
40-0.00761-0.06410.474527
41-0.043424-0.36590.357764
420.0032270.02720.489192
43-0.090844-0.76550.223266
44-0.088333-0.74430.229573
45-0.103665-0.87350.192669
46-0.093264-0.78590.217282
47-0.1439-1.21250.114666
48-0.106939-0.90110.185295


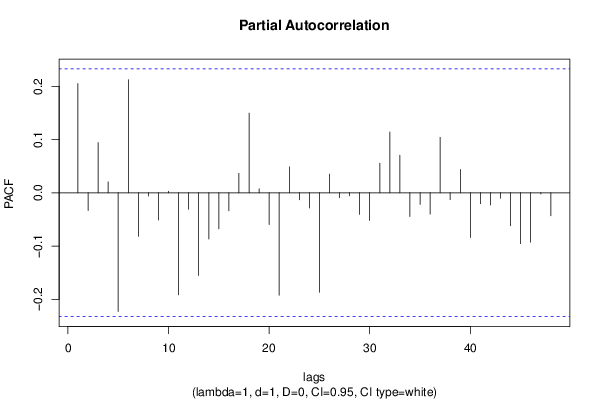
Partial Autocorrelation Function
Time lag kPACF(k)T-STATP-value
10.2050041.72740.044222
2-0.033385-0.28130.389648
30.0942630.79430.214843
40.0205870.17350.431387
5-0.22306-1.87950.032138
60.2123611.78940.038908
7-0.081863-0.68980.246287
8-0.006172-0.0520.479334
9-0.051032-0.430.334248
100.0030160.02540.489898
11-0.19166-1.6150.055378
12-0.030817-0.25970.397934
13-0.155448-1.30980.097239
14-0.086854-0.73180.233335
15-0.067537-0.56910.285549
16-0.033621-0.28330.388889
170.036540.30790.379533
180.1496471.26090.105727
190.0076910.06480.474255
20-0.059615-0.50230.308497
21-0.192446-1.62160.054663
220.0486350.40980.34159
23-0.013168-0.1110.455983
24-0.02854-0.24050.405325
25-0.186752-1.57360.060013
260.0351320.2960.384035
27-0.009239-0.07780.469083
28-0.005508-0.04640.481555
29-0.040556-0.34170.36678
30-0.052149-0.43940.330848
310.0554840.46750.32078
320.1140930.96140.169816
330.0705170.59420.277139
34-0.04451-0.3750.354371
35-0.02176-0.18340.427521
36-0.040057-0.33750.368359
370.1040980.87710.191684
38-0.01279-0.10780.457242
390.043820.36920.356526
40-0.08406-0.70830.240537
41-0.020721-0.17460.430945
42-0.022902-0.1930.423764
43-0.010229-0.08620.465779
44-0.061775-0.52050.302157
45-0.095494-0.80460.211855
46-0.092698-0.78110.218675
47-0.002186-0.01840.492677
48-0.043045-0.36270.35895

\begin{tabular}{lllllllll}
\hline
Partial Autocorrelation Function \tabularnewline
Time lag k & PACF(k) & T-STAT & P-value \tabularnewline
1 & 0.205004 & 1.7274 & 0.044222 \tabularnewline
2 & -0.033385 & -0.2813 & 0.389648 \tabularnewline
3 & 0.094263 & 0.7943 & 0.214843 \tabularnewline
4 & 0.020587 & 0.1735 & 0.431387 \tabularnewline
5 & -0.22306 & -1.8795 & 0.032138 \tabularnewline
6 & 0.212361 & 1.7894 & 0.038908 \tabularnewline
7 & -0.081863 & -0.6898 & 0.246287 \tabularnewline
8 & -0.006172 & -0.052 & 0.479334 \tabularnewline
9 & -0.051032 & -0.43 & 0.334248 \tabularnewline
10 & 0.003016 & 0.0254 & 0.489898 \tabularnewline
11 & -0.19166 & -1.615 & 0.055378 \tabularnewline
12 & -0.030817 & -0.2597 & 0.397934 \tabularnewline
13 & -0.155448 & -1.3098 & 0.097239 \tabularnewline
14 & -0.086854 & -0.7318 & 0.233335 \tabularnewline
15 & -0.067537 & -0.5691 & 0.285549 \tabularnewline
16 & -0.033621 & -0.2833 & 0.388889 \tabularnewline
17 & 0.03654 & 0.3079 & 0.379533 \tabularnewline
18 & 0.149647 & 1.2609 & 0.105727 \tabularnewline
19 & 0.007691 & 0.0648 & 0.474255 \tabularnewline
20 & -0.059615 & -0.5023 & 0.308497 \tabularnewline
21 & -0.192446 & -1.6216 & 0.054663 \tabularnewline
22 & 0.048635 & 0.4098 & 0.34159 \tabularnewline
23 & -0.013168 & -0.111 & 0.455983 \tabularnewline
24 & -0.02854 & -0.2405 & 0.405325 \tabularnewline
25 & -0.186752 & -1.5736 & 0.060013 \tabularnewline
26 & 0.035132 & 0.296 & 0.384035 \tabularnewline
27 & -0.009239 & -0.0778 & 0.469083 \tabularnewline
28 & -0.005508 & -0.0464 & 0.481555 \tabularnewline
29 & -0.040556 & -0.3417 & 0.36678 \tabularnewline
30 & -0.052149 & -0.4394 & 0.330848 \tabularnewline
31 & 0.055484 & 0.4675 & 0.32078 \tabularnewline
32 & 0.114093 & 0.9614 & 0.169816 \tabularnewline
33 & 0.070517 & 0.5942 & 0.277139 \tabularnewline
34 & -0.04451 & -0.375 & 0.354371 \tabularnewline
35 & -0.02176 & -0.1834 & 0.427521 \tabularnewline
36 & -0.040057 & -0.3375 & 0.368359 \tabularnewline
37 & 0.104098 & 0.8771 & 0.191684 \tabularnewline
38 & -0.01279 & -0.1078 & 0.457242 \tabularnewline
39 & 0.04382 & 0.3692 & 0.356526 \tabularnewline
40 & -0.08406 & -0.7083 & 0.240537 \tabularnewline
41 & -0.020721 & -0.1746 & 0.430945 \tabularnewline
42 & -0.022902 & -0.193 & 0.423764 \tabularnewline
43 & -0.010229 & -0.0862 & 0.465779 \tabularnewline
44 & -0.061775 & -0.5205 & 0.302157 \tabularnewline
45 & -0.095494 & -0.8046 & 0.211855 \tabularnewline
46 & -0.092698 & -0.7811 & 0.218675 \tabularnewline
47 & -0.002186 & -0.0184 & 0.492677 \tabularnewline
48 & -0.043045 & -0.3627 & 0.35895 \tabularnewline
\hline
\end{tabular}
%Source: https://freestatistics.org/blog/index.php?pk=293891&T=2

[TABLE]
[ROW][C]Partial Autocorrelation Function[/C][/ROW]
[ROW][C]Time lag k[/C][C]PACF(k)[/C][C]T-STAT[/C][C]P-value[/C][/ROW]
[ROW][C]1[/C][C]0.205004[/C][C]1.7274[/C][C]0.044222[/C][/ROW]
[ROW][C]2[/C][C]-0.033385[/C][C]-0.2813[/C][C]0.389648[/C][/ROW]
[ROW][C]3[/C][C]0.094263[/C][C]0.7943[/C][C]0.214843[/C][/ROW]
[ROW][C]4[/C][C]0.020587[/C][C]0.1735[/C][C]0.431387[/C][/ROW]
[ROW][C]5[/C][C]-0.22306[/C][C]-1.8795[/C][C]0.032138[/C][/ROW]
[ROW][C]6[/C][C]0.212361[/C][C]1.7894[/C][C]0.038908[/C][/ROW]
[ROW][C]7[/C][C]-0.081863[/C][C]-0.6898[/C][C]0.246287[/C][/ROW]
[ROW][C]8[/C][C]-0.006172[/C][C]-0.052[/C][C]0.479334[/C][/ROW]
[ROW][C]9[/C][C]-0.051032[/C][C]-0.43[/C][C]0.334248[/C][/ROW]
[ROW][C]10[/C][C]0.003016[/C][C]0.0254[/C][C]0.489898[/C][/ROW]
[ROW][C]11[/C][C]-0.19166[/C][C]-1.615[/C][C]0.055378[/C][/ROW]
[ROW][C]12[/C][C]-0.030817[/C][C]-0.2597[/C][C]0.397934[/C][/ROW]
[ROW][C]13[/C][C]-0.155448[/C][C]-1.3098[/C][C]0.097239[/C][/ROW]
[ROW][C]14[/C][C]-0.086854[/C][C]-0.7318[/C][C]0.233335[/C][/ROW]
[ROW][C]15[/C][C]-0.067537[/C][C]-0.5691[/C][C]0.285549[/C][/ROW]
[ROW][C]16[/C][C]-0.033621[/C][C]-0.2833[/C][C]0.388889[/C][/ROW]
[ROW][C]17[/C][C]0.03654[/C][C]0.3079[/C][C]0.379533[/C][/ROW]
[ROW][C]18[/C][C]0.149647[/C][C]1.2609[/C][C]0.105727[/C][/ROW]
[ROW][C]19[/C][C]0.007691[/C][C]0.0648[/C][C]0.474255[/C][/ROW]
[ROW][C]20[/C][C]-0.059615[/C][C]-0.5023[/C][C]0.308497[/C][/ROW]
[ROW][C]21[/C][C]-0.192446[/C][C]-1.6216[/C][C]0.054663[/C][/ROW]
[ROW][C]22[/C][C]0.048635[/C][C]0.4098[/C][C]0.34159[/C][/ROW]
[ROW][C]23[/C][C]-0.013168[/C][C]-0.111[/C][C]0.455983[/C][/ROW]
[ROW][C]24[/C][C]-0.02854[/C][C]-0.2405[/C][C]0.405325[/C][/ROW]
[ROW][C]25[/C][C]-0.186752[/C][C]-1.5736[/C][C]0.060013[/C][/ROW]
[ROW][C]26[/C][C]0.035132[/C][C]0.296[/C][C]0.384035[/C][/ROW]
[ROW][C]27[/C][C]-0.009239[/C][C]-0.0778[/C][C]0.469083[/C][/ROW]
[ROW][C]28[/C][C]-0.005508[/C][C]-0.0464[/C][C]0.481555[/C][/ROW]
[ROW][C]29[/C][C]-0.040556[/C][C]-0.3417[/C][C]0.36678[/C][/ROW]
[ROW][C]30[/C][C]-0.052149[/C][C]-0.4394[/C][C]0.330848[/C][/ROW]
[ROW][C]31[/C][C]0.055484[/C][C]0.4675[/C][C]0.32078[/C][/ROW]
[ROW][C]32[/C][C]0.114093[/C][C]0.9614[/C][C]0.169816[/C][/ROW]
[ROW][C]33[/C][C]0.070517[/C][C]0.5942[/C][C]0.277139[/C][/ROW]
[ROW][C]34[/C][C]-0.04451[/C][C]-0.375[/C][C]0.354371[/C][/ROW]
[ROW][C]35[/C][C]-0.02176[/C][C]-0.1834[/C][C]0.427521[/C][/ROW]
[ROW][C]36[/C][C]-0.040057[/C][C]-0.3375[/C][C]0.368359[/C][/ROW]
[ROW][C]37[/C][C]0.104098[/C][C]0.8771[/C][C]0.191684[/C][/ROW]
[ROW][C]38[/C][C]-0.01279[/C][C]-0.1078[/C][C]0.457242[/C][/ROW]
[ROW][C]39[/C][C]0.04382[/C][C]0.3692[/C][C]0.356526[/C][/ROW]
[ROW][C]40[/C][C]-0.08406[/C][C]-0.7083[/C][C]0.240537[/C][/ROW]
[ROW][C]41[/C][C]-0.020721[/C][C]-0.1746[/C][C]0.430945[/C][/ROW]
[ROW][C]42[/C][C]-0.022902[/C][C]-0.193[/C][C]0.423764[/C][/ROW]
[ROW][C]43[/C][C]-0.010229[/C][C]-0.0862[/C][C]0.465779[/C][/ROW]
[ROW][C]44[/C][C]-0.061775[/C][C]-0.5205[/C][C]0.302157[/C][/ROW]
[ROW][C]45[/C][C]-0.095494[/C][C]-0.8046[/C][C]0.211855[/C][/ROW]
[ROW][C]46[/C][C]-0.092698[/C][C]-0.7811[/C][C]0.218675[/C][/ROW]
[ROW][C]47[/C][C]-0.002186[/C][C]-0.0184[/C][C]0.492677[/C][/ROW]
[ROW][C]48[/C][C]-0.043045[/C][C]-0.3627[/C][C]0.35895[/C][/ROW]
[/TABLE]
Source: https://freestatistics.org/blog/index.php?pk=293891&T=2

Globally Unique Identifier (entire table): ba.freestatistics.org/blog/index.php?pk=293891&T=2

As an alternative you can also use a QR Code:  

The GUIDs for individual cells are displayed in the table below:

Partial Autocorrelation Function
Time lag kPACF(k)T-STATP-value
10.2050041.72740.044222
2-0.033385-0.28130.389648
30.0942630.79430.214843
40.0205870.17350.431387
5-0.22306-1.87950.032138
60.2123611.78940.038908
7-0.081863-0.68980.246287
8-0.006172-0.0520.479334
9-0.051032-0.430.334248
100.0030160.02540.489898
11-0.19166-1.6150.055378
12-0.030817-0.25970.397934
13-0.155448-1.30980.097239
14-0.086854-0.73180.233335
15-0.067537-0.56910.285549
16-0.033621-0.28330.388889
170.036540.30790.379533
180.1496471.26090.105727
190.0076910.06480.474255
20-0.059615-0.50230.308497
21-0.192446-1.62160.054663
220.0486350.40980.34159
23-0.013168-0.1110.455983
24-0.02854-0.24050.405325
25-0.186752-1.57360.060013
260.0351320.2960.384035
27-0.009239-0.07780.469083
28-0.005508-0.04640.481555
29-0.040556-0.34170.36678
30-0.052149-0.43940.330848
310.0554840.46750.32078
320.1140930.96140.169816
330.0705170.59420.277139
34-0.04451-0.3750.354371
35-0.02176-0.18340.427521
36-0.040057-0.33750.368359
370.1040980.87710.191684
38-0.01279-0.10780.457242
390.043820.36920.356526
40-0.08406-0.70830.240537
41-0.020721-0.17460.430945
42-0.022902-0.1930.423764
43-0.010229-0.08620.465779
44-0.061775-0.52050.302157
45-0.095494-0.80460.211855
46-0.092698-0.78110.218675
47-0.002186-0.01840.492677
48-0.043045-0.36270.35895


Parameters (Session):
par1 = 48 ; par2 = 1 ; par3 = 1 ; par4 = 0 ; par5 = 12 ; par6 = White Noise ; par7 = 0.95 ;
Parameters (R input):
par1 = 48 ; par2 = 1 ; par3 = 1 ; par4 = 0 ; par5 = 12 ; par6 = White Noise ; par7 = 0.95 ; par8 = ;
R code (references can be found in the software module):
par8 <- ''
par7 <- '0.95'
par6 <- 'White Noise'
par5 <- '12'
par4 <- '0'
par3 <- '0'
par2 <- '1'
par1 <- '48'
if (par1 == 'Default') {
par1 = 10*log10(length(x))
} else {
par1 <- as.numeric(par1)
}
par2 <- as.numeric(par2)
par3 <- as.numeric(par3)
par4 <- as.numeric(par4)
par5 <- as.numeric(par5)
if (par6 == 'White Noise') par6 <- 'white' else par6 <- 'ma'
par7 <- as.numeric(par7)
if (par8 != '') par8 <- as.numeric(par8)
x <- na.omit(x)
ox <- x
if (par8 == '') {
if (par2 == 0) {
x <- log(x)
} else {
x <- (x ^ par2 - 1) / par2
}
} else {
x <- log(x,base=par8)
}
if (par3 > 0) x <- diff(x,lag=1,difference=par3)
if (par4 > 0) x <- diff(x,lag=par5,difference=par4)
bitmap(file='picts.png')
op <- par(mfrow=c(2,1))
plot(ox,type='l',main='Original Time Series',xlab='time',ylab='value')
if (par8=='') {
mytitle <- paste('Working Time Series (lambda=',par2,', d=',par3,', D=',par4,')',sep='')
mysub <- paste('(lambda=',par2,', d=',par3,', D=',par4,', CI=', par7, ', CI type=',par6,')',sep='')
} else {
mytitle <- paste('Working Time Series (base=',par8,', d=',par3,', D=',par4,')',sep='')
mysub <- paste('(base=',par8,', d=',par3,', D=',par4,', CI=', par7, ', CI type=',par6,')',sep='')
}
plot(x,type='l', main=mytitle,xlab='time',ylab='value')
par(op)
dev.off()
bitmap(file='pic1.png')
racf <- acf(x, par1, main='Autocorrelation', xlab='time lag', ylab='ACF', ci.type=par6, ci=par7, sub=mysub)
dev.off()
bitmap(file='pic2.png')
rpacf <- pacf(x,par1,main='Partial Autocorrelation',xlab='lags',ylab='PACF',sub=mysub)
dev.off()
(myacf <- c(racf$acf))
(mypacf <- c(rpacf$acf))
lengthx <- length(x)
sqrtn <- sqrt(lengthx)
load(file='createtable')
a<-table.start()
a<-table.row.start(a)
a<-table.element(a,'Autocorrelation Function',4,TRUE)
a<-table.row.end(a)
a<-table.row.start(a)
a<-table.element(a,'Time lag k',header=TRUE)
a<-table.element(a,hyperlink('basics.htm','ACF(k)','click here for more information about the Autocorrelation Function'),header=TRUE)
a<-table.element(a,'T-STAT',header=TRUE)
a<-table.element(a,'P-value',header=TRUE)
a<-table.row.end(a)
for (i in 2:(par1+1)) {
a<-table.row.start(a)
a<-table.element(a,i-1,header=TRUE)
a<-table.element(a,round(myacf[i],6))
mytstat <- myacf[i]*sqrtn
a<-table.element(a,round(mytstat,4))
a<-table.element(a,round(1-pt(abs(mytstat),lengthx),6))
a<-table.row.end(a)
}
a<-table.end(a)
table.save(a,file='mytable.tab')
a<-table.start()
a<-table.row.start(a)
a<-table.element(a,'Partial Autocorrelation Function',4,TRUE)
a<-table.row.end(a)
a<-table.row.start(a)
a<-table.element(a,'Time lag k',header=TRUE)
a<-table.element(a,hyperlink('basics.htm','PACF(k)','click here for more information about the Partial Autocorrelation Function'),header=TRUE)
a<-table.element(a,'T-STAT',header=TRUE)
a<-table.element(a,'P-value',header=TRUE)
a<-table.row.end(a)
for (i in 1:par1) {
a<-table.row.start(a)
a<-table.element(a,i,header=TRUE)
a<-table.element(a,round(mypacf[i],6))
mytstat <- mypacf[i]*sqrtn
a<-table.element(a,round(mytstat,4))
a<-table.element(a,round(1-pt(abs(mytstat),lengthx),6))
a<-table.row.end(a)
}
a<-table.end(a)
table.save(a,file='mytable1.tab')