Free Statistics

of Irreproducible Research!

Author's title

Author*Unverified author*
R Software Modulerwasp_autocorrelation.wasp
Title produced by software(Partial) Autocorrelation Function
Date of computationSat, 12 Mar 2016 19:24:10 +0000
Cite this page as followsStatistical Computations at FreeStatistics.org, Office for Research Development and Education, URL https://freestatistics.org/blog/index.php?v=date/2016/Mar/12/t1457810661qnhtpr64uchbm52.htm/, Retrieved Sun, 05 May 2024 11:23:45 +0000
Statistical Computations at FreeStatistics.org, Office for Research Development and Education, URL https://freestatistics.org/blog/index.php?pk=293944, Retrieved Sun, 05 May 2024 11:23:45 +0000
QR Codes:

Original text written by user:
IsPrivate?No (this computation is public)
User-defined keywords
Estimated Impact95
Family? (F = Feedback message, R = changed R code, M = changed R Module, P = changed Parameters, D = changed Data)
-       [(Partial) Autocorrelation Function] [] [2016-03-12 19:24:10] [9b4dafad127b39cd929ee42874de7246] [Current]
Feedback Forum

Post a new message
Dataseries X:
113149
112534
108783
106640
102617
102191
117359
116083
108666
105017
100918
103907
105732
103409
100255
97036
94055
92523
106380
104846
101411
98072
95678
99148
106813
106782
103496
100854
99592
98923
110497
114783
113551
112376
111683
113467
117277
117442
115640
114872
111628
111098
124301
125847
125323
122394
121164
123963
130549
128563
125418
121982
117708
116905
128862
129655
128649
126084
123725
123974


Summary of computational transaction
Raw Inputview raw input (R code)
Raw Outputview raw output of R engine
Computing time2 seconds
R Server'Gwilym Jenkins' @ jenkins.wessa.net

\begin{tabular}{lllllllll}
\hline
Summary of computational transaction \tabularnewline
Raw Input & view raw input (R code)  \tabularnewline
Raw Output & view raw output of R engine  \tabularnewline
Computing time & 2 seconds \tabularnewline
R Server & 'Gwilym Jenkins' @ jenkins.wessa.net \tabularnewline
\hline
\end{tabular}
%Source: https://freestatistics.org/blog/index.php?pk=293944&T=0

[TABLE]
[ROW][C]Summary of computational transaction[/C][/ROW]
[ROW][C]Raw Input[/C][C]view raw input (R code) [/C][/ROW]
[ROW][C]Raw Output[/C][C]view raw output of R engine [/C][/ROW]
[ROW][C]Computing time[/C][C]2 seconds[/C][/ROW]
[ROW][C]R Server[/C][C]'Gwilym Jenkins' @ jenkins.wessa.net[/C][/ROW]
[/TABLE]
Source: https://freestatistics.org/blog/index.php?pk=293944&T=0

Globally Unique Identifier (entire table): ba.freestatistics.org/blog/index.php?pk=293944&T=0

As an alternative you can also use a QR Code:  

The GUIDs for individual cells are displayed in the table below:

Summary of computational transaction
Raw Inputview raw input (R code)
Raw Outputview raw output of R engine
Computing time2 seconds
R Server'Gwilym Jenkins' @ jenkins.wessa.net


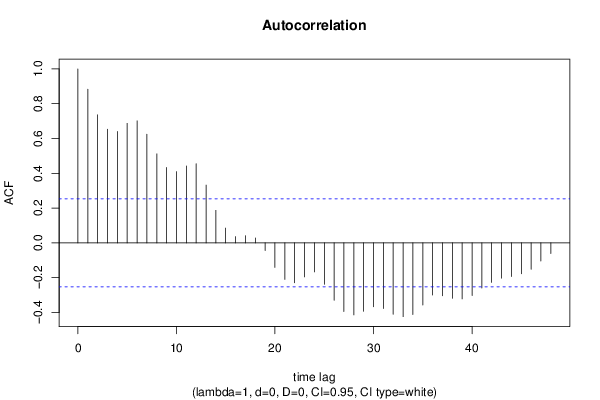
Autocorrelation Function
Time lag kACF(k)T-STATP-value
10.882926.83910
20.7360955.70180
30.6534575.06172e-06
40.6407554.96333e-06
50.6869775.32131e-06
60.7013245.43241e-06
70.624774.83955e-06
80.5118683.96499.9e-05
90.4332383.35580.000688
100.4097443.17390.001187
110.4423883.42670.000554
120.4550933.52510.000409
130.3318912.57080.006322
140.1869411.4480.076406
150.0848390.65720.256795
160.0361480.280.390221
170.0406590.31490.376949
180.0275560.21340.415851
19-0.04387-0.33980.367591
20-0.141043-1.09250.139487
21-0.209913-1.6260.054598
22-0.228994-1.77380.040587
23-0.195799-1.51670.067303
24-0.167097-1.29430.100256
25-0.237967-1.84330.035114
26-0.330153-2.55740.006547
27-0.394776-3.05790.001664
28-0.41406-3.20730.001075
29-0.39328-3.04630.00172
30-0.367772-2.84870.003002
31-0.377897-2.92720.002413
32-0.410172-3.17720.001175
33-0.424287-3.28650.000849
34-0.411695-3.1890.001135
35-0.357643-2.77030.003722
36-0.299753-2.32190.011826
37-0.304111-2.35560.010889
38-0.318823-2.46960.008195
39-0.322046-2.49460.007691
40-0.302252-2.34120.01128
41-0.259569-2.01060.024434
42-0.227126-1.75930.041812
43-0.202841-1.57120.060698
44-0.193143-1.49610.069937
45-0.177965-1.37850.086583
46-0.151768-1.17560.122201
47-0.104216-0.80730.211355
48-0.061529-0.47660.317689

\begin{tabular}{lllllllll}
\hline
Autocorrelation Function \tabularnewline
Time lag k & ACF(k) & T-STAT & P-value \tabularnewline
1 & 0.88292 & 6.8391 & 0 \tabularnewline
2 & 0.736095 & 5.7018 & 0 \tabularnewline
3 & 0.653457 & 5.0617 & 2e-06 \tabularnewline
4 & 0.640755 & 4.9633 & 3e-06 \tabularnewline
5 & 0.686977 & 5.3213 & 1e-06 \tabularnewline
6 & 0.701324 & 5.4324 & 1e-06 \tabularnewline
7 & 0.62477 & 4.8395 & 5e-06 \tabularnewline
8 & 0.511868 & 3.9649 & 9.9e-05 \tabularnewline
9 & 0.433238 & 3.3558 & 0.000688 \tabularnewline
10 & 0.409744 & 3.1739 & 0.001187 \tabularnewline
11 & 0.442388 & 3.4267 & 0.000554 \tabularnewline
12 & 0.455093 & 3.5251 & 0.000409 \tabularnewline
13 & 0.331891 & 2.5708 & 0.006322 \tabularnewline
14 & 0.186941 & 1.448 & 0.076406 \tabularnewline
15 & 0.084839 & 0.6572 & 0.256795 \tabularnewline
16 & 0.036148 & 0.28 & 0.390221 \tabularnewline
17 & 0.040659 & 0.3149 & 0.376949 \tabularnewline
18 & 0.027556 & 0.2134 & 0.415851 \tabularnewline
19 & -0.04387 & -0.3398 & 0.367591 \tabularnewline
20 & -0.141043 & -1.0925 & 0.139487 \tabularnewline
21 & -0.209913 & -1.626 & 0.054598 \tabularnewline
22 & -0.228994 & -1.7738 & 0.040587 \tabularnewline
23 & -0.195799 & -1.5167 & 0.067303 \tabularnewline
24 & -0.167097 & -1.2943 & 0.100256 \tabularnewline
25 & -0.237967 & -1.8433 & 0.035114 \tabularnewline
26 & -0.330153 & -2.5574 & 0.006547 \tabularnewline
27 & -0.394776 & -3.0579 & 0.001664 \tabularnewline
28 & -0.41406 & -3.2073 & 0.001075 \tabularnewline
29 & -0.39328 & -3.0463 & 0.00172 \tabularnewline
30 & -0.367772 & -2.8487 & 0.003002 \tabularnewline
31 & -0.377897 & -2.9272 & 0.002413 \tabularnewline
32 & -0.410172 & -3.1772 & 0.001175 \tabularnewline
33 & -0.424287 & -3.2865 & 0.000849 \tabularnewline
34 & -0.411695 & -3.189 & 0.001135 \tabularnewline
35 & -0.357643 & -2.7703 & 0.003722 \tabularnewline
36 & -0.299753 & -2.3219 & 0.011826 \tabularnewline
37 & -0.304111 & -2.3556 & 0.010889 \tabularnewline
38 & -0.318823 & -2.4696 & 0.008195 \tabularnewline
39 & -0.322046 & -2.4946 & 0.007691 \tabularnewline
40 & -0.302252 & -2.3412 & 0.01128 \tabularnewline
41 & -0.259569 & -2.0106 & 0.024434 \tabularnewline
42 & -0.227126 & -1.7593 & 0.041812 \tabularnewline
43 & -0.202841 & -1.5712 & 0.060698 \tabularnewline
44 & -0.193143 & -1.4961 & 0.069937 \tabularnewline
45 & -0.177965 & -1.3785 & 0.086583 \tabularnewline
46 & -0.151768 & -1.1756 & 0.122201 \tabularnewline
47 & -0.104216 & -0.8073 & 0.211355 \tabularnewline
48 & -0.061529 & -0.4766 & 0.317689 \tabularnewline
\hline
\end{tabular}
%Source: https://freestatistics.org/blog/index.php?pk=293944&T=1

[TABLE]
[ROW][C]Autocorrelation Function[/C][/ROW]
[ROW][C]Time lag k[/C][C]ACF(k)[/C][C]T-STAT[/C][C]P-value[/C][/ROW]
[ROW][C]1[/C][C]0.88292[/C][C]6.8391[/C][C]0[/C][/ROW]
[ROW][C]2[/C][C]0.736095[/C][C]5.7018[/C][C]0[/C][/ROW]
[ROW][C]3[/C][C]0.653457[/C][C]5.0617[/C][C]2e-06[/C][/ROW]
[ROW][C]4[/C][C]0.640755[/C][C]4.9633[/C][C]3e-06[/C][/ROW]
[ROW][C]5[/C][C]0.686977[/C][C]5.3213[/C][C]1e-06[/C][/ROW]
[ROW][C]6[/C][C]0.701324[/C][C]5.4324[/C][C]1e-06[/C][/ROW]
[ROW][C]7[/C][C]0.62477[/C][C]4.8395[/C][C]5e-06[/C][/ROW]
[ROW][C]8[/C][C]0.511868[/C][C]3.9649[/C][C]9.9e-05[/C][/ROW]
[ROW][C]9[/C][C]0.433238[/C][C]3.3558[/C][C]0.000688[/C][/ROW]
[ROW][C]10[/C][C]0.409744[/C][C]3.1739[/C][C]0.001187[/C][/ROW]
[ROW][C]11[/C][C]0.442388[/C][C]3.4267[/C][C]0.000554[/C][/ROW]
[ROW][C]12[/C][C]0.455093[/C][C]3.5251[/C][C]0.000409[/C][/ROW]
[ROW][C]13[/C][C]0.331891[/C][C]2.5708[/C][C]0.006322[/C][/ROW]
[ROW][C]14[/C][C]0.186941[/C][C]1.448[/C][C]0.076406[/C][/ROW]
[ROW][C]15[/C][C]0.084839[/C][C]0.6572[/C][C]0.256795[/C][/ROW]
[ROW][C]16[/C][C]0.036148[/C][C]0.28[/C][C]0.390221[/C][/ROW]
[ROW][C]17[/C][C]0.040659[/C][C]0.3149[/C][C]0.376949[/C][/ROW]
[ROW][C]18[/C][C]0.027556[/C][C]0.2134[/C][C]0.415851[/C][/ROW]
[ROW][C]19[/C][C]-0.04387[/C][C]-0.3398[/C][C]0.367591[/C][/ROW]
[ROW][C]20[/C][C]-0.141043[/C][C]-1.0925[/C][C]0.139487[/C][/ROW]
[ROW][C]21[/C][C]-0.209913[/C][C]-1.626[/C][C]0.054598[/C][/ROW]
[ROW][C]22[/C][C]-0.228994[/C][C]-1.7738[/C][C]0.040587[/C][/ROW]
[ROW][C]23[/C][C]-0.195799[/C][C]-1.5167[/C][C]0.067303[/C][/ROW]
[ROW][C]24[/C][C]-0.167097[/C][C]-1.2943[/C][C]0.100256[/C][/ROW]
[ROW][C]25[/C][C]-0.237967[/C][C]-1.8433[/C][C]0.035114[/C][/ROW]
[ROW][C]26[/C][C]-0.330153[/C][C]-2.5574[/C][C]0.006547[/C][/ROW]
[ROW][C]27[/C][C]-0.394776[/C][C]-3.0579[/C][C]0.001664[/C][/ROW]
[ROW][C]28[/C][C]-0.41406[/C][C]-3.2073[/C][C]0.001075[/C][/ROW]
[ROW][C]29[/C][C]-0.39328[/C][C]-3.0463[/C][C]0.00172[/C][/ROW]
[ROW][C]30[/C][C]-0.367772[/C][C]-2.8487[/C][C]0.003002[/C][/ROW]
[ROW][C]31[/C][C]-0.377897[/C][C]-2.9272[/C][C]0.002413[/C][/ROW]
[ROW][C]32[/C][C]-0.410172[/C][C]-3.1772[/C][C]0.001175[/C][/ROW]
[ROW][C]33[/C][C]-0.424287[/C][C]-3.2865[/C][C]0.000849[/C][/ROW]
[ROW][C]34[/C][C]-0.411695[/C][C]-3.189[/C][C]0.001135[/C][/ROW]
[ROW][C]35[/C][C]-0.357643[/C][C]-2.7703[/C][C]0.003722[/C][/ROW]
[ROW][C]36[/C][C]-0.299753[/C][C]-2.3219[/C][C]0.011826[/C][/ROW]
[ROW][C]37[/C][C]-0.304111[/C][C]-2.3556[/C][C]0.010889[/C][/ROW]
[ROW][C]38[/C][C]-0.318823[/C][C]-2.4696[/C][C]0.008195[/C][/ROW]
[ROW][C]39[/C][C]-0.322046[/C][C]-2.4946[/C][C]0.007691[/C][/ROW]
[ROW][C]40[/C][C]-0.302252[/C][C]-2.3412[/C][C]0.01128[/C][/ROW]
[ROW][C]41[/C][C]-0.259569[/C][C]-2.0106[/C][C]0.024434[/C][/ROW]
[ROW][C]42[/C][C]-0.227126[/C][C]-1.7593[/C][C]0.041812[/C][/ROW]
[ROW][C]43[/C][C]-0.202841[/C][C]-1.5712[/C][C]0.060698[/C][/ROW]
[ROW][C]44[/C][C]-0.193143[/C][C]-1.4961[/C][C]0.069937[/C][/ROW]
[ROW][C]45[/C][C]-0.177965[/C][C]-1.3785[/C][C]0.086583[/C][/ROW]
[ROW][C]46[/C][C]-0.151768[/C][C]-1.1756[/C][C]0.122201[/C][/ROW]
[ROW][C]47[/C][C]-0.104216[/C][C]-0.8073[/C][C]0.211355[/C][/ROW]
[ROW][C]48[/C][C]-0.061529[/C][C]-0.4766[/C][C]0.317689[/C][/ROW]
[/TABLE]
Source: https://freestatistics.org/blog/index.php?pk=293944&T=1

Globally Unique Identifier (entire table): ba.freestatistics.org/blog/index.php?pk=293944&T=1

As an alternative you can also use a QR Code:  

The GUIDs for individual cells are displayed in the table below:

Autocorrelation Function
Time lag kACF(k)T-STATP-value
10.882926.83910
20.7360955.70180
30.6534575.06172e-06
40.6407554.96333e-06
50.6869775.32131e-06
60.7013245.43241e-06
70.624774.83955e-06
80.5118683.96499.9e-05
90.4332383.35580.000688
100.4097443.17390.001187
110.4423883.42670.000554
120.4550933.52510.000409
130.3318912.57080.006322
140.1869411.4480.076406
150.0848390.65720.256795
160.0361480.280.390221
170.0406590.31490.376949
180.0275560.21340.415851
19-0.04387-0.33980.367591
20-0.141043-1.09250.139487
21-0.209913-1.6260.054598
22-0.228994-1.77380.040587
23-0.195799-1.51670.067303
24-0.167097-1.29430.100256
25-0.237967-1.84330.035114
26-0.330153-2.55740.006547
27-0.394776-3.05790.001664
28-0.41406-3.20730.001075
29-0.39328-3.04630.00172
30-0.367772-2.84870.003002
31-0.377897-2.92720.002413
32-0.410172-3.17720.001175
33-0.424287-3.28650.000849
34-0.411695-3.1890.001135
35-0.357643-2.77030.003722
36-0.299753-2.32190.011826
37-0.304111-2.35560.010889
38-0.318823-2.46960.008195
39-0.322046-2.49460.007691
40-0.302252-2.34120.01128
41-0.259569-2.01060.024434
42-0.227126-1.75930.041812
43-0.202841-1.57120.060698
44-0.193143-1.49610.069937
45-0.177965-1.37850.086583
46-0.151768-1.17560.122201
47-0.104216-0.80730.211355
48-0.061529-0.47660.317689


Partial Autocorrelation Function
Time lag kPACF(k)T-STATP-value
10.882926.83910
2-0.197114-1.52680.066028
30.2334891.80860.037762
40.202691.570.060834
50.2892822.24080.014377
6-0.046574-0.36080.359774
7-0.221265-1.71390.045854
8-0.098143-0.76020.225051
90.0020540.01590.49368
10-0.009564-0.07410.470596
110.1173040.90860.183589
12-0.03344-0.2590.398252
13-0.485873-3.76360.000192
140.0109160.08460.46645
15-0.091384-0.70790.240887
16-0.100243-0.77650.220259
17-0.076666-0.59390.277421
18-0.029288-0.22690.410651
190.0368450.28540.38816
20-0.018636-0.14440.442852
210.0529210.40990.341661
220.0521750.40410.343772
230.0798360.61840.269324
240.0871640.67520.251082
25-0.111653-0.86490.195281
260.0069570.05390.4786
27-0.057974-0.44910.327501
28-0.035393-0.27420.392455
29-0.149251-1.15610.126113
300.0532090.41220.340848
310.0012570.00970.496133
320.0125310.09710.4615
330.0337730.26160.397262
34-0.027155-0.21030.417056
350.0519460.40240.344421
360.0064310.04980.480217
370.051540.39920.345573
380.069530.53860.296087
39-5.8e-05-5e-040.49982
400.0146760.11370.454936
41-0.043662-0.33820.368194
42-0.148861-1.15310.126728
430.0706790.54750.293042
44-0.082752-0.6410.261984
45-0.049904-0.38660.350227
46-0.043427-0.33640.368879
47-0.027868-0.21590.414914
48-0.065068-0.5040.308049

\begin{tabular}{lllllllll}
\hline
Partial Autocorrelation Function \tabularnewline
Time lag k & PACF(k) & T-STAT & P-value \tabularnewline
1 & 0.88292 & 6.8391 & 0 \tabularnewline
2 & -0.197114 & -1.5268 & 0.066028 \tabularnewline
3 & 0.233489 & 1.8086 & 0.037762 \tabularnewline
4 & 0.20269 & 1.57 & 0.060834 \tabularnewline
5 & 0.289282 & 2.2408 & 0.014377 \tabularnewline
6 & -0.046574 & -0.3608 & 0.359774 \tabularnewline
7 & -0.221265 & -1.7139 & 0.045854 \tabularnewline
8 & -0.098143 & -0.7602 & 0.225051 \tabularnewline
9 & 0.002054 & 0.0159 & 0.49368 \tabularnewline
10 & -0.009564 & -0.0741 & 0.470596 \tabularnewline
11 & 0.117304 & 0.9086 & 0.183589 \tabularnewline
12 & -0.03344 & -0.259 & 0.398252 \tabularnewline
13 & -0.485873 & -3.7636 & 0.000192 \tabularnewline
14 & 0.010916 & 0.0846 & 0.46645 \tabularnewline
15 & -0.091384 & -0.7079 & 0.240887 \tabularnewline
16 & -0.100243 & -0.7765 & 0.220259 \tabularnewline
17 & -0.076666 & -0.5939 & 0.277421 \tabularnewline
18 & -0.029288 & -0.2269 & 0.410651 \tabularnewline
19 & 0.036845 & 0.2854 & 0.38816 \tabularnewline
20 & -0.018636 & -0.1444 & 0.442852 \tabularnewline
21 & 0.052921 & 0.4099 & 0.341661 \tabularnewline
22 & 0.052175 & 0.4041 & 0.343772 \tabularnewline
23 & 0.079836 & 0.6184 & 0.269324 \tabularnewline
24 & 0.087164 & 0.6752 & 0.251082 \tabularnewline
25 & -0.111653 & -0.8649 & 0.195281 \tabularnewline
26 & 0.006957 & 0.0539 & 0.4786 \tabularnewline
27 & -0.057974 & -0.4491 & 0.327501 \tabularnewline
28 & -0.035393 & -0.2742 & 0.392455 \tabularnewline
29 & -0.149251 & -1.1561 & 0.126113 \tabularnewline
30 & 0.053209 & 0.4122 & 0.340848 \tabularnewline
31 & 0.001257 & 0.0097 & 0.496133 \tabularnewline
32 & 0.012531 & 0.0971 & 0.4615 \tabularnewline
33 & 0.033773 & 0.2616 & 0.397262 \tabularnewline
34 & -0.027155 & -0.2103 & 0.417056 \tabularnewline
35 & 0.051946 & 0.4024 & 0.344421 \tabularnewline
36 & 0.006431 & 0.0498 & 0.480217 \tabularnewline
37 & 0.05154 & 0.3992 & 0.345573 \tabularnewline
38 & 0.06953 & 0.5386 & 0.296087 \tabularnewline
39 & -5.8e-05 & -5e-04 & 0.49982 \tabularnewline
40 & 0.014676 & 0.1137 & 0.454936 \tabularnewline
41 & -0.043662 & -0.3382 & 0.368194 \tabularnewline
42 & -0.148861 & -1.1531 & 0.126728 \tabularnewline
43 & 0.070679 & 0.5475 & 0.293042 \tabularnewline
44 & -0.082752 & -0.641 & 0.261984 \tabularnewline
45 & -0.049904 & -0.3866 & 0.350227 \tabularnewline
46 & -0.043427 & -0.3364 & 0.368879 \tabularnewline
47 & -0.027868 & -0.2159 & 0.414914 \tabularnewline
48 & -0.065068 & -0.504 & 0.308049 \tabularnewline
\hline
\end{tabular}
%Source: https://freestatistics.org/blog/index.php?pk=293944&T=2

[TABLE]
[ROW][C]Partial Autocorrelation Function[/C][/ROW]
[ROW][C]Time lag k[/C][C]PACF(k)[/C][C]T-STAT[/C][C]P-value[/C][/ROW]
[ROW][C]1[/C][C]0.88292[/C][C]6.8391[/C][C]0[/C][/ROW]
[ROW][C]2[/C][C]-0.197114[/C][C]-1.5268[/C][C]0.066028[/C][/ROW]
[ROW][C]3[/C][C]0.233489[/C][C]1.8086[/C][C]0.037762[/C][/ROW]
[ROW][C]4[/C][C]0.20269[/C][C]1.57[/C][C]0.060834[/C][/ROW]
[ROW][C]5[/C][C]0.289282[/C][C]2.2408[/C][C]0.014377[/C][/ROW]
[ROW][C]6[/C][C]-0.046574[/C][C]-0.3608[/C][C]0.359774[/C][/ROW]
[ROW][C]7[/C][C]-0.221265[/C][C]-1.7139[/C][C]0.045854[/C][/ROW]
[ROW][C]8[/C][C]-0.098143[/C][C]-0.7602[/C][C]0.225051[/C][/ROW]
[ROW][C]9[/C][C]0.002054[/C][C]0.0159[/C][C]0.49368[/C][/ROW]
[ROW][C]10[/C][C]-0.009564[/C][C]-0.0741[/C][C]0.470596[/C][/ROW]
[ROW][C]11[/C][C]0.117304[/C][C]0.9086[/C][C]0.183589[/C][/ROW]
[ROW][C]12[/C][C]-0.03344[/C][C]-0.259[/C][C]0.398252[/C][/ROW]
[ROW][C]13[/C][C]-0.485873[/C][C]-3.7636[/C][C]0.000192[/C][/ROW]
[ROW][C]14[/C][C]0.010916[/C][C]0.0846[/C][C]0.46645[/C][/ROW]
[ROW][C]15[/C][C]-0.091384[/C][C]-0.7079[/C][C]0.240887[/C][/ROW]
[ROW][C]16[/C][C]-0.100243[/C][C]-0.7765[/C][C]0.220259[/C][/ROW]
[ROW][C]17[/C][C]-0.076666[/C][C]-0.5939[/C][C]0.277421[/C][/ROW]
[ROW][C]18[/C][C]-0.029288[/C][C]-0.2269[/C][C]0.410651[/C][/ROW]
[ROW][C]19[/C][C]0.036845[/C][C]0.2854[/C][C]0.38816[/C][/ROW]
[ROW][C]20[/C][C]-0.018636[/C][C]-0.1444[/C][C]0.442852[/C][/ROW]
[ROW][C]21[/C][C]0.052921[/C][C]0.4099[/C][C]0.341661[/C][/ROW]
[ROW][C]22[/C][C]0.052175[/C][C]0.4041[/C][C]0.343772[/C][/ROW]
[ROW][C]23[/C][C]0.079836[/C][C]0.6184[/C][C]0.269324[/C][/ROW]
[ROW][C]24[/C][C]0.087164[/C][C]0.6752[/C][C]0.251082[/C][/ROW]
[ROW][C]25[/C][C]-0.111653[/C][C]-0.8649[/C][C]0.195281[/C][/ROW]
[ROW][C]26[/C][C]0.006957[/C][C]0.0539[/C][C]0.4786[/C][/ROW]
[ROW][C]27[/C][C]-0.057974[/C][C]-0.4491[/C][C]0.327501[/C][/ROW]
[ROW][C]28[/C][C]-0.035393[/C][C]-0.2742[/C][C]0.392455[/C][/ROW]
[ROW][C]29[/C][C]-0.149251[/C][C]-1.1561[/C][C]0.126113[/C][/ROW]
[ROW][C]30[/C][C]0.053209[/C][C]0.4122[/C][C]0.340848[/C][/ROW]
[ROW][C]31[/C][C]0.001257[/C][C]0.0097[/C][C]0.496133[/C][/ROW]
[ROW][C]32[/C][C]0.012531[/C][C]0.0971[/C][C]0.4615[/C][/ROW]
[ROW][C]33[/C][C]0.033773[/C][C]0.2616[/C][C]0.397262[/C][/ROW]
[ROW][C]34[/C][C]-0.027155[/C][C]-0.2103[/C][C]0.417056[/C][/ROW]
[ROW][C]35[/C][C]0.051946[/C][C]0.4024[/C][C]0.344421[/C][/ROW]
[ROW][C]36[/C][C]0.006431[/C][C]0.0498[/C][C]0.480217[/C][/ROW]
[ROW][C]37[/C][C]0.05154[/C][C]0.3992[/C][C]0.345573[/C][/ROW]
[ROW][C]38[/C][C]0.06953[/C][C]0.5386[/C][C]0.296087[/C][/ROW]
[ROW][C]39[/C][C]-5.8e-05[/C][C]-5e-04[/C][C]0.49982[/C][/ROW]
[ROW][C]40[/C][C]0.014676[/C][C]0.1137[/C][C]0.454936[/C][/ROW]
[ROW][C]41[/C][C]-0.043662[/C][C]-0.3382[/C][C]0.368194[/C][/ROW]
[ROW][C]42[/C][C]-0.148861[/C][C]-1.1531[/C][C]0.126728[/C][/ROW]
[ROW][C]43[/C][C]0.070679[/C][C]0.5475[/C][C]0.293042[/C][/ROW]
[ROW][C]44[/C][C]-0.082752[/C][C]-0.641[/C][C]0.261984[/C][/ROW]
[ROW][C]45[/C][C]-0.049904[/C][C]-0.3866[/C][C]0.350227[/C][/ROW]
[ROW][C]46[/C][C]-0.043427[/C][C]-0.3364[/C][C]0.368879[/C][/ROW]
[ROW][C]47[/C][C]-0.027868[/C][C]-0.2159[/C][C]0.414914[/C][/ROW]
[ROW][C]48[/C][C]-0.065068[/C][C]-0.504[/C][C]0.308049[/C][/ROW]
[/TABLE]
Source: https://freestatistics.org/blog/index.php?pk=293944&T=2

Globally Unique Identifier (entire table): ba.freestatistics.org/blog/index.php?pk=293944&T=2

As an alternative you can also use a QR Code:  

The GUIDs for individual cells are displayed in the table below:

Partial Autocorrelation Function
Time lag kPACF(k)T-STATP-value
10.882926.83910
2-0.197114-1.52680.066028
30.2334891.80860.037762
40.202691.570.060834
50.2892822.24080.014377
6-0.046574-0.36080.359774
7-0.221265-1.71390.045854
8-0.098143-0.76020.225051
90.0020540.01590.49368
10-0.009564-0.07410.470596
110.1173040.90860.183589
12-0.03344-0.2590.398252
13-0.485873-3.76360.000192
140.0109160.08460.46645
15-0.091384-0.70790.240887
16-0.100243-0.77650.220259
17-0.076666-0.59390.277421
18-0.029288-0.22690.410651
190.0368450.28540.38816
20-0.018636-0.14440.442852
210.0529210.40990.341661
220.0521750.40410.343772
230.0798360.61840.269324
240.0871640.67520.251082
25-0.111653-0.86490.195281
260.0069570.05390.4786
27-0.057974-0.44910.327501
28-0.035393-0.27420.392455
29-0.149251-1.15610.126113
300.0532090.41220.340848
310.0012570.00970.496133
320.0125310.09710.4615
330.0337730.26160.397262
34-0.027155-0.21030.417056
350.0519460.40240.344421
360.0064310.04980.480217
370.051540.39920.345573
380.069530.53860.296087
39-5.8e-05-5e-040.49982
400.0146760.11370.454936
41-0.043662-0.33820.368194
42-0.148861-1.15310.126728
430.0706790.54750.293042
44-0.082752-0.6410.261984
45-0.049904-0.38660.350227
46-0.043427-0.33640.368879
47-0.027868-0.21590.414914
48-0.065068-0.5040.308049


Parameters (Session):
par1 = 48 ; par2 = 1 ; par3 = 0 ; par4 = 0 ; par5 = 12 ; par6 = White Noise ; par7 = 0.95 ;
Parameters (R input):
par1 = 48 ; par2 = 1 ; par3 = 0 ; par4 = 0 ; par5 = 12 ; par6 = White Noise ; par7 = 0.95 ; par8 = ;
R code (references can be found in the software module):
if (par1 == 'Default') {
par1 = 10*log10(length(x))
} else {
par1 <- as.numeric(par1)
}
par2 <- as.numeric(par2)
par3 <- as.numeric(par3)
par4 <- as.numeric(par4)
par5 <- as.numeric(par5)
if (par6 == 'White Noise') par6 <- 'white' else par6 <- 'ma'
par7 <- as.numeric(par7)
if (par8 != '') par8 <- as.numeric(par8)
x <- na.omit(x)
ox <- x
if (par8 == '') {
if (par2 == 0) {
x <- log(x)
} else {
x <- (x ^ par2 - 1) / par2
}
} else {
x <- log(x,base=par8)
}
if (par3 > 0) x <- diff(x,lag=1,difference=par3)
if (par4 > 0) x <- diff(x,lag=par5,difference=par4)
bitmap(file='picts.png')
op <- par(mfrow=c(2,1))
plot(ox,type='l',main='Original Time Series',xlab='time',ylab='value')
if (par8=='') {
mytitle <- paste('Working Time Series (lambda=',par2,', d=',par3,', D=',par4,')',sep='')
mysub <- paste('(lambda=',par2,', d=',par3,', D=',par4,', CI=', par7, ', CI type=',par6,')',sep='')
} else {
mytitle <- paste('Working Time Series (base=',par8,', d=',par3,', D=',par4,')',sep='')
mysub <- paste('(base=',par8,', d=',par3,', D=',par4,', CI=', par7, ', CI type=',par6,')',sep='')
}
plot(x,type='l', main=mytitle,xlab='time',ylab='value')
par(op)
dev.off()
bitmap(file='pic1.png')
racf <- acf(x, par1, main='Autocorrelation', xlab='time lag', ylab='ACF', ci.type=par6, ci=par7, sub=mysub)
dev.off()
bitmap(file='pic2.png')
rpacf <- pacf(x,par1,main='Partial Autocorrelation',xlab='lags',ylab='PACF',sub=mysub)
dev.off()
(myacf <- c(racf$acf))
(mypacf <- c(rpacf$acf))
lengthx <- length(x)
sqrtn <- sqrt(lengthx)
load(file='createtable')
a<-table.start()
a<-table.row.start(a)
a<-table.element(a,'Autocorrelation Function',4,TRUE)
a<-table.row.end(a)
a<-table.row.start(a)
a<-table.element(a,'Time lag k',header=TRUE)
a<-table.element(a,hyperlink('basics.htm','ACF(k)','click here for more information about the Autocorrelation Function'),header=TRUE)
a<-table.element(a,'T-STAT',header=TRUE)
a<-table.element(a,'P-value',header=TRUE)
a<-table.row.end(a)
for (i in 2:(par1+1)) {
a<-table.row.start(a)
a<-table.element(a,i-1,header=TRUE)
a<-table.element(a,round(myacf[i],6))
mytstat <- myacf[i]*sqrtn
a<-table.element(a,round(mytstat,4))
a<-table.element(a,round(1-pt(abs(mytstat),lengthx),6))
a<-table.row.end(a)
}
a<-table.end(a)
table.save(a,file='mytable.tab')
a<-table.start()
a<-table.row.start(a)
a<-table.element(a,'Partial Autocorrelation Function',4,TRUE)
a<-table.row.end(a)
a<-table.row.start(a)
a<-table.element(a,'Time lag k',header=TRUE)
a<-table.element(a,hyperlink('basics.htm','PACF(k)','click here for more information about the Partial Autocorrelation Function'),header=TRUE)
a<-table.element(a,'T-STAT',header=TRUE)
a<-table.element(a,'P-value',header=TRUE)
a<-table.row.end(a)
for (i in 1:par1) {
a<-table.row.start(a)
a<-table.element(a,i,header=TRUE)
a<-table.element(a,round(mypacf[i],6))
mytstat <- mypacf[i]*sqrtn
a<-table.element(a,round(mytstat,4))
a<-table.element(a,round(1-pt(abs(mytstat),lengthx),6))
a<-table.row.end(a)
}
a<-table.end(a)
table.save(a,file='mytable1.tab')