Free Statistics

of Irreproducible Research!

Author's title

Author*Unverified author*
R Software Modulerwasp_autocorrelation.wasp
Title produced by software(Partial) Autocorrelation Function
Date of computationSat, 12 Mar 2016 21:46:58 +0000
Cite this page as followsStatistical Computations at FreeStatistics.org, Office for Research Development and Education, URL https://freestatistics.org/blog/index.php?v=date/2016/Mar/12/t1457819269b8ibiqh8hdmt02q.htm/, Retrieved Sun, 05 May 2024 11:39:31 +0000
Statistical Computations at FreeStatistics.org, Office for Research Development and Education, URL https://freestatistics.org/blog/index.php?pk=293969, Retrieved Sun, 05 May 2024 11:39:31 +0000
QR Codes:

Original text written by user:
IsPrivate?No (this computation is public)
User-defined keywords
Estimated Impact73
Family? (F = Feedback message, R = changed R code, M = changed R Module, P = changed Parameters, D = changed Data)
-     [(Partial) Autocorrelation Function] [] [2016-03-12 21:16:20] [600dd77654e74003cbd3c8172f556ebd]
- R PD    [(Partial) Autocorrelation Function] [] [2016-03-12 21:46:58] [bfab382a4ab6d7836f6b75894769f754] [Current]
Feedback Forum

Post a new message
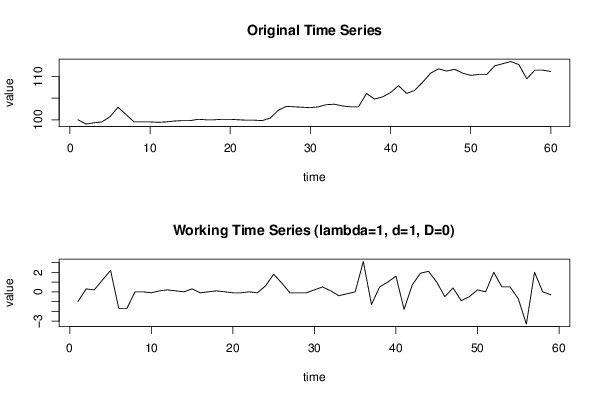
Dataseries X:
100
99
99.3
99.5
100.7
102.9
101.2
99.5
99.5
99.5
99.4
99.5
99.7
99.8
99.8
100.1
100
100
100.1
100.1
100
99.9
99.9
99.8
100.4
102.2
103.1
103
102.9
102.8
103
103.5
103.6
103.2
103
103
106.1
104.8
105.3
106.3
107.9
106.1
106.8
108.7
110.8
111.8
111.3
111.7
110.8
110.3
110.5
110.5
112.5
113
113.5
112.8
109.5
111.5
111.5
111.2


Summary of computational transaction
Raw Inputview raw input (R code)
Raw Outputview raw output of R engine
Computing time2 seconds
R Server'Gertrude Mary Cox' @ cox.wessa.net

\begin{tabular}{lllllllll}
\hline
Summary of computational transaction \tabularnewline
Raw Input & view raw input (R code)  \tabularnewline
Raw Output & view raw output of R engine  \tabularnewline
Computing time & 2 seconds \tabularnewline
R Server & 'Gertrude Mary Cox' @ cox.wessa.net \tabularnewline
\hline
\end{tabular}
%Source: https://freestatistics.org/blog/index.php?pk=293969&T=0

[TABLE]
[ROW][C]Summary of computational transaction[/C][/ROW]
[ROW][C]Raw Input[/C][C]view raw input (R code) [/C][/ROW]
[ROW][C]Raw Output[/C][C]view raw output of R engine [/C][/ROW]
[ROW][C]Computing time[/C][C]2 seconds[/C][/ROW]
[ROW][C]R Server[/C][C]'Gertrude Mary Cox' @ cox.wessa.net[/C][/ROW]
[/TABLE]
Source: https://freestatistics.org/blog/index.php?pk=293969&T=0

Globally Unique Identifier (entire table): ba.freestatistics.org/blog/index.php?pk=293969&T=0

As an alternative you can also use a QR Code:  

The GUIDs for individual cells are displayed in the table below:

Summary of computational transaction
Raw Inputview raw input (R code)
Raw Outputview raw output of R engine
Computing time2 seconds
R Server'Gertrude Mary Cox' @ cox.wessa.net


Autocorrelation Function
Time lag kACF(k)T-STATP-value
1-0.019357-0.14870.441155
2-0.170974-1.31330.097087
3-0.126101-0.96860.168349
4-0.051882-0.39850.345844
50.0054550.04190.483359
6-0.051045-0.39210.348204
70.1061710.81550.209028
80.1359731.04440.150273
90.0185730.14270.443521
100.0357030.27420.392428
11-0.071109-0.54620.293494
12-0.115941-0.89060.188391
13-0.024278-0.18650.426353
140.1139140.8750.192563
150.0391780.30090.382262
16-0.13711-1.05320.14828
17-0.024918-0.19140.424436
180.036190.2780.391
190.0273770.21030.417085
20-0.143647-1.10340.137172
210.1667051.28050.102693
220.0161250.12390.450925
23-0.066278-0.50910.306295
24-0.106148-0.81530.209079
25-0.053128-0.40810.342344
260.0414020.3180.375797
270.0964570.74090.230846
280.0298550.22930.409707
29-0.099048-0.76080.224902
30-0.134441-1.03270.152989
310.0417490.32070.374794
32-0.000751-0.00580.497708
33-0.062852-0.48280.315521
340.0286280.21990.413357
350.0396970.30490.38075
36-0.076904-0.59070.278485
37-0.116441-0.89440.187371
38-0.02432-0.18680.426227
390.0695690.53440.297546
400.1200420.92210.180125
410.0004810.00370.498533
420.0281810.21650.414688
43-0.049242-0.37820.353307
44-0.058187-0.44690.328277
45-0.035446-0.27230.393183
46-0.057275-0.43990.330795
470.0581860.44690.32828
480.0729990.56070.288557

\begin{tabular}{lllllllll}
\hline
Autocorrelation Function \tabularnewline
Time lag k & ACF(k) & T-STAT & P-value \tabularnewline
1 & -0.019357 & -0.1487 & 0.441155 \tabularnewline
2 & -0.170974 & -1.3133 & 0.097087 \tabularnewline
3 & -0.126101 & -0.9686 & 0.168349 \tabularnewline
4 & -0.051882 & -0.3985 & 0.345844 \tabularnewline
5 & 0.005455 & 0.0419 & 0.483359 \tabularnewline
6 & -0.051045 & -0.3921 & 0.348204 \tabularnewline
7 & 0.106171 & 0.8155 & 0.209028 \tabularnewline
8 & 0.135973 & 1.0444 & 0.150273 \tabularnewline
9 & 0.018573 & 0.1427 & 0.443521 \tabularnewline
10 & 0.035703 & 0.2742 & 0.392428 \tabularnewline
11 & -0.071109 & -0.5462 & 0.293494 \tabularnewline
12 & -0.115941 & -0.8906 & 0.188391 \tabularnewline
13 & -0.024278 & -0.1865 & 0.426353 \tabularnewline
14 & 0.113914 & 0.875 & 0.192563 \tabularnewline
15 & 0.039178 & 0.3009 & 0.382262 \tabularnewline
16 & -0.13711 & -1.0532 & 0.14828 \tabularnewline
17 & -0.024918 & -0.1914 & 0.424436 \tabularnewline
18 & 0.03619 & 0.278 & 0.391 \tabularnewline
19 & 0.027377 & 0.2103 & 0.417085 \tabularnewline
20 & -0.143647 & -1.1034 & 0.137172 \tabularnewline
21 & 0.166705 & 1.2805 & 0.102693 \tabularnewline
22 & 0.016125 & 0.1239 & 0.450925 \tabularnewline
23 & -0.066278 & -0.5091 & 0.306295 \tabularnewline
24 & -0.106148 & -0.8153 & 0.209079 \tabularnewline
25 & -0.053128 & -0.4081 & 0.342344 \tabularnewline
26 & 0.041402 & 0.318 & 0.375797 \tabularnewline
27 & 0.096457 & 0.7409 & 0.230846 \tabularnewline
28 & 0.029855 & 0.2293 & 0.409707 \tabularnewline
29 & -0.099048 & -0.7608 & 0.224902 \tabularnewline
30 & -0.134441 & -1.0327 & 0.152989 \tabularnewline
31 & 0.041749 & 0.3207 & 0.374794 \tabularnewline
32 & -0.000751 & -0.0058 & 0.497708 \tabularnewline
33 & -0.062852 & -0.4828 & 0.315521 \tabularnewline
34 & 0.028628 & 0.2199 & 0.413357 \tabularnewline
35 & 0.039697 & 0.3049 & 0.38075 \tabularnewline
36 & -0.076904 & -0.5907 & 0.278485 \tabularnewline
37 & -0.116441 & -0.8944 & 0.187371 \tabularnewline
38 & -0.02432 & -0.1868 & 0.426227 \tabularnewline
39 & 0.069569 & 0.5344 & 0.297546 \tabularnewline
40 & 0.120042 & 0.9221 & 0.180125 \tabularnewline
41 & 0.000481 & 0.0037 & 0.498533 \tabularnewline
42 & 0.028181 & 0.2165 & 0.414688 \tabularnewline
43 & -0.049242 & -0.3782 & 0.353307 \tabularnewline
44 & -0.058187 & -0.4469 & 0.328277 \tabularnewline
45 & -0.035446 & -0.2723 & 0.393183 \tabularnewline
46 & -0.057275 & -0.4399 & 0.330795 \tabularnewline
47 & 0.058186 & 0.4469 & 0.32828 \tabularnewline
48 & 0.072999 & 0.5607 & 0.288557 \tabularnewline
\hline
\end{tabular}
%Source: https://freestatistics.org/blog/index.php?pk=293969&T=1

[TABLE]
[ROW][C]Autocorrelation Function[/C][/ROW]
[ROW][C]Time lag k[/C][C]ACF(k)[/C][C]T-STAT[/C][C]P-value[/C][/ROW]
[ROW][C]1[/C][C]-0.019357[/C][C]-0.1487[/C][C]0.441155[/C][/ROW]
[ROW][C]2[/C][C]-0.170974[/C][C]-1.3133[/C][C]0.097087[/C][/ROW]
[ROW][C]3[/C][C]-0.126101[/C][C]-0.9686[/C][C]0.168349[/C][/ROW]
[ROW][C]4[/C][C]-0.051882[/C][C]-0.3985[/C][C]0.345844[/C][/ROW]
[ROW][C]5[/C][C]0.005455[/C][C]0.0419[/C][C]0.483359[/C][/ROW]
[ROW][C]6[/C][C]-0.051045[/C][C]-0.3921[/C][C]0.348204[/C][/ROW]
[ROW][C]7[/C][C]0.106171[/C][C]0.8155[/C][C]0.209028[/C][/ROW]
[ROW][C]8[/C][C]0.135973[/C][C]1.0444[/C][C]0.150273[/C][/ROW]
[ROW][C]9[/C][C]0.018573[/C][C]0.1427[/C][C]0.443521[/C][/ROW]
[ROW][C]10[/C][C]0.035703[/C][C]0.2742[/C][C]0.392428[/C][/ROW]
[ROW][C]11[/C][C]-0.071109[/C][C]-0.5462[/C][C]0.293494[/C][/ROW]
[ROW][C]12[/C][C]-0.115941[/C][C]-0.8906[/C][C]0.188391[/C][/ROW]
[ROW][C]13[/C][C]-0.024278[/C][C]-0.1865[/C][C]0.426353[/C][/ROW]
[ROW][C]14[/C][C]0.113914[/C][C]0.875[/C][C]0.192563[/C][/ROW]
[ROW][C]15[/C][C]0.039178[/C][C]0.3009[/C][C]0.382262[/C][/ROW]
[ROW][C]16[/C][C]-0.13711[/C][C]-1.0532[/C][C]0.14828[/C][/ROW]
[ROW][C]17[/C][C]-0.024918[/C][C]-0.1914[/C][C]0.424436[/C][/ROW]
[ROW][C]18[/C][C]0.03619[/C][C]0.278[/C][C]0.391[/C][/ROW]
[ROW][C]19[/C][C]0.027377[/C][C]0.2103[/C][C]0.417085[/C][/ROW]
[ROW][C]20[/C][C]-0.143647[/C][C]-1.1034[/C][C]0.137172[/C][/ROW]
[ROW][C]21[/C][C]0.166705[/C][C]1.2805[/C][C]0.102693[/C][/ROW]
[ROW][C]22[/C][C]0.016125[/C][C]0.1239[/C][C]0.450925[/C][/ROW]
[ROW][C]23[/C][C]-0.066278[/C][C]-0.5091[/C][C]0.306295[/C][/ROW]
[ROW][C]24[/C][C]-0.106148[/C][C]-0.8153[/C][C]0.209079[/C][/ROW]
[ROW][C]25[/C][C]-0.053128[/C][C]-0.4081[/C][C]0.342344[/C][/ROW]
[ROW][C]26[/C][C]0.041402[/C][C]0.318[/C][C]0.375797[/C][/ROW]
[ROW][C]27[/C][C]0.096457[/C][C]0.7409[/C][C]0.230846[/C][/ROW]
[ROW][C]28[/C][C]0.029855[/C][C]0.2293[/C][C]0.409707[/C][/ROW]
[ROW][C]29[/C][C]-0.099048[/C][C]-0.7608[/C][C]0.224902[/C][/ROW]
[ROW][C]30[/C][C]-0.134441[/C][C]-1.0327[/C][C]0.152989[/C][/ROW]
[ROW][C]31[/C][C]0.041749[/C][C]0.3207[/C][C]0.374794[/C][/ROW]
[ROW][C]32[/C][C]-0.000751[/C][C]-0.0058[/C][C]0.497708[/C][/ROW]
[ROW][C]33[/C][C]-0.062852[/C][C]-0.4828[/C][C]0.315521[/C][/ROW]
[ROW][C]34[/C][C]0.028628[/C][C]0.2199[/C][C]0.413357[/C][/ROW]
[ROW][C]35[/C][C]0.039697[/C][C]0.3049[/C][C]0.38075[/C][/ROW]
[ROW][C]36[/C][C]-0.076904[/C][C]-0.5907[/C][C]0.278485[/C][/ROW]
[ROW][C]37[/C][C]-0.116441[/C][C]-0.8944[/C][C]0.187371[/C][/ROW]
[ROW][C]38[/C][C]-0.02432[/C][C]-0.1868[/C][C]0.426227[/C][/ROW]
[ROW][C]39[/C][C]0.069569[/C][C]0.5344[/C][C]0.297546[/C][/ROW]
[ROW][C]40[/C][C]0.120042[/C][C]0.9221[/C][C]0.180125[/C][/ROW]
[ROW][C]41[/C][C]0.000481[/C][C]0.0037[/C][C]0.498533[/C][/ROW]
[ROW][C]42[/C][C]0.028181[/C][C]0.2165[/C][C]0.414688[/C][/ROW]
[ROW][C]43[/C][C]-0.049242[/C][C]-0.3782[/C][C]0.353307[/C][/ROW]
[ROW][C]44[/C][C]-0.058187[/C][C]-0.4469[/C][C]0.328277[/C][/ROW]
[ROW][C]45[/C][C]-0.035446[/C][C]-0.2723[/C][C]0.393183[/C][/ROW]
[ROW][C]46[/C][C]-0.057275[/C][C]-0.4399[/C][C]0.330795[/C][/ROW]
[ROW][C]47[/C][C]0.058186[/C][C]0.4469[/C][C]0.32828[/C][/ROW]
[ROW][C]48[/C][C]0.072999[/C][C]0.5607[/C][C]0.288557[/C][/ROW]
[/TABLE]
Source: https://freestatistics.org/blog/index.php?pk=293969&T=1

Globally Unique Identifier (entire table): ba.freestatistics.org/blog/index.php?pk=293969&T=1

As an alternative you can also use a QR Code:  

The GUIDs for individual cells are displayed in the table below:

Autocorrelation Function
Time lag kACF(k)T-STATP-value
1-0.019357-0.14870.441155
2-0.170974-1.31330.097087
3-0.126101-0.96860.168349
4-0.051882-0.39850.345844
50.0054550.04190.483359
6-0.051045-0.39210.348204
70.1061710.81550.209028
80.1359731.04440.150273
90.0185730.14270.443521
100.0357030.27420.392428
11-0.071109-0.54620.293494
12-0.115941-0.89060.188391
13-0.024278-0.18650.426353
140.1139140.8750.192563
150.0391780.30090.382262
16-0.13711-1.05320.14828
17-0.024918-0.19140.424436
180.036190.2780.391
190.0273770.21030.417085
20-0.143647-1.10340.137172
210.1667051.28050.102693
220.0161250.12390.450925
23-0.066278-0.50910.306295
24-0.106148-0.81530.209079
25-0.053128-0.40810.342344
260.0414020.3180.375797
270.0964570.74090.230846
280.0298550.22930.409707
29-0.099048-0.76080.224902
30-0.134441-1.03270.152989
310.0417490.32070.374794
32-0.000751-0.00580.497708
33-0.062852-0.48280.315521
340.0286280.21990.413357
350.0396970.30490.38075
36-0.076904-0.59070.278485
37-0.116441-0.89440.187371
38-0.02432-0.18680.426227
390.0695690.53440.297546
400.1200420.92210.180125
410.0004810.00370.498533
420.0281810.21650.414688
43-0.049242-0.37820.353307
44-0.058187-0.44690.328277
45-0.035446-0.27230.393183
46-0.057275-0.43990.330795
470.0581860.44690.32828
480.0729990.56070.288557


Partial Autocorrelation Function
Time lag kPACF(k)T-STATP-value
1-0.019357-0.14870.441155
2-0.171413-1.31660.096524
3-0.137382-1.05530.147806
4-0.094765-0.72790.234777
5-0.050651-0.38910.349316
6-0.103907-0.79810.213999
70.0734430.56410.287402
80.1152410.88520.189826
90.0509340.39120.348518
100.1145450.87980.191259
110.0019910.01530.493925
12-0.074338-0.5710.285084
13-0.017886-0.13740.445598
140.0832830.63970.262419
15-0.01329-0.10210.459519
16-0.151916-1.16690.123974
17-0.052132-0.40040.345142
18-0.031629-0.24290.404445
190.0017330.01330.494711
20-0.143024-1.09860.138205
210.180911.38960.084937
22-0.032026-0.2460.403269
23-0.027392-0.21040.41704
24-0.074305-0.57080.285168
25-0.042224-0.32430.373418
26-0.001306-0.010.496014
270.1029860.7910.216043
28-0.009405-0.07220.471329
29-0.150824-1.15850.125664
30-0.108174-0.83090.204689
310.0124070.09530.462201
32-0.067207-0.51620.303812
33-0.081211-0.62380.267584
340.0333220.2560.399439
35-0.049136-0.37740.353608
36-0.202733-1.55720.062383
37-0.084835-0.65160.258586
38-0.015186-0.11660.453768
390.0457350.35130.363309
400.0859530.66020.255842
410.0331140.25440.400054
42-0.008657-0.06650.473605
430.0350470.26920.394356
440.0402530.30920.379133
45-0.029659-0.22780.410288
46-0.106573-0.81860.208153
470.0260710.20030.420986
48-0.083706-0.6430.26137

\begin{tabular}{lllllllll}
\hline
Partial Autocorrelation Function \tabularnewline
Time lag k & PACF(k) & T-STAT & P-value \tabularnewline
1 & -0.019357 & -0.1487 & 0.441155 \tabularnewline
2 & -0.171413 & -1.3166 & 0.096524 \tabularnewline
3 & -0.137382 & -1.0553 & 0.147806 \tabularnewline
4 & -0.094765 & -0.7279 & 0.234777 \tabularnewline
5 & -0.050651 & -0.3891 & 0.349316 \tabularnewline
6 & -0.103907 & -0.7981 & 0.213999 \tabularnewline
7 & 0.073443 & 0.5641 & 0.287402 \tabularnewline
8 & 0.115241 & 0.8852 & 0.189826 \tabularnewline
9 & 0.050934 & 0.3912 & 0.348518 \tabularnewline
10 & 0.114545 & 0.8798 & 0.191259 \tabularnewline
11 & 0.001991 & 0.0153 & 0.493925 \tabularnewline
12 & -0.074338 & -0.571 & 0.285084 \tabularnewline
13 & -0.017886 & -0.1374 & 0.445598 \tabularnewline
14 & 0.083283 & 0.6397 & 0.262419 \tabularnewline
15 & -0.01329 & -0.1021 & 0.459519 \tabularnewline
16 & -0.151916 & -1.1669 & 0.123974 \tabularnewline
17 & -0.052132 & -0.4004 & 0.345142 \tabularnewline
18 & -0.031629 & -0.2429 & 0.404445 \tabularnewline
19 & 0.001733 & 0.0133 & 0.494711 \tabularnewline
20 & -0.143024 & -1.0986 & 0.138205 \tabularnewline
21 & 0.18091 & 1.3896 & 0.084937 \tabularnewline
22 & -0.032026 & -0.246 & 0.403269 \tabularnewline
23 & -0.027392 & -0.2104 & 0.41704 \tabularnewline
24 & -0.074305 & -0.5708 & 0.285168 \tabularnewline
25 & -0.042224 & -0.3243 & 0.373418 \tabularnewline
26 & -0.001306 & -0.01 & 0.496014 \tabularnewline
27 & 0.102986 & 0.791 & 0.216043 \tabularnewline
28 & -0.009405 & -0.0722 & 0.471329 \tabularnewline
29 & -0.150824 & -1.1585 & 0.125664 \tabularnewline
30 & -0.108174 & -0.8309 & 0.204689 \tabularnewline
31 & 0.012407 & 0.0953 & 0.462201 \tabularnewline
32 & -0.067207 & -0.5162 & 0.303812 \tabularnewline
33 & -0.081211 & -0.6238 & 0.267584 \tabularnewline
34 & 0.033322 & 0.256 & 0.399439 \tabularnewline
35 & -0.049136 & -0.3774 & 0.353608 \tabularnewline
36 & -0.202733 & -1.5572 & 0.062383 \tabularnewline
37 & -0.084835 & -0.6516 & 0.258586 \tabularnewline
38 & -0.015186 & -0.1166 & 0.453768 \tabularnewline
39 & 0.045735 & 0.3513 & 0.363309 \tabularnewline
40 & 0.085953 & 0.6602 & 0.255842 \tabularnewline
41 & 0.033114 & 0.2544 & 0.400054 \tabularnewline
42 & -0.008657 & -0.0665 & 0.473605 \tabularnewline
43 & 0.035047 & 0.2692 & 0.394356 \tabularnewline
44 & 0.040253 & 0.3092 & 0.379133 \tabularnewline
45 & -0.029659 & -0.2278 & 0.410288 \tabularnewline
46 & -0.106573 & -0.8186 & 0.208153 \tabularnewline
47 & 0.026071 & 0.2003 & 0.420986 \tabularnewline
48 & -0.083706 & -0.643 & 0.26137 \tabularnewline
\hline
\end{tabular}
%Source: https://freestatistics.org/blog/index.php?pk=293969&T=2

[TABLE]
[ROW][C]Partial Autocorrelation Function[/C][/ROW]
[ROW][C]Time lag k[/C][C]PACF(k)[/C][C]T-STAT[/C][C]P-value[/C][/ROW]
[ROW][C]1[/C][C]-0.019357[/C][C]-0.1487[/C][C]0.441155[/C][/ROW]
[ROW][C]2[/C][C]-0.171413[/C][C]-1.3166[/C][C]0.096524[/C][/ROW]
[ROW][C]3[/C][C]-0.137382[/C][C]-1.0553[/C][C]0.147806[/C][/ROW]
[ROW][C]4[/C][C]-0.094765[/C][C]-0.7279[/C][C]0.234777[/C][/ROW]
[ROW][C]5[/C][C]-0.050651[/C][C]-0.3891[/C][C]0.349316[/C][/ROW]
[ROW][C]6[/C][C]-0.103907[/C][C]-0.7981[/C][C]0.213999[/C][/ROW]
[ROW][C]7[/C][C]0.073443[/C][C]0.5641[/C][C]0.287402[/C][/ROW]
[ROW][C]8[/C][C]0.115241[/C][C]0.8852[/C][C]0.189826[/C][/ROW]
[ROW][C]9[/C][C]0.050934[/C][C]0.3912[/C][C]0.348518[/C][/ROW]
[ROW][C]10[/C][C]0.114545[/C][C]0.8798[/C][C]0.191259[/C][/ROW]
[ROW][C]11[/C][C]0.001991[/C][C]0.0153[/C][C]0.493925[/C][/ROW]
[ROW][C]12[/C][C]-0.074338[/C][C]-0.571[/C][C]0.285084[/C][/ROW]
[ROW][C]13[/C][C]-0.017886[/C][C]-0.1374[/C][C]0.445598[/C][/ROW]
[ROW][C]14[/C][C]0.083283[/C][C]0.6397[/C][C]0.262419[/C][/ROW]
[ROW][C]15[/C][C]-0.01329[/C][C]-0.1021[/C][C]0.459519[/C][/ROW]
[ROW][C]16[/C][C]-0.151916[/C][C]-1.1669[/C][C]0.123974[/C][/ROW]
[ROW][C]17[/C][C]-0.052132[/C][C]-0.4004[/C][C]0.345142[/C][/ROW]
[ROW][C]18[/C][C]-0.031629[/C][C]-0.2429[/C][C]0.404445[/C][/ROW]
[ROW][C]19[/C][C]0.001733[/C][C]0.0133[/C][C]0.494711[/C][/ROW]
[ROW][C]20[/C][C]-0.143024[/C][C]-1.0986[/C][C]0.138205[/C][/ROW]
[ROW][C]21[/C][C]0.18091[/C][C]1.3896[/C][C]0.084937[/C][/ROW]
[ROW][C]22[/C][C]-0.032026[/C][C]-0.246[/C][C]0.403269[/C][/ROW]
[ROW][C]23[/C][C]-0.027392[/C][C]-0.2104[/C][C]0.41704[/C][/ROW]
[ROW][C]24[/C][C]-0.074305[/C][C]-0.5708[/C][C]0.285168[/C][/ROW]
[ROW][C]25[/C][C]-0.042224[/C][C]-0.3243[/C][C]0.373418[/C][/ROW]
[ROW][C]26[/C][C]-0.001306[/C][C]-0.01[/C][C]0.496014[/C][/ROW]
[ROW][C]27[/C][C]0.102986[/C][C]0.791[/C][C]0.216043[/C][/ROW]
[ROW][C]28[/C][C]-0.009405[/C][C]-0.0722[/C][C]0.471329[/C][/ROW]
[ROW][C]29[/C][C]-0.150824[/C][C]-1.1585[/C][C]0.125664[/C][/ROW]
[ROW][C]30[/C][C]-0.108174[/C][C]-0.8309[/C][C]0.204689[/C][/ROW]
[ROW][C]31[/C][C]0.012407[/C][C]0.0953[/C][C]0.462201[/C][/ROW]
[ROW][C]32[/C][C]-0.067207[/C][C]-0.5162[/C][C]0.303812[/C][/ROW]
[ROW][C]33[/C][C]-0.081211[/C][C]-0.6238[/C][C]0.267584[/C][/ROW]
[ROW][C]34[/C][C]0.033322[/C][C]0.256[/C][C]0.399439[/C][/ROW]
[ROW][C]35[/C][C]-0.049136[/C][C]-0.3774[/C][C]0.353608[/C][/ROW]
[ROW][C]36[/C][C]-0.202733[/C][C]-1.5572[/C][C]0.062383[/C][/ROW]
[ROW][C]37[/C][C]-0.084835[/C][C]-0.6516[/C][C]0.258586[/C][/ROW]
[ROW][C]38[/C][C]-0.015186[/C][C]-0.1166[/C][C]0.453768[/C][/ROW]
[ROW][C]39[/C][C]0.045735[/C][C]0.3513[/C][C]0.363309[/C][/ROW]
[ROW][C]40[/C][C]0.085953[/C][C]0.6602[/C][C]0.255842[/C][/ROW]
[ROW][C]41[/C][C]0.033114[/C][C]0.2544[/C][C]0.400054[/C][/ROW]
[ROW][C]42[/C][C]-0.008657[/C][C]-0.0665[/C][C]0.473605[/C][/ROW]
[ROW][C]43[/C][C]0.035047[/C][C]0.2692[/C][C]0.394356[/C][/ROW]
[ROW][C]44[/C][C]0.040253[/C][C]0.3092[/C][C]0.379133[/C][/ROW]
[ROW][C]45[/C][C]-0.029659[/C][C]-0.2278[/C][C]0.410288[/C][/ROW]
[ROW][C]46[/C][C]-0.106573[/C][C]-0.8186[/C][C]0.208153[/C][/ROW]
[ROW][C]47[/C][C]0.026071[/C][C]0.2003[/C][C]0.420986[/C][/ROW]
[ROW][C]48[/C][C]-0.083706[/C][C]-0.643[/C][C]0.26137[/C][/ROW]
[/TABLE]
Source: https://freestatistics.org/blog/index.php?pk=293969&T=2

Globally Unique Identifier (entire table): ba.freestatistics.org/blog/index.php?pk=293969&T=2

As an alternative you can also use a QR Code:  

The GUIDs for individual cells are displayed in the table below:

Partial Autocorrelation Function
Time lag kPACF(k)T-STATP-value
1-0.019357-0.14870.441155
2-0.171413-1.31660.096524
3-0.137382-1.05530.147806
4-0.094765-0.72790.234777
5-0.050651-0.38910.349316
6-0.103907-0.79810.213999
70.0734430.56410.287402
80.1152410.88520.189826
90.0509340.39120.348518
100.1145450.87980.191259
110.0019910.01530.493925
12-0.074338-0.5710.285084
13-0.017886-0.13740.445598
140.0832830.63970.262419
15-0.01329-0.10210.459519
16-0.151916-1.16690.123974
17-0.052132-0.40040.345142
18-0.031629-0.24290.404445
190.0017330.01330.494711
20-0.143024-1.09860.138205
210.180911.38960.084937
22-0.032026-0.2460.403269
23-0.027392-0.21040.41704
24-0.074305-0.57080.285168
25-0.042224-0.32430.373418
26-0.001306-0.010.496014
270.1029860.7910.216043
28-0.009405-0.07220.471329
29-0.150824-1.15850.125664
30-0.108174-0.83090.204689
310.0124070.09530.462201
32-0.067207-0.51620.303812
33-0.081211-0.62380.267584
340.0333220.2560.399439
35-0.049136-0.37740.353608
36-0.202733-1.55720.062383
37-0.084835-0.65160.258586
38-0.015186-0.11660.453768
390.0457350.35130.363309
400.0859530.66020.255842
410.0331140.25440.400054
42-0.008657-0.06650.473605
430.0350470.26920.394356
440.0402530.30920.379133
45-0.029659-0.22780.410288
46-0.106573-0.81860.208153
470.0260710.20030.420986
48-0.083706-0.6430.26137


Parameters (Session):
par1 = 48 ; par2 = 1 ; par3 = 1 ; par4 = 0 ; par5 = 12 ; par6 = White Noise ; par7 = 0.95 ;
Parameters (R input):
par1 = 48 ; par2 = 1 ; par3 = 1 ; par4 = 0 ; par5 = 12 ; par6 = White Noise ; par7 = 0.95 ; par8 = ;
R code (references can be found in the software module):
par8 <- ''
par7 <- '0.95'
par6 <- 'White Noise'
par5 <- '12'
par4 <- '0'
par3 <- '1'
par2 <- '1'
par1 <- 'Default'
if (par1 == 'Default') {
par1 = 10*log10(length(x))
} else {
par1 <- as.numeric(par1)
}
par2 <- as.numeric(par2)
par3 <- as.numeric(par3)
par4 <- as.numeric(par4)
par5 <- as.numeric(par5)
if (par6 == 'White Noise') par6 <- 'white' else par6 <- 'ma'
par7 <- as.numeric(par7)
if (par8 != '') par8 <- as.numeric(par8)
x <- na.omit(x)
ox <- x
if (par8 == '') {
if (par2 == 0) {
x <- log(x)
} else {
x <- (x ^ par2 - 1) / par2
}
} else {
x <- log(x,base=par8)
}
if (par3 > 0) x <- diff(x,lag=1,difference=par3)
if (par4 > 0) x <- diff(x,lag=par5,difference=par4)
bitmap(file='picts.png')
op <- par(mfrow=c(2,1))
plot(ox,type='l',main='Original Time Series',xlab='time',ylab='value')
if (par8=='') {
mytitle <- paste('Working Time Series (lambda=',par2,', d=',par3,', D=',par4,')',sep='')
mysub <- paste('(lambda=',par2,', d=',par3,', D=',par4,', CI=', par7, ', CI type=',par6,')',sep='')
} else {
mytitle <- paste('Working Time Series (base=',par8,', d=',par3,', D=',par4,')',sep='')
mysub <- paste('(base=',par8,', d=',par3,', D=',par4,', CI=', par7, ', CI type=',par6,')',sep='')
}
plot(x,type='l', main=mytitle,xlab='time',ylab='value')
par(op)
dev.off()
bitmap(file='pic1.png')
racf <- acf(x, par1, main='Autocorrelation', xlab='time lag', ylab='ACF', ci.type=par6, ci=par7, sub=mysub)
dev.off()
bitmap(file='pic2.png')
rpacf <- pacf(x,par1,main='Partial Autocorrelation',xlab='lags',ylab='PACF',sub=mysub)
dev.off()
(myacf <- c(racf$acf))
(mypacf <- c(rpacf$acf))
lengthx <- length(x)
sqrtn <- sqrt(lengthx)
load(file='createtable')
a<-table.start()
a<-table.row.start(a)
a<-table.element(a,'Autocorrelation Function',4,TRUE)
a<-table.row.end(a)
a<-table.row.start(a)
a<-table.element(a,'Time lag k',header=TRUE)
a<-table.element(a,hyperlink('basics.htm','ACF(k)','click here for more information about the Autocorrelation Function'),header=TRUE)
a<-table.element(a,'T-STAT',header=TRUE)
a<-table.element(a,'P-value',header=TRUE)
a<-table.row.end(a)
for (i in 2:(par1+1)) {
a<-table.row.start(a)
a<-table.element(a,i-1,header=TRUE)
a<-table.element(a,round(myacf[i],6))
mytstat <- myacf[i]*sqrtn
a<-table.element(a,round(mytstat,4))
a<-table.element(a,round(1-pt(abs(mytstat),lengthx),6))
a<-table.row.end(a)
}
a<-table.end(a)
table.save(a,file='mytable.tab')
a<-table.start()
a<-table.row.start(a)
a<-table.element(a,'Partial Autocorrelation Function',4,TRUE)
a<-table.row.end(a)
a<-table.row.start(a)
a<-table.element(a,'Time lag k',header=TRUE)
a<-table.element(a,hyperlink('basics.htm','PACF(k)','click here for more information about the Partial Autocorrelation Function'),header=TRUE)
a<-table.element(a,'T-STAT',header=TRUE)
a<-table.element(a,'P-value',header=TRUE)
a<-table.row.end(a)
for (i in 1:par1) {
a<-table.row.start(a)
a<-table.element(a,i,header=TRUE)
a<-table.element(a,round(mypacf[i],6))
mytstat <- mypacf[i]*sqrtn
a<-table.element(a,round(mytstat,4))
a<-table.element(a,round(1-pt(abs(mytstat),lengthx),6))
a<-table.row.end(a)
}
a<-table.end(a)
table.save(a,file='mytable1.tab')