Free Statistics

of Irreproducible Research!

Author's title

Author*Unverified author*
R Software Modulerwasp_autocorrelation.wasp
Title produced by software(Partial) Autocorrelation Function
Date of computationSun, 13 Mar 2016 08:12:28 +0000
Cite this page as followsStatistical Computations at FreeStatistics.org, Office for Research Development and Education, URL https://freestatistics.org/blog/index.php?v=date/2016/Mar/13/t1457856825dxo4n8t9r02a033.htm/, Retrieved Wed, 08 May 2024 03:45:06 +0000
Statistical Computations at FreeStatistics.org, Office for Research Development and Education, URL https://freestatistics.org/blog/index.php?pk=293984, Retrieved Wed, 08 May 2024 03:45:06 +0000
QR Codes:

Original text written by user:
IsPrivate?No (this computation is public)
User-defined keywords
Estimated Impact162
Family? (F = Feedback message, R = changed R code, M = changed R Module, P = changed Parameters, D = changed Data)
-       [(Partial) Autocorrelation Function] [] [2016-03-13 08:12:28] [f9cf779ce6533af8ecf1f6ee8a638c60] [Current]
Feedback Forum

Post a new message
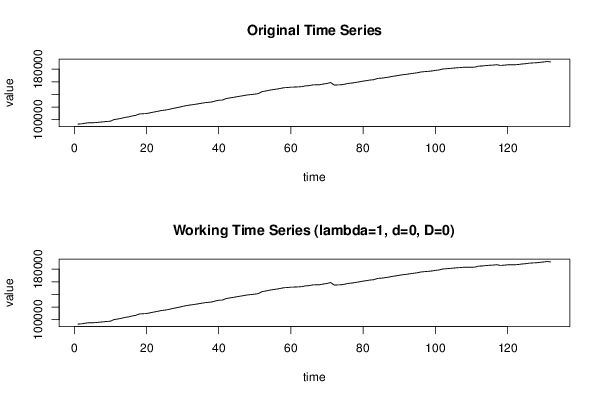
Dataseries X:
93166
93517
94547
95299
95121
95583
96138
96647
97311
97644
100299
101130
102239
103667
104494
105944
106956
109156
109528
109813
110939
112182
113137
114506
115197
116142
117478
118678
119808
121210
122372
123266
124020
124922
125863
126898
127522
128062
129630
130919
131175
133387
134512
135423
136395
137384
138344
139342
139885
140560
141457
144577
145505
146767
147602
148490
149516
150688
151012
151614
151779
152062
152432
153634
153989
155114
155448
155514
156552
157472
158928
154948
155178
155396
156479
157562
158255
159138
160067
161112
162009
162941
163463
165473
165805
166524
167426
168593
169452
170386
171281
171950
172842
173644
174380
175639
176169
176642
177225
178180
178771
180337
180740
181299
181768
182304
182670
183241
183106
183039
183447
184915
185144
185787
186243
186518
187156
186083
186350
187010
187057
187019
187487
188280
188756
189574
189996
190251
190925
191499
192172
191639


Summary of computational transaction
Raw Inputview raw input (R code)
Raw Outputview raw output of R engine
Computing time1 seconds
R Server'George Udny Yule' @ yule.wessa.net

\begin{tabular}{lllllllll}
\hline
Summary of computational transaction \tabularnewline
Raw Input & view raw input (R code)  \tabularnewline
Raw Output & view raw output of R engine  \tabularnewline
Computing time & 1 seconds \tabularnewline
R Server & 'George Udny Yule' @ yule.wessa.net \tabularnewline
\hline
\end{tabular}
%Source: https://freestatistics.org/blog/index.php?pk=293984&T=0

[TABLE]
[ROW][C]Summary of computational transaction[/C][/ROW]
[ROW][C]Raw Input[/C][C]view raw input (R code) [/C][/ROW]
[ROW][C]Raw Output[/C][C]view raw output of R engine [/C][/ROW]
[ROW][C]Computing time[/C][C]1 seconds[/C][/ROW]
[ROW][C]R Server[/C][C]'George Udny Yule' @ yule.wessa.net[/C][/ROW]
[/TABLE]
Source: https://freestatistics.org/blog/index.php?pk=293984&T=0

Globally Unique Identifier (entire table): ba.freestatistics.org/blog/index.php?pk=293984&T=0

As an alternative you can also use a QR Code:  

The GUIDs for individual cells are displayed in the table below:

Summary of computational transaction
Raw Inputview raw input (R code)
Raw Outputview raw output of R engine
Computing time1 seconds
R Server'George Udny Yule' @ yule.wessa.net


Autocorrelation Function
Time lag kACF(k)T-STATP-value
10.97892111.2470
20.95716610.9970
30.93544310.74740
40.91362610.49680
50.89127310.23990
60.868539.97860
70.8455529.71470
80.8224429.44910
90.7992079.18220
100.7757648.91290
110.753078.65210
120.7301118.38830
130.7070538.12340
140.6842297.86120
150.6612857.59760
160.6380577.33070
170.6149777.06550
180.5924596.80680
190.5696796.54510
200.5467066.28120
210.5238846.0190
220.5016155.76310
230.4793965.50780
240.4572535.25340
250.4348174.99571e-06
260.4124864.73913e-06
270.390384.48518e-06
280.3684994.23372.1e-05
290.3467833.98425.6e-05
300.3254123.73870.000137
310.3043073.49620.000322
320.2836253.25860.000712
330.2630253.02190.001509
340.2427262.78870.003037
350.2225942.55740.005838
360.2026272.3280.010716
370.1826212.09820.018899
380.1628321.87080.031794
390.1435671.64950.050716
400.124731.4330.077105
410.1059131.21690.112916
420.08791.00990.157197
430.0703020.80770.210357
440.0530650.60970.271566
450.0361720.41560.339194
460.0197680.22710.41034
470.0036850.04230.483147
48-0.012056-0.13850.445022

\begin{tabular}{lllllllll}
\hline
Autocorrelation Function \tabularnewline
Time lag k & ACF(k) & T-STAT & P-value \tabularnewline
1 & 0.978921 & 11.247 & 0 \tabularnewline
2 & 0.957166 & 10.997 & 0 \tabularnewline
3 & 0.935443 & 10.7474 & 0 \tabularnewline
4 & 0.913626 & 10.4968 & 0 \tabularnewline
5 & 0.891273 & 10.2399 & 0 \tabularnewline
6 & 0.86853 & 9.9786 & 0 \tabularnewline
7 & 0.845552 & 9.7147 & 0 \tabularnewline
8 & 0.822442 & 9.4491 & 0 \tabularnewline
9 & 0.799207 & 9.1822 & 0 \tabularnewline
10 & 0.775764 & 8.9129 & 0 \tabularnewline
11 & 0.75307 & 8.6521 & 0 \tabularnewline
12 & 0.730111 & 8.3883 & 0 \tabularnewline
13 & 0.707053 & 8.1234 & 0 \tabularnewline
14 & 0.684229 & 7.8612 & 0 \tabularnewline
15 & 0.661285 & 7.5976 & 0 \tabularnewline
16 & 0.638057 & 7.3307 & 0 \tabularnewline
17 & 0.614977 & 7.0655 & 0 \tabularnewline
18 & 0.592459 & 6.8068 & 0 \tabularnewline
19 & 0.569679 & 6.5451 & 0 \tabularnewline
20 & 0.546706 & 6.2812 & 0 \tabularnewline
21 & 0.523884 & 6.019 & 0 \tabularnewline
22 & 0.501615 & 5.7631 & 0 \tabularnewline
23 & 0.479396 & 5.5078 & 0 \tabularnewline
24 & 0.457253 & 5.2534 & 0 \tabularnewline
25 & 0.434817 & 4.9957 & 1e-06 \tabularnewline
26 & 0.412486 & 4.7391 & 3e-06 \tabularnewline
27 & 0.39038 & 4.4851 & 8e-06 \tabularnewline
28 & 0.368499 & 4.2337 & 2.1e-05 \tabularnewline
29 & 0.346783 & 3.9842 & 5.6e-05 \tabularnewline
30 & 0.325412 & 3.7387 & 0.000137 \tabularnewline
31 & 0.304307 & 3.4962 & 0.000322 \tabularnewline
32 & 0.283625 & 3.2586 & 0.000712 \tabularnewline
33 & 0.263025 & 3.0219 & 0.001509 \tabularnewline
34 & 0.242726 & 2.7887 & 0.003037 \tabularnewline
35 & 0.222594 & 2.5574 & 0.005838 \tabularnewline
36 & 0.202627 & 2.328 & 0.010716 \tabularnewline
37 & 0.182621 & 2.0982 & 0.018899 \tabularnewline
38 & 0.162832 & 1.8708 & 0.031794 \tabularnewline
39 & 0.143567 & 1.6495 & 0.050716 \tabularnewline
40 & 0.12473 & 1.433 & 0.077105 \tabularnewline
41 & 0.105913 & 1.2169 & 0.112916 \tabularnewline
42 & 0.0879 & 1.0099 & 0.157197 \tabularnewline
43 & 0.070302 & 0.8077 & 0.210357 \tabularnewline
44 & 0.053065 & 0.6097 & 0.271566 \tabularnewline
45 & 0.036172 & 0.4156 & 0.339194 \tabularnewline
46 & 0.019768 & 0.2271 & 0.41034 \tabularnewline
47 & 0.003685 & 0.0423 & 0.483147 \tabularnewline
48 & -0.012056 & -0.1385 & 0.445022 \tabularnewline
\hline
\end{tabular}
%Source: https://freestatistics.org/blog/index.php?pk=293984&T=1

[TABLE]
[ROW][C]Autocorrelation Function[/C][/ROW]
[ROW][C]Time lag k[/C][C]ACF(k)[/C][C]T-STAT[/C][C]P-value[/C][/ROW]
[ROW][C]1[/C][C]0.978921[/C][C]11.247[/C][C]0[/C][/ROW]
[ROW][C]2[/C][C]0.957166[/C][C]10.997[/C][C]0[/C][/ROW]
[ROW][C]3[/C][C]0.935443[/C][C]10.7474[/C][C]0[/C][/ROW]
[ROW][C]4[/C][C]0.913626[/C][C]10.4968[/C][C]0[/C][/ROW]
[ROW][C]5[/C][C]0.891273[/C][C]10.2399[/C][C]0[/C][/ROW]
[ROW][C]6[/C][C]0.86853[/C][C]9.9786[/C][C]0[/C][/ROW]
[ROW][C]7[/C][C]0.845552[/C][C]9.7147[/C][C]0[/C][/ROW]
[ROW][C]8[/C][C]0.822442[/C][C]9.4491[/C][C]0[/C][/ROW]
[ROW][C]9[/C][C]0.799207[/C][C]9.1822[/C][C]0[/C][/ROW]
[ROW][C]10[/C][C]0.775764[/C][C]8.9129[/C][C]0[/C][/ROW]
[ROW][C]11[/C][C]0.75307[/C][C]8.6521[/C][C]0[/C][/ROW]
[ROW][C]12[/C][C]0.730111[/C][C]8.3883[/C][C]0[/C][/ROW]
[ROW][C]13[/C][C]0.707053[/C][C]8.1234[/C][C]0[/C][/ROW]
[ROW][C]14[/C][C]0.684229[/C][C]7.8612[/C][C]0[/C][/ROW]
[ROW][C]15[/C][C]0.661285[/C][C]7.5976[/C][C]0[/C][/ROW]
[ROW][C]16[/C][C]0.638057[/C][C]7.3307[/C][C]0[/C][/ROW]
[ROW][C]17[/C][C]0.614977[/C][C]7.0655[/C][C]0[/C][/ROW]
[ROW][C]18[/C][C]0.592459[/C][C]6.8068[/C][C]0[/C][/ROW]
[ROW][C]19[/C][C]0.569679[/C][C]6.5451[/C][C]0[/C][/ROW]
[ROW][C]20[/C][C]0.546706[/C][C]6.2812[/C][C]0[/C][/ROW]
[ROW][C]21[/C][C]0.523884[/C][C]6.019[/C][C]0[/C][/ROW]
[ROW][C]22[/C][C]0.501615[/C][C]5.7631[/C][C]0[/C][/ROW]
[ROW][C]23[/C][C]0.479396[/C][C]5.5078[/C][C]0[/C][/ROW]
[ROW][C]24[/C][C]0.457253[/C][C]5.2534[/C][C]0[/C][/ROW]
[ROW][C]25[/C][C]0.434817[/C][C]4.9957[/C][C]1e-06[/C][/ROW]
[ROW][C]26[/C][C]0.412486[/C][C]4.7391[/C][C]3e-06[/C][/ROW]
[ROW][C]27[/C][C]0.39038[/C][C]4.4851[/C][C]8e-06[/C][/ROW]
[ROW][C]28[/C][C]0.368499[/C][C]4.2337[/C][C]2.1e-05[/C][/ROW]
[ROW][C]29[/C][C]0.346783[/C][C]3.9842[/C][C]5.6e-05[/C][/ROW]
[ROW][C]30[/C][C]0.325412[/C][C]3.7387[/C][C]0.000137[/C][/ROW]
[ROW][C]31[/C][C]0.304307[/C][C]3.4962[/C][C]0.000322[/C][/ROW]
[ROW][C]32[/C][C]0.283625[/C][C]3.2586[/C][C]0.000712[/C][/ROW]
[ROW][C]33[/C][C]0.263025[/C][C]3.0219[/C][C]0.001509[/C][/ROW]
[ROW][C]34[/C][C]0.242726[/C][C]2.7887[/C][C]0.003037[/C][/ROW]
[ROW][C]35[/C][C]0.222594[/C][C]2.5574[/C][C]0.005838[/C][/ROW]
[ROW][C]36[/C][C]0.202627[/C][C]2.328[/C][C]0.010716[/C][/ROW]
[ROW][C]37[/C][C]0.182621[/C][C]2.0982[/C][C]0.018899[/C][/ROW]
[ROW][C]38[/C][C]0.162832[/C][C]1.8708[/C][C]0.031794[/C][/ROW]
[ROW][C]39[/C][C]0.143567[/C][C]1.6495[/C][C]0.050716[/C][/ROW]
[ROW][C]40[/C][C]0.12473[/C][C]1.433[/C][C]0.077105[/C][/ROW]
[ROW][C]41[/C][C]0.105913[/C][C]1.2169[/C][C]0.112916[/C][/ROW]
[ROW][C]42[/C][C]0.0879[/C][C]1.0099[/C][C]0.157197[/C][/ROW]
[ROW][C]43[/C][C]0.070302[/C][C]0.8077[/C][C]0.210357[/C][/ROW]
[ROW][C]44[/C][C]0.053065[/C][C]0.6097[/C][C]0.271566[/C][/ROW]
[ROW][C]45[/C][C]0.036172[/C][C]0.4156[/C][C]0.339194[/C][/ROW]
[ROW][C]46[/C][C]0.019768[/C][C]0.2271[/C][C]0.41034[/C][/ROW]
[ROW][C]47[/C][C]0.003685[/C][C]0.0423[/C][C]0.483147[/C][/ROW]
[ROW][C]48[/C][C]-0.012056[/C][C]-0.1385[/C][C]0.445022[/C][/ROW]
[/TABLE]
Source: https://freestatistics.org/blog/index.php?pk=293984&T=1

Globally Unique Identifier (entire table): ba.freestatistics.org/blog/index.php?pk=293984&T=1

As an alternative you can also use a QR Code:  

The GUIDs for individual cells are displayed in the table below:

Autocorrelation Function
Time lag kACF(k)T-STATP-value
10.97892111.2470
20.95716610.9970
30.93544310.74740
40.91362610.49680
50.89127310.23990
60.868539.97860
70.8455529.71470
80.8224429.44910
90.7992079.18220
100.7757648.91290
110.753078.65210
120.7301118.38830
130.7070538.12340
140.6842297.86120
150.6612857.59760
160.6380577.33070
170.6149777.06550
180.5924596.80680
190.5696796.54510
200.5467066.28120
210.5238846.0190
220.5016155.76310
230.4793965.50780
240.4572535.25340
250.4348174.99571e-06
260.4124864.73913e-06
270.390384.48518e-06
280.3684994.23372.1e-05
290.3467833.98425.6e-05
300.3254123.73870.000137
310.3043073.49620.000322
320.2836253.25860.000712
330.2630253.02190.001509
340.2427262.78870.003037
350.2225942.55740.005838
360.2026272.3280.010716
370.1826212.09820.018899
380.1628321.87080.031794
390.1435671.64950.050716
400.124731.4330.077105
410.1059131.21690.112916
420.08791.00990.157197
430.0703020.80770.210357
440.0530650.60970.271566
450.0361720.41560.339194
460.0197680.22710.41034
470.0036850.04230.483147
48-0.012056-0.13850.445022


Partial Autocorrelation Function
Time lag kPACF(k)T-STATP-value
10.97892111.2470
2-0.026869-0.30870.379018
3-0.010098-0.1160.453907
4-0.013499-0.15510.438494
5-0.024205-0.27810.390686
6-0.020791-0.23890.405789
7-0.017534-0.20150.420328
8-0.015459-0.17760.429653
9-0.015405-0.1770.429892
10-0.017625-0.20250.419922
110.0051650.05930.476387
12-0.019694-0.22630.410673
13-0.015235-0.1750.430659
14-0.007676-0.08820.464932
15-0.016928-0.19450.423048
16-0.020614-0.23680.406576
17-0.010447-0.120.452324
18-0.000982-0.01130.495509
19-0.020841-0.23940.405567
20-0.018951-0.21770.413987
21-0.010684-0.12280.451245
22-0.002275-0.02610.489592
23-0.01417-0.16280.43546
24-0.012838-0.14750.441481
25-0.022508-0.25860.398174
26-0.013491-0.1550.438529
27-0.010629-0.12210.451494
28-0.010285-0.11820.453059
29-0.012599-0.14480.442564
30-0.008059-0.09260.463183
31-0.009823-0.11290.455157
32-0.006184-0.0710.471734
33-0.015078-0.17320.431365
34-0.009161-0.10520.458169
35-0.013067-0.15010.440444
36-0.013387-0.15380.439001
37-0.018213-0.20930.417287
38-0.011982-0.13770.445357
39-0.004691-0.05390.47855
40-0.007246-0.08330.466887
41-0.017069-0.19610.422413
420.0019490.02240.491086
43-0.00781-0.08970.464317
44-0.008605-0.09890.4607
45-0.0092-0.10570.45799
46-0.006264-0.0720.471367
47-0.010153-0.11660.453659
48-0.009224-0.1060.457883

\begin{tabular}{lllllllll}
\hline
Partial Autocorrelation Function \tabularnewline
Time lag k & PACF(k) & T-STAT & P-value \tabularnewline
1 & 0.978921 & 11.247 & 0 \tabularnewline
2 & -0.026869 & -0.3087 & 0.379018 \tabularnewline
3 & -0.010098 & -0.116 & 0.453907 \tabularnewline
4 & -0.013499 & -0.1551 & 0.438494 \tabularnewline
5 & -0.024205 & -0.2781 & 0.390686 \tabularnewline
6 & -0.020791 & -0.2389 & 0.405789 \tabularnewline
7 & -0.017534 & -0.2015 & 0.420328 \tabularnewline
8 & -0.015459 & -0.1776 & 0.429653 \tabularnewline
9 & -0.015405 & -0.177 & 0.429892 \tabularnewline
10 & -0.017625 & -0.2025 & 0.419922 \tabularnewline
11 & 0.005165 & 0.0593 & 0.476387 \tabularnewline
12 & -0.019694 & -0.2263 & 0.410673 \tabularnewline
13 & -0.015235 & -0.175 & 0.430659 \tabularnewline
14 & -0.007676 & -0.0882 & 0.464932 \tabularnewline
15 & -0.016928 & -0.1945 & 0.423048 \tabularnewline
16 & -0.020614 & -0.2368 & 0.406576 \tabularnewline
17 & -0.010447 & -0.12 & 0.452324 \tabularnewline
18 & -0.000982 & -0.0113 & 0.495509 \tabularnewline
19 & -0.020841 & -0.2394 & 0.405567 \tabularnewline
20 & -0.018951 & -0.2177 & 0.413987 \tabularnewline
21 & -0.010684 & -0.1228 & 0.451245 \tabularnewline
22 & -0.002275 & -0.0261 & 0.489592 \tabularnewline
23 & -0.01417 & -0.1628 & 0.43546 \tabularnewline
24 & -0.012838 & -0.1475 & 0.441481 \tabularnewline
25 & -0.022508 & -0.2586 & 0.398174 \tabularnewline
26 & -0.013491 & -0.155 & 0.438529 \tabularnewline
27 & -0.010629 & -0.1221 & 0.451494 \tabularnewline
28 & -0.010285 & -0.1182 & 0.453059 \tabularnewline
29 & -0.012599 & -0.1448 & 0.442564 \tabularnewline
30 & -0.008059 & -0.0926 & 0.463183 \tabularnewline
31 & -0.009823 & -0.1129 & 0.455157 \tabularnewline
32 & -0.006184 & -0.071 & 0.471734 \tabularnewline
33 & -0.015078 & -0.1732 & 0.431365 \tabularnewline
34 & -0.009161 & -0.1052 & 0.458169 \tabularnewline
35 & -0.013067 & -0.1501 & 0.440444 \tabularnewline
36 & -0.013387 & -0.1538 & 0.439001 \tabularnewline
37 & -0.018213 & -0.2093 & 0.417287 \tabularnewline
38 & -0.011982 & -0.1377 & 0.445357 \tabularnewline
39 & -0.004691 & -0.0539 & 0.47855 \tabularnewline
40 & -0.007246 & -0.0833 & 0.466887 \tabularnewline
41 & -0.017069 & -0.1961 & 0.422413 \tabularnewline
42 & 0.001949 & 0.0224 & 0.491086 \tabularnewline
43 & -0.00781 & -0.0897 & 0.464317 \tabularnewline
44 & -0.008605 & -0.0989 & 0.4607 \tabularnewline
45 & -0.0092 & -0.1057 & 0.45799 \tabularnewline
46 & -0.006264 & -0.072 & 0.471367 \tabularnewline
47 & -0.010153 & -0.1166 & 0.453659 \tabularnewline
48 & -0.009224 & -0.106 & 0.457883 \tabularnewline
\hline
\end{tabular}
%Source: https://freestatistics.org/blog/index.php?pk=293984&T=2

[TABLE]
[ROW][C]Partial Autocorrelation Function[/C][/ROW]
[ROW][C]Time lag k[/C][C]PACF(k)[/C][C]T-STAT[/C][C]P-value[/C][/ROW]
[ROW][C]1[/C][C]0.978921[/C][C]11.247[/C][C]0[/C][/ROW]
[ROW][C]2[/C][C]-0.026869[/C][C]-0.3087[/C][C]0.379018[/C][/ROW]
[ROW][C]3[/C][C]-0.010098[/C][C]-0.116[/C][C]0.453907[/C][/ROW]
[ROW][C]4[/C][C]-0.013499[/C][C]-0.1551[/C][C]0.438494[/C][/ROW]
[ROW][C]5[/C][C]-0.024205[/C][C]-0.2781[/C][C]0.390686[/C][/ROW]
[ROW][C]6[/C][C]-0.020791[/C][C]-0.2389[/C][C]0.405789[/C][/ROW]
[ROW][C]7[/C][C]-0.017534[/C][C]-0.2015[/C][C]0.420328[/C][/ROW]
[ROW][C]8[/C][C]-0.015459[/C][C]-0.1776[/C][C]0.429653[/C][/ROW]
[ROW][C]9[/C][C]-0.015405[/C][C]-0.177[/C][C]0.429892[/C][/ROW]
[ROW][C]10[/C][C]-0.017625[/C][C]-0.2025[/C][C]0.419922[/C][/ROW]
[ROW][C]11[/C][C]0.005165[/C][C]0.0593[/C][C]0.476387[/C][/ROW]
[ROW][C]12[/C][C]-0.019694[/C][C]-0.2263[/C][C]0.410673[/C][/ROW]
[ROW][C]13[/C][C]-0.015235[/C][C]-0.175[/C][C]0.430659[/C][/ROW]
[ROW][C]14[/C][C]-0.007676[/C][C]-0.0882[/C][C]0.464932[/C][/ROW]
[ROW][C]15[/C][C]-0.016928[/C][C]-0.1945[/C][C]0.423048[/C][/ROW]
[ROW][C]16[/C][C]-0.020614[/C][C]-0.2368[/C][C]0.406576[/C][/ROW]
[ROW][C]17[/C][C]-0.010447[/C][C]-0.12[/C][C]0.452324[/C][/ROW]
[ROW][C]18[/C][C]-0.000982[/C][C]-0.0113[/C][C]0.495509[/C][/ROW]
[ROW][C]19[/C][C]-0.020841[/C][C]-0.2394[/C][C]0.405567[/C][/ROW]
[ROW][C]20[/C][C]-0.018951[/C][C]-0.2177[/C][C]0.413987[/C][/ROW]
[ROW][C]21[/C][C]-0.010684[/C][C]-0.1228[/C][C]0.451245[/C][/ROW]
[ROW][C]22[/C][C]-0.002275[/C][C]-0.0261[/C][C]0.489592[/C][/ROW]
[ROW][C]23[/C][C]-0.01417[/C][C]-0.1628[/C][C]0.43546[/C][/ROW]
[ROW][C]24[/C][C]-0.012838[/C][C]-0.1475[/C][C]0.441481[/C][/ROW]
[ROW][C]25[/C][C]-0.022508[/C][C]-0.2586[/C][C]0.398174[/C][/ROW]
[ROW][C]26[/C][C]-0.013491[/C][C]-0.155[/C][C]0.438529[/C][/ROW]
[ROW][C]27[/C][C]-0.010629[/C][C]-0.1221[/C][C]0.451494[/C][/ROW]
[ROW][C]28[/C][C]-0.010285[/C][C]-0.1182[/C][C]0.453059[/C][/ROW]
[ROW][C]29[/C][C]-0.012599[/C][C]-0.1448[/C][C]0.442564[/C][/ROW]
[ROW][C]30[/C][C]-0.008059[/C][C]-0.0926[/C][C]0.463183[/C][/ROW]
[ROW][C]31[/C][C]-0.009823[/C][C]-0.1129[/C][C]0.455157[/C][/ROW]
[ROW][C]32[/C][C]-0.006184[/C][C]-0.071[/C][C]0.471734[/C][/ROW]
[ROW][C]33[/C][C]-0.015078[/C][C]-0.1732[/C][C]0.431365[/C][/ROW]
[ROW][C]34[/C][C]-0.009161[/C][C]-0.1052[/C][C]0.458169[/C][/ROW]
[ROW][C]35[/C][C]-0.013067[/C][C]-0.1501[/C][C]0.440444[/C][/ROW]
[ROW][C]36[/C][C]-0.013387[/C][C]-0.1538[/C][C]0.439001[/C][/ROW]
[ROW][C]37[/C][C]-0.018213[/C][C]-0.2093[/C][C]0.417287[/C][/ROW]
[ROW][C]38[/C][C]-0.011982[/C][C]-0.1377[/C][C]0.445357[/C][/ROW]
[ROW][C]39[/C][C]-0.004691[/C][C]-0.0539[/C][C]0.47855[/C][/ROW]
[ROW][C]40[/C][C]-0.007246[/C][C]-0.0833[/C][C]0.466887[/C][/ROW]
[ROW][C]41[/C][C]-0.017069[/C][C]-0.1961[/C][C]0.422413[/C][/ROW]
[ROW][C]42[/C][C]0.001949[/C][C]0.0224[/C][C]0.491086[/C][/ROW]
[ROW][C]43[/C][C]-0.00781[/C][C]-0.0897[/C][C]0.464317[/C][/ROW]
[ROW][C]44[/C][C]-0.008605[/C][C]-0.0989[/C][C]0.4607[/C][/ROW]
[ROW][C]45[/C][C]-0.0092[/C][C]-0.1057[/C][C]0.45799[/C][/ROW]
[ROW][C]46[/C][C]-0.006264[/C][C]-0.072[/C][C]0.471367[/C][/ROW]
[ROW][C]47[/C][C]-0.010153[/C][C]-0.1166[/C][C]0.453659[/C][/ROW]
[ROW][C]48[/C][C]-0.009224[/C][C]-0.106[/C][C]0.457883[/C][/ROW]
[/TABLE]
Source: https://freestatistics.org/blog/index.php?pk=293984&T=2

Globally Unique Identifier (entire table): ba.freestatistics.org/blog/index.php?pk=293984&T=2

As an alternative you can also use a QR Code:  

The GUIDs for individual cells are displayed in the table below:

Partial Autocorrelation Function
Time lag kPACF(k)T-STATP-value
10.97892111.2470
2-0.026869-0.30870.379018
3-0.010098-0.1160.453907
4-0.013499-0.15510.438494
5-0.024205-0.27810.390686
6-0.020791-0.23890.405789
7-0.017534-0.20150.420328
8-0.015459-0.17760.429653
9-0.015405-0.1770.429892
10-0.017625-0.20250.419922
110.0051650.05930.476387
12-0.019694-0.22630.410673
13-0.015235-0.1750.430659
14-0.007676-0.08820.464932
15-0.016928-0.19450.423048
16-0.020614-0.23680.406576
17-0.010447-0.120.452324
18-0.000982-0.01130.495509
19-0.020841-0.23940.405567
20-0.018951-0.21770.413987
21-0.010684-0.12280.451245
22-0.002275-0.02610.489592
23-0.01417-0.16280.43546
24-0.012838-0.14750.441481
25-0.022508-0.25860.398174
26-0.013491-0.1550.438529
27-0.010629-0.12210.451494
28-0.010285-0.11820.453059
29-0.012599-0.14480.442564
30-0.008059-0.09260.463183
31-0.009823-0.11290.455157
32-0.006184-0.0710.471734
33-0.015078-0.17320.431365
34-0.009161-0.10520.458169
35-0.013067-0.15010.440444
36-0.013387-0.15380.439001
37-0.018213-0.20930.417287
38-0.011982-0.13770.445357
39-0.004691-0.05390.47855
40-0.007246-0.08330.466887
41-0.017069-0.19610.422413
420.0019490.02240.491086
43-0.00781-0.08970.464317
44-0.008605-0.09890.4607
45-0.0092-0.10570.45799
46-0.006264-0.0720.471367
47-0.010153-0.11660.453659
48-0.009224-0.1060.457883


Parameters (Session):
par1 = 48 ; par2 = 1 ; par3 = 0 ; par4 = 0 ; par5 = 12 ; par6 = White Noise ; par7 = 0.95 ;
Parameters (R input):
par1 = 48 ; par2 = 1 ; par3 = 0 ; par4 = 0 ; par5 = 12 ; par6 = White Noise ; par7 = 0.95 ; par8 = ;
R code (references can be found in the software module):
if (par1 == 'Default') {
par1 = 10*log10(length(x))
} else {
par1 <- as.numeric(par1)
}
par2 <- as.numeric(par2)
par3 <- as.numeric(par3)
par4 <- as.numeric(par4)
par5 <- as.numeric(par5)
if (par6 == 'White Noise') par6 <- 'white' else par6 <- 'ma'
par7 <- as.numeric(par7)
if (par8 != '') par8 <- as.numeric(par8)
x <- na.omit(x)
ox <- x
if (par8 == '') {
if (par2 == 0) {
x <- log(x)
} else {
x <- (x ^ par2 - 1) / par2
}
} else {
x <- log(x,base=par8)
}
if (par3 > 0) x <- diff(x,lag=1,difference=par3)
if (par4 > 0) x <- diff(x,lag=par5,difference=par4)
bitmap(file='picts.png')
op <- par(mfrow=c(2,1))
plot(ox,type='l',main='Original Time Series',xlab='time',ylab='value')
if (par8=='') {
mytitle <- paste('Working Time Series (lambda=',par2,', d=',par3,', D=',par4,')',sep='')
mysub <- paste('(lambda=',par2,', d=',par3,', D=',par4,', CI=', par7, ', CI type=',par6,')',sep='')
} else {
mytitle <- paste('Working Time Series (base=',par8,', d=',par3,', D=',par4,')',sep='')
mysub <- paste('(base=',par8,', d=',par3,', D=',par4,', CI=', par7, ', CI type=',par6,')',sep='')
}
plot(x,type='l', main=mytitle,xlab='time',ylab='value')
par(op)
dev.off()
bitmap(file='pic1.png')
racf <- acf(x, par1, main='Autocorrelation', xlab='time lag', ylab='ACF', ci.type=par6, ci=par7, sub=mysub)
dev.off()
bitmap(file='pic2.png')
rpacf <- pacf(x,par1,main='Partial Autocorrelation',xlab='lags',ylab='PACF',sub=mysub)
dev.off()
(myacf <- c(racf$acf))
(mypacf <- c(rpacf$acf))
lengthx <- length(x)
sqrtn <- sqrt(lengthx)
load(file='createtable')
a<-table.start()
a<-table.row.start(a)
a<-table.element(a,'Autocorrelation Function',4,TRUE)
a<-table.row.end(a)
a<-table.row.start(a)
a<-table.element(a,'Time lag k',header=TRUE)
a<-table.element(a,hyperlink('basics.htm','ACF(k)','click here for more information about the Autocorrelation Function'),header=TRUE)
a<-table.element(a,'T-STAT',header=TRUE)
a<-table.element(a,'P-value',header=TRUE)
a<-table.row.end(a)
for (i in 2:(par1+1)) {
a<-table.row.start(a)
a<-table.element(a,i-1,header=TRUE)
a<-table.element(a,round(myacf[i],6))
mytstat <- myacf[i]*sqrtn
a<-table.element(a,round(mytstat,4))
a<-table.element(a,round(1-pt(abs(mytstat),lengthx),6))
a<-table.row.end(a)
}
a<-table.end(a)
table.save(a,file='mytable.tab')
a<-table.start()
a<-table.row.start(a)
a<-table.element(a,'Partial Autocorrelation Function',4,TRUE)
a<-table.row.end(a)
a<-table.row.start(a)
a<-table.element(a,'Time lag k',header=TRUE)
a<-table.element(a,hyperlink('basics.htm','PACF(k)','click here for more information about the Partial Autocorrelation Function'),header=TRUE)
a<-table.element(a,'T-STAT',header=TRUE)
a<-table.element(a,'P-value',header=TRUE)
a<-table.row.end(a)
for (i in 1:par1) {
a<-table.row.start(a)
a<-table.element(a,i,header=TRUE)
a<-table.element(a,round(mypacf[i],6))
mytstat <- mypacf[i]*sqrtn
a<-table.element(a,round(mytstat,4))
a<-table.element(a,round(1-pt(abs(mytstat),lengthx),6))
a<-table.row.end(a)
}
a<-table.end(a)
table.save(a,file='mytable1.tab')