Free Statistics

of Irreproducible Research!

Author's title

Author*Unverified author*
R Software Modulerwasp_autocorrelation.wasp
Title produced by software(Partial) Autocorrelation Function
Date of computationSun, 13 Mar 2016 08:21:23 +0000
Cite this page as followsStatistical Computations at FreeStatistics.org, Office for Research Development and Education, URL https://freestatistics.org/blog/index.php?v=date/2016/Mar/13/t145785732502mh1dldbqox72b.htm/, Retrieved Wed, 08 May 2024 16:34:56 +0000
Statistical Computations at FreeStatistics.org, Office for Research Development and Education, URL https://freestatistics.org/blog/index.php?pk=293987, Retrieved Wed, 08 May 2024 16:34:56 +0000
QR Codes:

Original text written by user:
IsPrivate?No (this computation is public)
User-defined keywords
Estimated Impact155
Family? (F = Feedback message, R = changed R code, M = changed R Module, P = changed Parameters, D = changed Data)
-       [(Partial) Autocorrelation Function] [] [2016-03-13 08:21:23] [f9cf779ce6533af8ecf1f6ee8a638c60] [Current]
Feedback Forum

Post a new message
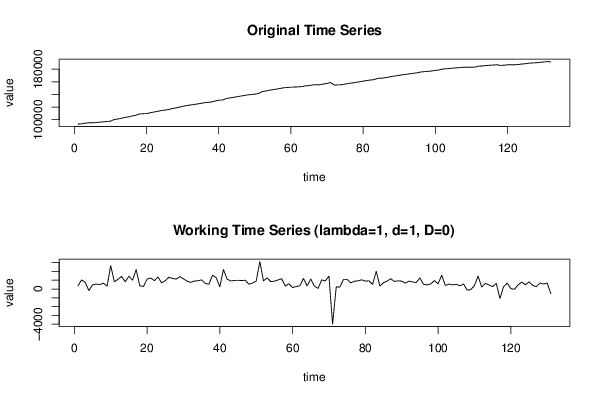
Dataseries X:
93166
93517
94547
95299
95121
95583
96138
96647
97311
97644
100299
101130
102239
103667
104494
105944
106956
109156
109528
109813
110939
112182
113137
114506
115197
116142
117478
118678
119808
121210
122372
123266
124020
124922
125863
126898
127522
128062
129630
130919
131175
133387
134512
135423
136395
137384
138344
139342
139885
140560
141457
144577
145505
146767
147602
148490
149516
150688
151012
151614
151779
152062
152432
153634
153989
155114
155448
155514
156552
157472
158928
154948
155178
155396
156479
157562
158255
159138
160067
161112
162009
162941
163463
165473
165805
166524
167426
168593
169452
170386
171281
171950
172842
173644
174380
175639
176169
176642
177225
178180
178771
180337
180740
181299
181768
182304
182670
183241
183106
183039
183447
184915
185144
185787
186243
186518
187156
186083
186350
187010
187057
187019
187487
188280
188756
189574
189996
190251
190925
191499
192172
191639


Summary of computational transaction
Raw Inputview raw input (R code)
Raw Outputview raw output of R engine
Computing time1 seconds
R Server'Herman Ole Andreas Wold' @ wold.wessa.net

\begin{tabular}{lllllllll}
\hline
Summary of computational transaction \tabularnewline
Raw Input & view raw input (R code)  \tabularnewline
Raw Output & view raw output of R engine  \tabularnewline
Computing time & 1 seconds \tabularnewline
R Server & 'Herman Ole Andreas Wold' @ wold.wessa.net \tabularnewline
\hline
\end{tabular}
%Source: https://freestatistics.org/blog/index.php?pk=293987&T=0

[TABLE]
[ROW][C]Summary of computational transaction[/C][/ROW]
[ROW][C]Raw Input[/C][C]view raw input (R code) [/C][/ROW]
[ROW][C]Raw Output[/C][C]view raw output of R engine [/C][/ROW]
[ROW][C]Computing time[/C][C]1 seconds[/C][/ROW]
[ROW][C]R Server[/C][C]'Herman Ole Andreas Wold' @ wold.wessa.net[/C][/ROW]
[/TABLE]
Source: https://freestatistics.org/blog/index.php?pk=293987&T=0

Globally Unique Identifier (entire table): ba.freestatistics.org/blog/index.php?pk=293987&T=0

As an alternative you can also use a QR Code:  

The GUIDs for individual cells are displayed in the table below:

Summary of computational transaction
Raw Inputview raw input (R code)
Raw Outputview raw output of R engine
Computing time1 seconds
R Server'Herman Ole Andreas Wold' @ wold.wessa.net


Autocorrelation Function
Time lag kACF(k)T-STATP-value
10.0727480.83260.203283
20.1424821.63080.052669
30.0713710.81690.20774
40.1528831.74980.041245
50.1672461.91420.028887
60.0607820.69570.243932
70.0986611.12920.130432
8-0.006832-0.07820.468898
90.0777040.88940.187719
100.1389981.59090.057021
110.1077591.23340.109826
120.1008691.15450.125198
130.1755972.00980.023253
140.0539290.61720.269072
150.0268080.30680.379731
16-0.044292-0.50690.306525
170.0067860.07770.469107
180.0689240.78890.215808
19-0.013056-0.14940.440722
20-0.198136-2.26780.01249
21-0.007206-0.08250.467197
220.0021710.02480.490108
230.0138080.1580.437333
240.0674860.77240.220631
250.0065210.07460.470308
260.0074570.08530.466059
270.0051130.05850.476711
280.0272670.31210.377737
29-0.00167-0.01910.492391
30-0.166919-1.91050.029129
310.0987581.13030.1302
32-0.020571-0.23540.407117
33-0.056451-0.64610.259669
340.004720.0540.478501
350.0256030.2930.384976
360.0925521.05930.145706
370.0260810.29850.382891
380.0267820.30650.379843
390.0211280.24180.404649
40-0.062266-0.71270.238659
410.0733850.83990.201239
420.0054850.06280.475018
43-0.046494-0.53210.297763
440.005060.05790.476951
45-0.035389-0.40510.34305
460.1037351.18730.118629
47-0.019633-0.22470.411279
48-0.001977-0.02260.490989

\begin{tabular}{lllllllll}
\hline
Autocorrelation Function \tabularnewline
Time lag k & ACF(k) & T-STAT & P-value \tabularnewline
1 & 0.072748 & 0.8326 & 0.203283 \tabularnewline
2 & 0.142482 & 1.6308 & 0.052669 \tabularnewline
3 & 0.071371 & 0.8169 & 0.20774 \tabularnewline
4 & 0.152883 & 1.7498 & 0.041245 \tabularnewline
5 & 0.167246 & 1.9142 & 0.028887 \tabularnewline
6 & 0.060782 & 0.6957 & 0.243932 \tabularnewline
7 & 0.098661 & 1.1292 & 0.130432 \tabularnewline
8 & -0.006832 & -0.0782 & 0.468898 \tabularnewline
9 & 0.077704 & 0.8894 & 0.187719 \tabularnewline
10 & 0.138998 & 1.5909 & 0.057021 \tabularnewline
11 & 0.107759 & 1.2334 & 0.109826 \tabularnewline
12 & 0.100869 & 1.1545 & 0.125198 \tabularnewline
13 & 0.175597 & 2.0098 & 0.023253 \tabularnewline
14 & 0.053929 & 0.6172 & 0.269072 \tabularnewline
15 & 0.026808 & 0.3068 & 0.379731 \tabularnewline
16 & -0.044292 & -0.5069 & 0.306525 \tabularnewline
17 & 0.006786 & 0.0777 & 0.469107 \tabularnewline
18 & 0.068924 & 0.7889 & 0.215808 \tabularnewline
19 & -0.013056 & -0.1494 & 0.440722 \tabularnewline
20 & -0.198136 & -2.2678 & 0.01249 \tabularnewline
21 & -0.007206 & -0.0825 & 0.467197 \tabularnewline
22 & 0.002171 & 0.0248 & 0.490108 \tabularnewline
23 & 0.013808 & 0.158 & 0.437333 \tabularnewline
24 & 0.067486 & 0.7724 & 0.220631 \tabularnewline
25 & 0.006521 & 0.0746 & 0.470308 \tabularnewline
26 & 0.007457 & 0.0853 & 0.466059 \tabularnewline
27 & 0.005113 & 0.0585 & 0.476711 \tabularnewline
28 & 0.027267 & 0.3121 & 0.377737 \tabularnewline
29 & -0.00167 & -0.0191 & 0.492391 \tabularnewline
30 & -0.166919 & -1.9105 & 0.029129 \tabularnewline
31 & 0.098758 & 1.1303 & 0.1302 \tabularnewline
32 & -0.020571 & -0.2354 & 0.407117 \tabularnewline
33 & -0.056451 & -0.6461 & 0.259669 \tabularnewline
34 & 0.00472 & 0.054 & 0.478501 \tabularnewline
35 & 0.025603 & 0.293 & 0.384976 \tabularnewline
36 & 0.092552 & 1.0593 & 0.145706 \tabularnewline
37 & 0.026081 & 0.2985 & 0.382891 \tabularnewline
38 & 0.026782 & 0.3065 & 0.379843 \tabularnewline
39 & 0.021128 & 0.2418 & 0.404649 \tabularnewline
40 & -0.062266 & -0.7127 & 0.238659 \tabularnewline
41 & 0.073385 & 0.8399 & 0.201239 \tabularnewline
42 & 0.005485 & 0.0628 & 0.475018 \tabularnewline
43 & -0.046494 & -0.5321 & 0.297763 \tabularnewline
44 & 0.00506 & 0.0579 & 0.476951 \tabularnewline
45 & -0.035389 & -0.4051 & 0.34305 \tabularnewline
46 & 0.103735 & 1.1873 & 0.118629 \tabularnewline
47 & -0.019633 & -0.2247 & 0.411279 \tabularnewline
48 & -0.001977 & -0.0226 & 0.490989 \tabularnewline
\hline
\end{tabular}
%Source: https://freestatistics.org/blog/index.php?pk=293987&T=1

[TABLE]
[ROW][C]Autocorrelation Function[/C][/ROW]
[ROW][C]Time lag k[/C][C]ACF(k)[/C][C]T-STAT[/C][C]P-value[/C][/ROW]
[ROW][C]1[/C][C]0.072748[/C][C]0.8326[/C][C]0.203283[/C][/ROW]
[ROW][C]2[/C][C]0.142482[/C][C]1.6308[/C][C]0.052669[/C][/ROW]
[ROW][C]3[/C][C]0.071371[/C][C]0.8169[/C][C]0.20774[/C][/ROW]
[ROW][C]4[/C][C]0.152883[/C][C]1.7498[/C][C]0.041245[/C][/ROW]
[ROW][C]5[/C][C]0.167246[/C][C]1.9142[/C][C]0.028887[/C][/ROW]
[ROW][C]6[/C][C]0.060782[/C][C]0.6957[/C][C]0.243932[/C][/ROW]
[ROW][C]7[/C][C]0.098661[/C][C]1.1292[/C][C]0.130432[/C][/ROW]
[ROW][C]8[/C][C]-0.006832[/C][C]-0.0782[/C][C]0.468898[/C][/ROW]
[ROW][C]9[/C][C]0.077704[/C][C]0.8894[/C][C]0.187719[/C][/ROW]
[ROW][C]10[/C][C]0.138998[/C][C]1.5909[/C][C]0.057021[/C][/ROW]
[ROW][C]11[/C][C]0.107759[/C][C]1.2334[/C][C]0.109826[/C][/ROW]
[ROW][C]12[/C][C]0.100869[/C][C]1.1545[/C][C]0.125198[/C][/ROW]
[ROW][C]13[/C][C]0.175597[/C][C]2.0098[/C][C]0.023253[/C][/ROW]
[ROW][C]14[/C][C]0.053929[/C][C]0.6172[/C][C]0.269072[/C][/ROW]
[ROW][C]15[/C][C]0.026808[/C][C]0.3068[/C][C]0.379731[/C][/ROW]
[ROW][C]16[/C][C]-0.044292[/C][C]-0.5069[/C][C]0.306525[/C][/ROW]
[ROW][C]17[/C][C]0.006786[/C][C]0.0777[/C][C]0.469107[/C][/ROW]
[ROW][C]18[/C][C]0.068924[/C][C]0.7889[/C][C]0.215808[/C][/ROW]
[ROW][C]19[/C][C]-0.013056[/C][C]-0.1494[/C][C]0.440722[/C][/ROW]
[ROW][C]20[/C][C]-0.198136[/C][C]-2.2678[/C][C]0.01249[/C][/ROW]
[ROW][C]21[/C][C]-0.007206[/C][C]-0.0825[/C][C]0.467197[/C][/ROW]
[ROW][C]22[/C][C]0.002171[/C][C]0.0248[/C][C]0.490108[/C][/ROW]
[ROW][C]23[/C][C]0.013808[/C][C]0.158[/C][C]0.437333[/C][/ROW]
[ROW][C]24[/C][C]0.067486[/C][C]0.7724[/C][C]0.220631[/C][/ROW]
[ROW][C]25[/C][C]0.006521[/C][C]0.0746[/C][C]0.470308[/C][/ROW]
[ROW][C]26[/C][C]0.007457[/C][C]0.0853[/C][C]0.466059[/C][/ROW]
[ROW][C]27[/C][C]0.005113[/C][C]0.0585[/C][C]0.476711[/C][/ROW]
[ROW][C]28[/C][C]0.027267[/C][C]0.3121[/C][C]0.377737[/C][/ROW]
[ROW][C]29[/C][C]-0.00167[/C][C]-0.0191[/C][C]0.492391[/C][/ROW]
[ROW][C]30[/C][C]-0.166919[/C][C]-1.9105[/C][C]0.029129[/C][/ROW]
[ROW][C]31[/C][C]0.098758[/C][C]1.1303[/C][C]0.1302[/C][/ROW]
[ROW][C]32[/C][C]-0.020571[/C][C]-0.2354[/C][C]0.407117[/C][/ROW]
[ROW][C]33[/C][C]-0.056451[/C][C]-0.6461[/C][C]0.259669[/C][/ROW]
[ROW][C]34[/C][C]0.00472[/C][C]0.054[/C][C]0.478501[/C][/ROW]
[ROW][C]35[/C][C]0.025603[/C][C]0.293[/C][C]0.384976[/C][/ROW]
[ROW][C]36[/C][C]0.092552[/C][C]1.0593[/C][C]0.145706[/C][/ROW]
[ROW][C]37[/C][C]0.026081[/C][C]0.2985[/C][C]0.382891[/C][/ROW]
[ROW][C]38[/C][C]0.026782[/C][C]0.3065[/C][C]0.379843[/C][/ROW]
[ROW][C]39[/C][C]0.021128[/C][C]0.2418[/C][C]0.404649[/C][/ROW]
[ROW][C]40[/C][C]-0.062266[/C][C]-0.7127[/C][C]0.238659[/C][/ROW]
[ROW][C]41[/C][C]0.073385[/C][C]0.8399[/C][C]0.201239[/C][/ROW]
[ROW][C]42[/C][C]0.005485[/C][C]0.0628[/C][C]0.475018[/C][/ROW]
[ROW][C]43[/C][C]-0.046494[/C][C]-0.5321[/C][C]0.297763[/C][/ROW]
[ROW][C]44[/C][C]0.00506[/C][C]0.0579[/C][C]0.476951[/C][/ROW]
[ROW][C]45[/C][C]-0.035389[/C][C]-0.4051[/C][C]0.34305[/C][/ROW]
[ROW][C]46[/C][C]0.103735[/C][C]1.1873[/C][C]0.118629[/C][/ROW]
[ROW][C]47[/C][C]-0.019633[/C][C]-0.2247[/C][C]0.411279[/C][/ROW]
[ROW][C]48[/C][C]-0.001977[/C][C]-0.0226[/C][C]0.490989[/C][/ROW]
[/TABLE]
Source: https://freestatistics.org/blog/index.php?pk=293987&T=1

Globally Unique Identifier (entire table): ba.freestatistics.org/blog/index.php?pk=293987&T=1

As an alternative you can also use a QR Code:  

The GUIDs for individual cells are displayed in the table below:

Autocorrelation Function
Time lag kACF(k)T-STATP-value
10.0727480.83260.203283
20.1424821.63080.052669
30.0713710.81690.20774
40.1528831.74980.041245
50.1672461.91420.028887
60.0607820.69570.243932
70.0986611.12920.130432
8-0.006832-0.07820.468898
90.0777040.88940.187719
100.1389981.59090.057021
110.1077591.23340.109826
120.1008691.15450.125198
130.1755972.00980.023253
140.0539290.61720.269072
150.0268080.30680.379731
16-0.044292-0.50690.306525
170.0067860.07770.469107
180.0689240.78890.215808
19-0.013056-0.14940.440722
20-0.198136-2.26780.01249
21-0.007206-0.08250.467197
220.0021710.02480.490108
230.0138080.1580.437333
240.0674860.77240.220631
250.0065210.07460.470308
260.0074570.08530.466059
270.0051130.05850.476711
280.0272670.31210.377737
29-0.00167-0.01910.492391
30-0.166919-1.91050.029129
310.0987581.13030.1302
32-0.020571-0.23540.407117
33-0.056451-0.64610.259669
340.004720.0540.478501
350.0256030.2930.384976
360.0925521.05930.145706
370.0260810.29850.382891
380.0267820.30650.379843
390.0211280.24180.404649
40-0.062266-0.71270.238659
410.0733850.83990.201239
420.0054850.06280.475018
43-0.046494-0.53210.297763
440.005060.05790.476951
45-0.035389-0.40510.34305
460.1037351.18730.118629
47-0.019633-0.22470.411279
48-0.001977-0.02260.490989


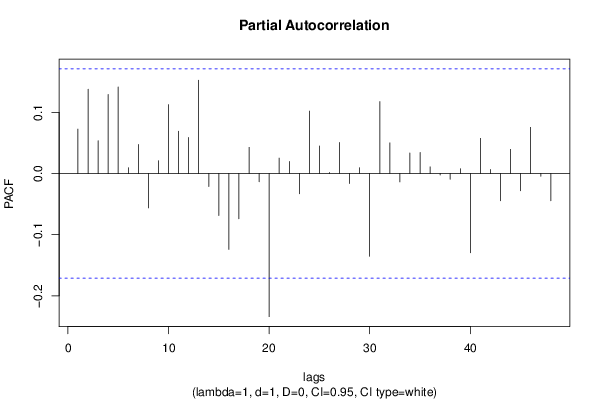
Partial Autocorrelation Function
Time lag kPACF(k)T-STATP-value
10.0727480.83260.203283
20.137921.57860.058424
30.0537020.61470.269925
40.1293541.48050.070568
50.141581.62050.053769
60.0095580.10940.456527
70.0475670.54440.293536
8-0.056182-0.6430.260664
90.0211250.24180.404663
100.1129121.29230.099259
110.0692130.79220.214845
120.0590920.67630.25001
130.15271.74770.041427
14-0.021161-0.24220.404504
15-0.068684-0.78610.216606
16-0.124131-1.42070.078884
17-0.07405-0.84750.19912
180.0428370.49030.312376
19-0.013295-0.15220.439646
20-0.234216-2.68070.004145
210.025290.28950.386344
220.0198030.22670.410521
23-0.032967-0.37730.353273
240.1022161.16990.12208
250.0451960.51730.302912
260.0017890.02050.49185
270.0508750.58230.280686
28-0.016161-0.1850.42677
290.0095890.10970.456388
30-0.135274-1.54830.061983
310.1178121.34840.089924
320.0502050.57460.283264
33-0.013578-0.15540.438372
340.033720.38590.350081
350.0344560.39440.346975
360.0109660.12550.450156
37-0.002368-0.02710.489209
38-0.009265-0.1060.457855
390.0077660.08890.464652
40-0.129679-1.48420.070073
410.0575860.65910.255492
420.0066460.07610.46974
43-0.04457-0.51010.305411
440.0395660.45290.3257
45-0.02802-0.32070.374474
460.0756160.86550.194182
47-0.004437-0.05080.479786
48-0.044624-0.51070.305195

\begin{tabular}{lllllllll}
\hline
Partial Autocorrelation Function \tabularnewline
Time lag k & PACF(k) & T-STAT & P-value \tabularnewline
1 & 0.072748 & 0.8326 & 0.203283 \tabularnewline
2 & 0.13792 & 1.5786 & 0.058424 \tabularnewline
3 & 0.053702 & 0.6147 & 0.269925 \tabularnewline
4 & 0.129354 & 1.4805 & 0.070568 \tabularnewline
5 & 0.14158 & 1.6205 & 0.053769 \tabularnewline
6 & 0.009558 & 0.1094 & 0.456527 \tabularnewline
7 & 0.047567 & 0.5444 & 0.293536 \tabularnewline
8 & -0.056182 & -0.643 & 0.260664 \tabularnewline
9 & 0.021125 & 0.2418 & 0.404663 \tabularnewline
10 & 0.112912 & 1.2923 & 0.099259 \tabularnewline
11 & 0.069213 & 0.7922 & 0.214845 \tabularnewline
12 & 0.059092 & 0.6763 & 0.25001 \tabularnewline
13 & 0.1527 & 1.7477 & 0.041427 \tabularnewline
14 & -0.021161 & -0.2422 & 0.404504 \tabularnewline
15 & -0.068684 & -0.7861 & 0.216606 \tabularnewline
16 & -0.124131 & -1.4207 & 0.078884 \tabularnewline
17 & -0.07405 & -0.8475 & 0.19912 \tabularnewline
18 & 0.042837 & 0.4903 & 0.312376 \tabularnewline
19 & -0.013295 & -0.1522 & 0.439646 \tabularnewline
20 & -0.234216 & -2.6807 & 0.004145 \tabularnewline
21 & 0.02529 & 0.2895 & 0.386344 \tabularnewline
22 & 0.019803 & 0.2267 & 0.410521 \tabularnewline
23 & -0.032967 & -0.3773 & 0.353273 \tabularnewline
24 & 0.102216 & 1.1699 & 0.12208 \tabularnewline
25 & 0.045196 & 0.5173 & 0.302912 \tabularnewline
26 & 0.001789 & 0.0205 & 0.49185 \tabularnewline
27 & 0.050875 & 0.5823 & 0.280686 \tabularnewline
28 & -0.016161 & -0.185 & 0.42677 \tabularnewline
29 & 0.009589 & 0.1097 & 0.456388 \tabularnewline
30 & -0.135274 & -1.5483 & 0.061983 \tabularnewline
31 & 0.117812 & 1.3484 & 0.089924 \tabularnewline
32 & 0.050205 & 0.5746 & 0.283264 \tabularnewline
33 & -0.013578 & -0.1554 & 0.438372 \tabularnewline
34 & 0.03372 & 0.3859 & 0.350081 \tabularnewline
35 & 0.034456 & 0.3944 & 0.346975 \tabularnewline
36 & 0.010966 & 0.1255 & 0.450156 \tabularnewline
37 & -0.002368 & -0.0271 & 0.489209 \tabularnewline
38 & -0.009265 & -0.106 & 0.457855 \tabularnewline
39 & 0.007766 & 0.0889 & 0.464652 \tabularnewline
40 & -0.129679 & -1.4842 & 0.070073 \tabularnewline
41 & 0.057586 & 0.6591 & 0.255492 \tabularnewline
42 & 0.006646 & 0.0761 & 0.46974 \tabularnewline
43 & -0.04457 & -0.5101 & 0.305411 \tabularnewline
44 & 0.039566 & 0.4529 & 0.3257 \tabularnewline
45 & -0.02802 & -0.3207 & 0.374474 \tabularnewline
46 & 0.075616 & 0.8655 & 0.194182 \tabularnewline
47 & -0.004437 & -0.0508 & 0.479786 \tabularnewline
48 & -0.044624 & -0.5107 & 0.305195 \tabularnewline
\hline
\end{tabular}
%Source: https://freestatistics.org/blog/index.php?pk=293987&T=2

[TABLE]
[ROW][C]Partial Autocorrelation Function[/C][/ROW]
[ROW][C]Time lag k[/C][C]PACF(k)[/C][C]T-STAT[/C][C]P-value[/C][/ROW]
[ROW][C]1[/C][C]0.072748[/C][C]0.8326[/C][C]0.203283[/C][/ROW]
[ROW][C]2[/C][C]0.13792[/C][C]1.5786[/C][C]0.058424[/C][/ROW]
[ROW][C]3[/C][C]0.053702[/C][C]0.6147[/C][C]0.269925[/C][/ROW]
[ROW][C]4[/C][C]0.129354[/C][C]1.4805[/C][C]0.070568[/C][/ROW]
[ROW][C]5[/C][C]0.14158[/C][C]1.6205[/C][C]0.053769[/C][/ROW]
[ROW][C]6[/C][C]0.009558[/C][C]0.1094[/C][C]0.456527[/C][/ROW]
[ROW][C]7[/C][C]0.047567[/C][C]0.5444[/C][C]0.293536[/C][/ROW]
[ROW][C]8[/C][C]-0.056182[/C][C]-0.643[/C][C]0.260664[/C][/ROW]
[ROW][C]9[/C][C]0.021125[/C][C]0.2418[/C][C]0.404663[/C][/ROW]
[ROW][C]10[/C][C]0.112912[/C][C]1.2923[/C][C]0.099259[/C][/ROW]
[ROW][C]11[/C][C]0.069213[/C][C]0.7922[/C][C]0.214845[/C][/ROW]
[ROW][C]12[/C][C]0.059092[/C][C]0.6763[/C][C]0.25001[/C][/ROW]
[ROW][C]13[/C][C]0.1527[/C][C]1.7477[/C][C]0.041427[/C][/ROW]
[ROW][C]14[/C][C]-0.021161[/C][C]-0.2422[/C][C]0.404504[/C][/ROW]
[ROW][C]15[/C][C]-0.068684[/C][C]-0.7861[/C][C]0.216606[/C][/ROW]
[ROW][C]16[/C][C]-0.124131[/C][C]-1.4207[/C][C]0.078884[/C][/ROW]
[ROW][C]17[/C][C]-0.07405[/C][C]-0.8475[/C][C]0.19912[/C][/ROW]
[ROW][C]18[/C][C]0.042837[/C][C]0.4903[/C][C]0.312376[/C][/ROW]
[ROW][C]19[/C][C]-0.013295[/C][C]-0.1522[/C][C]0.439646[/C][/ROW]
[ROW][C]20[/C][C]-0.234216[/C][C]-2.6807[/C][C]0.004145[/C][/ROW]
[ROW][C]21[/C][C]0.02529[/C][C]0.2895[/C][C]0.386344[/C][/ROW]
[ROW][C]22[/C][C]0.019803[/C][C]0.2267[/C][C]0.410521[/C][/ROW]
[ROW][C]23[/C][C]-0.032967[/C][C]-0.3773[/C][C]0.353273[/C][/ROW]
[ROW][C]24[/C][C]0.102216[/C][C]1.1699[/C][C]0.12208[/C][/ROW]
[ROW][C]25[/C][C]0.045196[/C][C]0.5173[/C][C]0.302912[/C][/ROW]
[ROW][C]26[/C][C]0.001789[/C][C]0.0205[/C][C]0.49185[/C][/ROW]
[ROW][C]27[/C][C]0.050875[/C][C]0.5823[/C][C]0.280686[/C][/ROW]
[ROW][C]28[/C][C]-0.016161[/C][C]-0.185[/C][C]0.42677[/C][/ROW]
[ROW][C]29[/C][C]0.009589[/C][C]0.1097[/C][C]0.456388[/C][/ROW]
[ROW][C]30[/C][C]-0.135274[/C][C]-1.5483[/C][C]0.061983[/C][/ROW]
[ROW][C]31[/C][C]0.117812[/C][C]1.3484[/C][C]0.089924[/C][/ROW]
[ROW][C]32[/C][C]0.050205[/C][C]0.5746[/C][C]0.283264[/C][/ROW]
[ROW][C]33[/C][C]-0.013578[/C][C]-0.1554[/C][C]0.438372[/C][/ROW]
[ROW][C]34[/C][C]0.03372[/C][C]0.3859[/C][C]0.350081[/C][/ROW]
[ROW][C]35[/C][C]0.034456[/C][C]0.3944[/C][C]0.346975[/C][/ROW]
[ROW][C]36[/C][C]0.010966[/C][C]0.1255[/C][C]0.450156[/C][/ROW]
[ROW][C]37[/C][C]-0.002368[/C][C]-0.0271[/C][C]0.489209[/C][/ROW]
[ROW][C]38[/C][C]-0.009265[/C][C]-0.106[/C][C]0.457855[/C][/ROW]
[ROW][C]39[/C][C]0.007766[/C][C]0.0889[/C][C]0.464652[/C][/ROW]
[ROW][C]40[/C][C]-0.129679[/C][C]-1.4842[/C][C]0.070073[/C][/ROW]
[ROW][C]41[/C][C]0.057586[/C][C]0.6591[/C][C]0.255492[/C][/ROW]
[ROW][C]42[/C][C]0.006646[/C][C]0.0761[/C][C]0.46974[/C][/ROW]
[ROW][C]43[/C][C]-0.04457[/C][C]-0.5101[/C][C]0.305411[/C][/ROW]
[ROW][C]44[/C][C]0.039566[/C][C]0.4529[/C][C]0.3257[/C][/ROW]
[ROW][C]45[/C][C]-0.02802[/C][C]-0.3207[/C][C]0.374474[/C][/ROW]
[ROW][C]46[/C][C]0.075616[/C][C]0.8655[/C][C]0.194182[/C][/ROW]
[ROW][C]47[/C][C]-0.004437[/C][C]-0.0508[/C][C]0.479786[/C][/ROW]
[ROW][C]48[/C][C]-0.044624[/C][C]-0.5107[/C][C]0.305195[/C][/ROW]
[/TABLE]
Source: https://freestatistics.org/blog/index.php?pk=293987&T=2

Globally Unique Identifier (entire table): ba.freestatistics.org/blog/index.php?pk=293987&T=2

As an alternative you can also use a QR Code:  

The GUIDs for individual cells are displayed in the table below:

Partial Autocorrelation Function
Time lag kPACF(k)T-STATP-value
10.0727480.83260.203283
20.137921.57860.058424
30.0537020.61470.269925
40.1293541.48050.070568
50.141581.62050.053769
60.0095580.10940.456527
70.0475670.54440.293536
8-0.056182-0.6430.260664
90.0211250.24180.404663
100.1129121.29230.099259
110.0692130.79220.214845
120.0590920.67630.25001
130.15271.74770.041427
14-0.021161-0.24220.404504
15-0.068684-0.78610.216606
16-0.124131-1.42070.078884
17-0.07405-0.84750.19912
180.0428370.49030.312376
19-0.013295-0.15220.439646
20-0.234216-2.68070.004145
210.025290.28950.386344
220.0198030.22670.410521
23-0.032967-0.37730.353273
240.1022161.16990.12208
250.0451960.51730.302912
260.0017890.02050.49185
270.0508750.58230.280686
28-0.016161-0.1850.42677
290.0095890.10970.456388
30-0.135274-1.54830.061983
310.1178121.34840.089924
320.0502050.57460.283264
33-0.013578-0.15540.438372
340.033720.38590.350081
350.0344560.39440.346975
360.0109660.12550.450156
37-0.002368-0.02710.489209
38-0.009265-0.1060.457855
390.0077660.08890.464652
40-0.129679-1.48420.070073
410.0575860.65910.255492
420.0066460.07610.46974
43-0.04457-0.51010.305411
440.0395660.45290.3257
45-0.02802-0.32070.374474
460.0756160.86550.194182
47-0.004437-0.05080.479786
48-0.044624-0.51070.305195


Parameters (Session):
par1 = 48 ; par2 = 1 ; par3 = 1 ; par4 = 0 ; par5 = 12 ; par6 = White Noise ; par7 = 0.95 ;
Parameters (R input):
par1 = 48 ; par2 = 1 ; par3 = 1 ; par4 = 0 ; par5 = 12 ; par6 = White Noise ; par7 = 0.95 ; par8 = ;
R code (references can be found in the software module):
if (par1 == 'Default') {
par1 = 10*log10(length(x))
} else {
par1 <- as.numeric(par1)
}
par2 <- as.numeric(par2)
par3 <- as.numeric(par3)
par4 <- as.numeric(par4)
par5 <- as.numeric(par5)
if (par6 == 'White Noise') par6 <- 'white' else par6 <- 'ma'
par7 <- as.numeric(par7)
if (par8 != '') par8 <- as.numeric(par8)
x <- na.omit(x)
ox <- x
if (par8 == '') {
if (par2 == 0) {
x <- log(x)
} else {
x <- (x ^ par2 - 1) / par2
}
} else {
x <- log(x,base=par8)
}
if (par3 > 0) x <- diff(x,lag=1,difference=par3)
if (par4 > 0) x <- diff(x,lag=par5,difference=par4)
bitmap(file='picts.png')
op <- par(mfrow=c(2,1))
plot(ox,type='l',main='Original Time Series',xlab='time',ylab='value')
if (par8=='') {
mytitle <- paste('Working Time Series (lambda=',par2,', d=',par3,', D=',par4,')',sep='')
mysub <- paste('(lambda=',par2,', d=',par3,', D=',par4,', CI=', par7, ', CI type=',par6,')',sep='')
} else {
mytitle <- paste('Working Time Series (base=',par8,', d=',par3,', D=',par4,')',sep='')
mysub <- paste('(base=',par8,', d=',par3,', D=',par4,', CI=', par7, ', CI type=',par6,')',sep='')
}
plot(x,type='l', main=mytitle,xlab='time',ylab='value')
par(op)
dev.off()
bitmap(file='pic1.png')
racf <- acf(x, par1, main='Autocorrelation', xlab='time lag', ylab='ACF', ci.type=par6, ci=par7, sub=mysub)
dev.off()
bitmap(file='pic2.png')
rpacf <- pacf(x,par1,main='Partial Autocorrelation',xlab='lags',ylab='PACF',sub=mysub)
dev.off()
(myacf <- c(racf$acf))
(mypacf <- c(rpacf$acf))
lengthx <- length(x)
sqrtn <- sqrt(lengthx)
load(file='createtable')
a<-table.start()
a<-table.row.start(a)
a<-table.element(a,'Autocorrelation Function',4,TRUE)
a<-table.row.end(a)
a<-table.row.start(a)
a<-table.element(a,'Time lag k',header=TRUE)
a<-table.element(a,hyperlink('basics.htm','ACF(k)','click here for more information about the Autocorrelation Function'),header=TRUE)
a<-table.element(a,'T-STAT',header=TRUE)
a<-table.element(a,'P-value',header=TRUE)
a<-table.row.end(a)
for (i in 2:(par1+1)) {
a<-table.row.start(a)
a<-table.element(a,i-1,header=TRUE)
a<-table.element(a,round(myacf[i],6))
mytstat <- myacf[i]*sqrtn
a<-table.element(a,round(mytstat,4))
a<-table.element(a,round(1-pt(abs(mytstat),lengthx),6))
a<-table.row.end(a)
}
a<-table.end(a)
table.save(a,file='mytable.tab')
a<-table.start()
a<-table.row.start(a)
a<-table.element(a,'Partial Autocorrelation Function',4,TRUE)
a<-table.row.end(a)
a<-table.row.start(a)
a<-table.element(a,'Time lag k',header=TRUE)
a<-table.element(a,hyperlink('basics.htm','PACF(k)','click here for more information about the Partial Autocorrelation Function'),header=TRUE)
a<-table.element(a,'T-STAT',header=TRUE)
a<-table.element(a,'P-value',header=TRUE)
a<-table.row.end(a)
for (i in 1:par1) {
a<-table.row.start(a)
a<-table.element(a,i,header=TRUE)
a<-table.element(a,round(mypacf[i],6))
mytstat <- mypacf[i]*sqrtn
a<-table.element(a,round(mytstat,4))
a<-table.element(a,round(1-pt(abs(mytstat),lengthx),6))
a<-table.row.end(a)
}
a<-table.end(a)
table.save(a,file='mytable1.tab')