Free Statistics

of Irreproducible Research!

Author's title

Author*Unverified author*
R Software Modulerwasp_autocorrelation.wasp
Title produced by software(Partial) Autocorrelation Function
Date of computationSun, 13 Mar 2016 11:00:13 +0000
Cite this page as followsStatistical Computations at FreeStatistics.org, Office for Research Development and Education, URL https://freestatistics.org/blog/index.php?v=date/2016/Mar/13/t14578668318aovx46j57a0rbg.htm/, Retrieved Wed, 08 May 2024 18:14:39 +0000
Statistical Computations at FreeStatistics.org, Office for Research Development and Education, URL https://freestatistics.org/blog/index.php?pk=293992, Retrieved Wed, 08 May 2024 18:14:39 +0000
QR Codes:

Original text written by user:
IsPrivate?No (this computation is public)
User-defined keywords
Estimated Impact159
Family? (F = Feedback message, R = changed R code, M = changed R Module, P = changed Parameters, D = changed Data)
-       [(Partial) Autocorrelation Function] [] [2016-03-13 11:00:13] [3cc5eb308fa11ebf92933824162ee6d9] [Current]
Feedback Forum

Post a new message
Dataseries X:
7,4361
7,4324
7,4367
7,4368
7,4456
7,4564
7,4597
7,4537
7,4639
7,4593
7,4438
7,4415
7,4317
7,4343
7,4281
7,4281
7,4305
7,425
7,4309
7,4361
7,4495
7,4393
7,4367
7,4343
7,4433
7,4463
7,4588
7,4586
7,4621
7,4581
7,4604
7,4557
7,4524
7,45
7,4446
7,4557
7,4534
7,4599
7,4592
7,4512
7,4514
7,4471
7,4442
7,4424
7,4426
7,4416
7,4498
7,4547
7,455
7,4573
7,4506
7,4398
7,435
7,4349
7,4457
7,459
7,4589
7,4555
7,458
7,4593
7,4625
7,4628
7,4522
7,4423
7,4501
7,4623
7,4617
7,4605


Summary of computational transaction
Raw Inputview raw input (R code)
Raw Outputview raw output of R engine
Computing time2 seconds
R Server'Sir Maurice George Kendall' @ kendall.wessa.net

\begin{tabular}{lllllllll}
\hline
Summary of computational transaction \tabularnewline
Raw Input & view raw input (R code)  \tabularnewline
Raw Output & view raw output of R engine  \tabularnewline
Computing time & 2 seconds \tabularnewline
R Server & 'Sir Maurice George Kendall' @ kendall.wessa.net \tabularnewline
\hline
\end{tabular}
%Source: https://freestatistics.org/blog/index.php?pk=293992&T=0

[TABLE]
[ROW][C]Summary of computational transaction[/C][/ROW]
[ROW][C]Raw Input[/C][C]view raw input (R code) [/C][/ROW]
[ROW][C]Raw Output[/C][C]view raw output of R engine [/C][/ROW]
[ROW][C]Computing time[/C][C]2 seconds[/C][/ROW]
[ROW][C]R Server[/C][C]'Sir Maurice George Kendall' @ kendall.wessa.net[/C][/ROW]
[/TABLE]
Source: https://freestatistics.org/blog/index.php?pk=293992&T=0

Globally Unique Identifier (entire table): ba.freestatistics.org/blog/index.php?pk=293992&T=0

As an alternative you can also use a QR Code:  

The GUIDs for individual cells are displayed in the table below:

Summary of computational transaction
Raw Inputview raw input (R code)
Raw Outputview raw output of R engine
Computing time2 seconds
R Server'Sir Maurice George Kendall' @ kendall.wessa.net


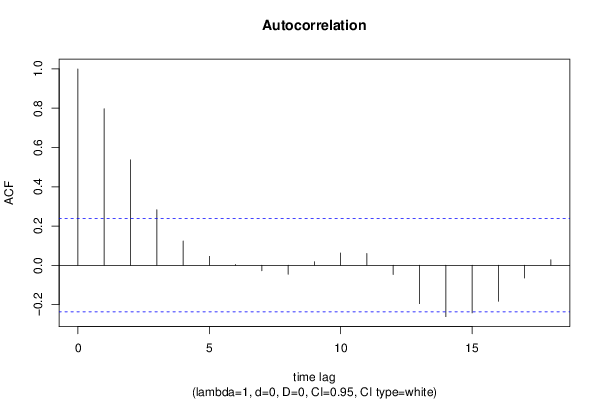
Autocorrelation Function
Time lag kACF(k)T-STATP-value
10.7971986.57390
20.5369284.42761.8e-05
30.2830662.33420.011273
40.1236561.01970.155744
50.0455620.37570.354149
60.0042470.0350.486083
7-0.027998-0.23090.40905
8-0.045839-0.3780.353306
90.0183680.15150.44003
100.0626940.5170.303422
110.0598780.49380.311531
12-0.047331-0.39030.348767
13-0.195352-1.61090.055916
14-0.261594-2.15720.017265
15-0.24249-1.99960.024769
16-0.18314-1.51020.067811
17-0.064943-0.53550.297015
180.0282540.2330.408235

\begin{tabular}{lllllllll}
\hline
Autocorrelation Function \tabularnewline
Time lag k & ACF(k) & T-STAT & P-value \tabularnewline
1 & 0.797198 & 6.5739 & 0 \tabularnewline
2 & 0.536928 & 4.4276 & 1.8e-05 \tabularnewline
3 & 0.283066 & 2.3342 & 0.011273 \tabularnewline
4 & 0.123656 & 1.0197 & 0.155744 \tabularnewline
5 & 0.045562 & 0.3757 & 0.354149 \tabularnewline
6 & 0.004247 & 0.035 & 0.486083 \tabularnewline
7 & -0.027998 & -0.2309 & 0.40905 \tabularnewline
8 & -0.045839 & -0.378 & 0.353306 \tabularnewline
9 & 0.018368 & 0.1515 & 0.44003 \tabularnewline
10 & 0.062694 & 0.517 & 0.303422 \tabularnewline
11 & 0.059878 & 0.4938 & 0.311531 \tabularnewline
12 & -0.047331 & -0.3903 & 0.348767 \tabularnewline
13 & -0.195352 & -1.6109 & 0.055916 \tabularnewline
14 & -0.261594 & -2.1572 & 0.017265 \tabularnewline
15 & -0.24249 & -1.9996 & 0.024769 \tabularnewline
16 & -0.18314 & -1.5102 & 0.067811 \tabularnewline
17 & -0.064943 & -0.5355 & 0.297015 \tabularnewline
18 & 0.028254 & 0.233 & 0.408235 \tabularnewline
\hline
\end{tabular}
%Source: https://freestatistics.org/blog/index.php?pk=293992&T=1

[TABLE]
[ROW][C]Autocorrelation Function[/C][/ROW]
[ROW][C]Time lag k[/C][C]ACF(k)[/C][C]T-STAT[/C][C]P-value[/C][/ROW]
[ROW][C]1[/C][C]0.797198[/C][C]6.5739[/C][C]0[/C][/ROW]
[ROW][C]2[/C][C]0.536928[/C][C]4.4276[/C][C]1.8e-05[/C][/ROW]
[ROW][C]3[/C][C]0.283066[/C][C]2.3342[/C][C]0.011273[/C][/ROW]
[ROW][C]4[/C][C]0.123656[/C][C]1.0197[/C][C]0.155744[/C][/ROW]
[ROW][C]5[/C][C]0.045562[/C][C]0.3757[/C][C]0.354149[/C][/ROW]
[ROW][C]6[/C][C]0.004247[/C][C]0.035[/C][C]0.486083[/C][/ROW]
[ROW][C]7[/C][C]-0.027998[/C][C]-0.2309[/C][C]0.40905[/C][/ROW]
[ROW][C]8[/C][C]-0.045839[/C][C]-0.378[/C][C]0.353306[/C][/ROW]
[ROW][C]9[/C][C]0.018368[/C][C]0.1515[/C][C]0.44003[/C][/ROW]
[ROW][C]10[/C][C]0.062694[/C][C]0.517[/C][C]0.303422[/C][/ROW]
[ROW][C]11[/C][C]0.059878[/C][C]0.4938[/C][C]0.311531[/C][/ROW]
[ROW][C]12[/C][C]-0.047331[/C][C]-0.3903[/C][C]0.348767[/C][/ROW]
[ROW][C]13[/C][C]-0.195352[/C][C]-1.6109[/C][C]0.055916[/C][/ROW]
[ROW][C]14[/C][C]-0.261594[/C][C]-2.1572[/C][C]0.017265[/C][/ROW]
[ROW][C]15[/C][C]-0.24249[/C][C]-1.9996[/C][C]0.024769[/C][/ROW]
[ROW][C]16[/C][C]-0.18314[/C][C]-1.5102[/C][C]0.067811[/C][/ROW]
[ROW][C]17[/C][C]-0.064943[/C][C]-0.5355[/C][C]0.297015[/C][/ROW]
[ROW][C]18[/C][C]0.028254[/C][C]0.233[/C][C]0.408235[/C][/ROW]
[/TABLE]
Source: https://freestatistics.org/blog/index.php?pk=293992&T=1

Globally Unique Identifier (entire table): ba.freestatistics.org/blog/index.php?pk=293992&T=1

As an alternative you can also use a QR Code:  

The GUIDs for individual cells are displayed in the table below:

Autocorrelation Function
Time lag kACF(k)T-STATP-value
10.7971986.57390
20.5369284.42761.8e-05
30.2830662.33420.011273
40.1236561.01970.155744
50.0455620.37570.354149
60.0042470.0350.486083
7-0.027998-0.23090.40905
8-0.045839-0.3780.353306
90.0183680.15150.44003
100.0626940.5170.303422
110.0598780.49380.311531
12-0.047331-0.39030.348767
13-0.195352-1.61090.055916
14-0.261594-2.15720.017265
15-0.24249-1.99960.024769
16-0.18314-1.51020.067811
17-0.064943-0.53550.297015
180.0282540.2330.408235


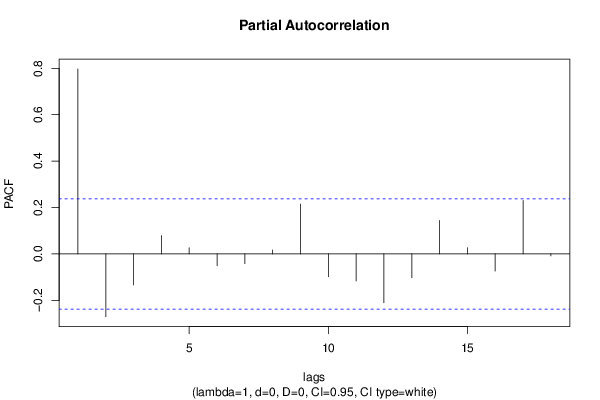
Partial Autocorrelation Function
Time lag kPACF(k)T-STATP-value
10.7971986.57390
2-0.270515-2.23070.014501
3-0.133535-1.10120.137356
40.0791440.65260.258096
50.0268310.22130.41278
6-0.051182-0.42210.337157
7-0.041941-0.34590.36526
80.0171820.14170.443874
90.2144791.76860.040719
10-0.098779-0.81450.209087
11-0.116625-0.96170.169801
12-0.210595-1.73660.043492
13-0.102558-0.84570.20034
140.1440221.18760.119555
150.0266860.22010.413243
16-0.074171-0.61160.271411
170.2301171.89760.030998
18-0.00847-0.06980.47226

\begin{tabular}{lllllllll}
\hline
Partial Autocorrelation Function \tabularnewline
Time lag k & PACF(k) & T-STAT & P-value \tabularnewline
1 & 0.797198 & 6.5739 & 0 \tabularnewline
2 & -0.270515 & -2.2307 & 0.014501 \tabularnewline
3 & -0.133535 & -1.1012 & 0.137356 \tabularnewline
4 & 0.079144 & 0.6526 & 0.258096 \tabularnewline
5 & 0.026831 & 0.2213 & 0.41278 \tabularnewline
6 & -0.051182 & -0.4221 & 0.337157 \tabularnewline
7 & -0.041941 & -0.3459 & 0.36526 \tabularnewline
8 & 0.017182 & 0.1417 & 0.443874 \tabularnewline
9 & 0.214479 & 1.7686 & 0.040719 \tabularnewline
10 & -0.098779 & -0.8145 & 0.209087 \tabularnewline
11 & -0.116625 & -0.9617 & 0.169801 \tabularnewline
12 & -0.210595 & -1.7366 & 0.043492 \tabularnewline
13 & -0.102558 & -0.8457 & 0.20034 \tabularnewline
14 & 0.144022 & 1.1876 & 0.119555 \tabularnewline
15 & 0.026686 & 0.2201 & 0.413243 \tabularnewline
16 & -0.074171 & -0.6116 & 0.271411 \tabularnewline
17 & 0.230117 & 1.8976 & 0.030998 \tabularnewline
18 & -0.00847 & -0.0698 & 0.47226 \tabularnewline
\hline
\end{tabular}
%Source: https://freestatistics.org/blog/index.php?pk=293992&T=2

[TABLE]
[ROW][C]Partial Autocorrelation Function[/C][/ROW]
[ROW][C]Time lag k[/C][C]PACF(k)[/C][C]T-STAT[/C][C]P-value[/C][/ROW]
[ROW][C]1[/C][C]0.797198[/C][C]6.5739[/C][C]0[/C][/ROW]
[ROW][C]2[/C][C]-0.270515[/C][C]-2.2307[/C][C]0.014501[/C][/ROW]
[ROW][C]3[/C][C]-0.133535[/C][C]-1.1012[/C][C]0.137356[/C][/ROW]
[ROW][C]4[/C][C]0.079144[/C][C]0.6526[/C][C]0.258096[/C][/ROW]
[ROW][C]5[/C][C]0.026831[/C][C]0.2213[/C][C]0.41278[/C][/ROW]
[ROW][C]6[/C][C]-0.051182[/C][C]-0.4221[/C][C]0.337157[/C][/ROW]
[ROW][C]7[/C][C]-0.041941[/C][C]-0.3459[/C][C]0.36526[/C][/ROW]
[ROW][C]8[/C][C]0.017182[/C][C]0.1417[/C][C]0.443874[/C][/ROW]
[ROW][C]9[/C][C]0.214479[/C][C]1.7686[/C][C]0.040719[/C][/ROW]
[ROW][C]10[/C][C]-0.098779[/C][C]-0.8145[/C][C]0.209087[/C][/ROW]
[ROW][C]11[/C][C]-0.116625[/C][C]-0.9617[/C][C]0.169801[/C][/ROW]
[ROW][C]12[/C][C]-0.210595[/C][C]-1.7366[/C][C]0.043492[/C][/ROW]
[ROW][C]13[/C][C]-0.102558[/C][C]-0.8457[/C][C]0.20034[/C][/ROW]
[ROW][C]14[/C][C]0.144022[/C][C]1.1876[/C][C]0.119555[/C][/ROW]
[ROW][C]15[/C][C]0.026686[/C][C]0.2201[/C][C]0.413243[/C][/ROW]
[ROW][C]16[/C][C]-0.074171[/C][C]-0.6116[/C][C]0.271411[/C][/ROW]
[ROW][C]17[/C][C]0.230117[/C][C]1.8976[/C][C]0.030998[/C][/ROW]
[ROW][C]18[/C][C]-0.00847[/C][C]-0.0698[/C][C]0.47226[/C][/ROW]
[/TABLE]
Source: https://freestatistics.org/blog/index.php?pk=293992&T=2

Globally Unique Identifier (entire table): ba.freestatistics.org/blog/index.php?pk=293992&T=2

As an alternative you can also use a QR Code:  

The GUIDs for individual cells are displayed in the table below:

Partial Autocorrelation Function
Time lag kPACF(k)T-STATP-value
10.7971986.57390
2-0.270515-2.23070.014501
3-0.133535-1.10120.137356
40.0791440.65260.258096
50.0268310.22130.41278
6-0.051182-0.42210.337157
7-0.041941-0.34590.36526
80.0171820.14170.443874
90.2144791.76860.040719
10-0.098779-0.81450.209087
11-0.116625-0.96170.169801
12-0.210595-1.73660.043492
13-0.102558-0.84570.20034
140.1440221.18760.119555
150.0266860.22010.413243
16-0.074171-0.61160.271411
170.2301171.89760.030998
18-0.00847-0.06980.47226


Parameters (Session):
par1 = Default ; par2 = 1 ; par3 = 0 ; par4 = 0 ; par5 = 12 ; par6 = White Noise ; par7 = 0.95 ;
Parameters (R input):
par1 = Default ; par2 = 1 ; par3 = 0 ; par4 = 0 ; par5 = 12 ; par6 = White Noise ; par7 = 0.95 ; par8 = ;
R code (references can be found in the software module):
if (par1 == 'Default') {
par1 = 10*log10(length(x))
} else {
par1 <- as.numeric(par1)
}
par2 <- as.numeric(par2)
par3 <- as.numeric(par3)
par4 <- as.numeric(par4)
par5 <- as.numeric(par5)
if (par6 == 'White Noise') par6 <- 'white' else par6 <- 'ma'
par7 <- as.numeric(par7)
if (par8 != '') par8 <- as.numeric(par8)
x <- na.omit(x)
ox <- x
if (par8 == '') {
if (par2 == 0) {
x <- log(x)
} else {
x <- (x ^ par2 - 1) / par2
}
} else {
x <- log(x,base=par8)
}
if (par3 > 0) x <- diff(x,lag=1,difference=par3)
if (par4 > 0) x <- diff(x,lag=par5,difference=par4)
bitmap(file='picts.png')
op <- par(mfrow=c(2,1))
plot(ox,type='l',main='Original Time Series',xlab='time',ylab='value')
if (par8=='') {
mytitle <- paste('Working Time Series (lambda=',par2,', d=',par3,', D=',par4,')',sep='')
mysub <- paste('(lambda=',par2,', d=',par3,', D=',par4,', CI=', par7, ', CI type=',par6,')',sep='')
} else {
mytitle <- paste('Working Time Series (base=',par8,', d=',par3,', D=',par4,')',sep='')
mysub <- paste('(base=',par8,', d=',par3,', D=',par4,', CI=', par7, ', CI type=',par6,')',sep='')
}
plot(x,type='l', main=mytitle,xlab='time',ylab='value')
par(op)
dev.off()
bitmap(file='pic1.png')
racf <- acf(x, par1, main='Autocorrelation', xlab='time lag', ylab='ACF', ci.type=par6, ci=par7, sub=mysub)
dev.off()
bitmap(file='pic2.png')
rpacf <- pacf(x,par1,main='Partial Autocorrelation',xlab='lags',ylab='PACF',sub=mysub)
dev.off()
(myacf <- c(racf$acf))
(mypacf <- c(rpacf$acf))
lengthx <- length(x)
sqrtn <- sqrt(lengthx)
load(file='createtable')
a<-table.start()
a<-table.row.start(a)
a<-table.element(a,'Autocorrelation Function',4,TRUE)
a<-table.row.end(a)
a<-table.row.start(a)
a<-table.element(a,'Time lag k',header=TRUE)
a<-table.element(a,hyperlink('basics.htm','ACF(k)','click here for more information about the Autocorrelation Function'),header=TRUE)
a<-table.element(a,'T-STAT',header=TRUE)
a<-table.element(a,'P-value',header=TRUE)
a<-table.row.end(a)
for (i in 2:(par1+1)) {
a<-table.row.start(a)
a<-table.element(a,i-1,header=TRUE)
a<-table.element(a,round(myacf[i],6))
mytstat <- myacf[i]*sqrtn
a<-table.element(a,round(mytstat,4))
a<-table.element(a,round(1-pt(abs(mytstat),lengthx),6))
a<-table.row.end(a)
}
a<-table.end(a)
table.save(a,file='mytable.tab')
a<-table.start()
a<-table.row.start(a)
a<-table.element(a,'Partial Autocorrelation Function',4,TRUE)
a<-table.row.end(a)
a<-table.row.start(a)
a<-table.element(a,'Time lag k',header=TRUE)
a<-table.element(a,hyperlink('basics.htm','PACF(k)','click here for more information about the Partial Autocorrelation Function'),header=TRUE)
a<-table.element(a,'T-STAT',header=TRUE)
a<-table.element(a,'P-value',header=TRUE)
a<-table.row.end(a)
for (i in 1:par1) {
a<-table.row.start(a)
a<-table.element(a,i,header=TRUE)
a<-table.element(a,round(mypacf[i],6))
mytstat <- mypacf[i]*sqrtn
a<-table.element(a,round(mytstat,4))
a<-table.element(a,round(1-pt(abs(mytstat),lengthx),6))
a<-table.row.end(a)
}
a<-table.end(a)
table.save(a,file='mytable1.tab')