Free Statistics

of Irreproducible Research!

Author's title

Author*Unverified author*
R Software Modulerwasp_autocorrelation.wasp
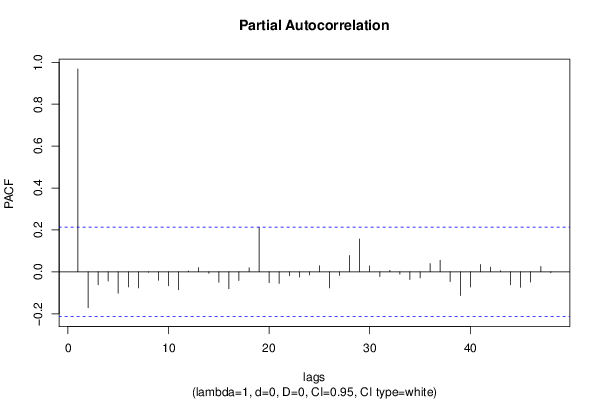
Title produced by software(Partial) Autocorrelation Function
Date of computationSun, 13 Mar 2016 11:03:31 +0000
Cite this page as followsStatistical Computations at FreeStatistics.org, Office for Research Development and Education, URL https://freestatistics.org/blog/index.php?v=date/2016/Mar/13/t1457867041hsjs3f870zkq4oy.htm/, Retrieved Thu, 09 May 2024 02:11:28 +0000
Statistical Computations at FreeStatistics.org, Office for Research Development and Education, URL https://freestatistics.org/blog/index.php?pk=293994, Retrieved Thu, 09 May 2024 02:11:28 +0000
QR Codes:

Original text written by user:
IsPrivate?No (this computation is public)
User-defined keywords
Estimated Impact166
Family? (F = Feedback message, R = changed R code, M = changed R Module, P = changed Parameters, D = changed Data)
-       [(Partial) Autocorrelation Function] [] [2016-03-13 11:03:31] [98ac3b2d1325a88ddcc6e107efd9e1d0] [Current]
Feedback Forum

Post a new message
Dataseries X:
84,51
84,54
84,27
84,47
84,25
84,33
84,29
84,53
84,01
84,18
84,08
83,44
83,61
83,89
83,4
82,96
82,76
83,35
87,78
88,99
88,92
88,91
89,79
90,54
93,15
92,79
93,21
95,35
100,91
103,69
104,04
104,16
104,71
105,18
104,92
104,83
104,9
105,05
104,6
103,21
102,52
101,09
101,19
102,34
102,62
102,47
101,82
101,86
101,54
101,98
101,23
100,4
99,94
99,94
100
98,8
99,07
99,46
99,18
98,47
97,12
96,91
96,09
97,17
96,8
97,13
99,9
100,56
100,84
99,81
100,44
100,07
101,32
103,98
104,81
106,23
106,48
107,59
107,16
107,54
107,1
106,38
106,64
106,13


Summary of computational transaction
Raw Inputview raw input (R code)
Raw Outputview raw output of R engine
Computing time1 seconds
R Server'Gwilym Jenkins' @ jenkins.wessa.net

\begin{tabular}{lllllllll}
\hline
Summary of computational transaction \tabularnewline
Raw Input & view raw input (R code)  \tabularnewline
Raw Output & view raw output of R engine  \tabularnewline
Computing time & 1 seconds \tabularnewline
R Server & 'Gwilym Jenkins' @ jenkins.wessa.net \tabularnewline
\hline
\end{tabular}
%Source: https://freestatistics.org/blog/index.php?pk=293994&T=0

[TABLE]
[ROW][C]Summary of computational transaction[/C][/ROW]
[ROW][C]Raw Input[/C][C]view raw input (R code) [/C][/ROW]
[ROW][C]Raw Output[/C][C]view raw output of R engine [/C][/ROW]
[ROW][C]Computing time[/C][C]1 seconds[/C][/ROW]
[ROW][C]R Server[/C][C]'Gwilym Jenkins' @ jenkins.wessa.net[/C][/ROW]
[/TABLE]
Source: https://freestatistics.org/blog/index.php?pk=293994&T=0

Globally Unique Identifier (entire table): ba.freestatistics.org/blog/index.php?pk=293994&T=0

As an alternative you can also use a QR Code:  

The GUIDs for individual cells are displayed in the table below:

Summary of computational transaction
Raw Inputview raw input (R code)
Raw Outputview raw output of R engine
Computing time1 seconds
R Server'Gwilym Jenkins' @ jenkins.wessa.net


Autocorrelation Function
Time lag kACF(k)T-STATP-value
10.9680728.87250
20.9263788.49040
30.8808238.07290
40.8332027.63640
50.7803877.15240
60.7236096.6320
70.6629946.07640
80.6033335.52960
90.5433524.97992e-06
100.4813654.41181.5e-05
110.4158843.81160.000131
120.3525213.23090.000881
130.2935672.69060.004302
140.2380362.18160.015965
150.1826911.67440.048886
160.1255091.15030.126641
170.0689480.63190.264577
180.0176640.16190.43589
19-0.016802-0.1540.438991
20-0.048267-0.44240.329678
21-0.079356-0.72730.23453
22-0.107946-0.98930.162669
23-0.132541-1.21480.11393
24-0.15383-1.40990.081134
25-0.170238-1.56030.061229
26-0.18879-1.73030.043625
27-0.205439-1.88290.031589
28-0.21337-1.95560.02692
29-0.20708-1.89790.030571
30-0.1963-1.79910.037796
31-0.185309-1.69840.046568
32-0.1722-1.57820.059135
33-0.155336-1.42370.079122
34-0.136521-1.25120.107161
35-0.117882-1.08040.141527
36-0.098732-0.90490.184054
37-0.078776-0.7220.236151
38-0.058835-0.53920.295576
39-0.043157-0.39550.346722
40-0.0335-0.3070.37979
41-0.025329-0.23210.408497
42-0.017473-0.16010.436576
43-0.009969-0.09140.46371
44-0.003253-0.02980.488143
45-0.000515-0.00470.498123
46-0.004601-0.04220.483234
47-0.013791-0.12640.449862
48-0.025374-0.23260.408336

\begin{tabular}{lllllllll}
\hline
Autocorrelation Function \tabularnewline
Time lag k & ACF(k) & T-STAT & P-value \tabularnewline
1 & 0.968072 & 8.8725 & 0 \tabularnewline
2 & 0.926378 & 8.4904 & 0 \tabularnewline
3 & 0.880823 & 8.0729 & 0 \tabularnewline
4 & 0.833202 & 7.6364 & 0 \tabularnewline
5 & 0.780387 & 7.1524 & 0 \tabularnewline
6 & 0.723609 & 6.632 & 0 \tabularnewline
7 & 0.662994 & 6.0764 & 0 \tabularnewline
8 & 0.603333 & 5.5296 & 0 \tabularnewline
9 & 0.543352 & 4.9799 & 2e-06 \tabularnewline
10 & 0.481365 & 4.4118 & 1.5e-05 \tabularnewline
11 & 0.415884 & 3.8116 & 0.000131 \tabularnewline
12 & 0.352521 & 3.2309 & 0.000881 \tabularnewline
13 & 0.293567 & 2.6906 & 0.004302 \tabularnewline
14 & 0.238036 & 2.1816 & 0.015965 \tabularnewline
15 & 0.182691 & 1.6744 & 0.048886 \tabularnewline
16 & 0.125509 & 1.1503 & 0.126641 \tabularnewline
17 & 0.068948 & 0.6319 & 0.264577 \tabularnewline
18 & 0.017664 & 0.1619 & 0.43589 \tabularnewline
19 & -0.016802 & -0.154 & 0.438991 \tabularnewline
20 & -0.048267 & -0.4424 & 0.329678 \tabularnewline
21 & -0.079356 & -0.7273 & 0.23453 \tabularnewline
22 & -0.107946 & -0.9893 & 0.162669 \tabularnewline
23 & -0.132541 & -1.2148 & 0.11393 \tabularnewline
24 & -0.15383 & -1.4099 & 0.081134 \tabularnewline
25 & -0.170238 & -1.5603 & 0.061229 \tabularnewline
26 & -0.18879 & -1.7303 & 0.043625 \tabularnewline
27 & -0.205439 & -1.8829 & 0.031589 \tabularnewline
28 & -0.21337 & -1.9556 & 0.02692 \tabularnewline
29 & -0.20708 & -1.8979 & 0.030571 \tabularnewline
30 & -0.1963 & -1.7991 & 0.037796 \tabularnewline
31 & -0.185309 & -1.6984 & 0.046568 \tabularnewline
32 & -0.1722 & -1.5782 & 0.059135 \tabularnewline
33 & -0.155336 & -1.4237 & 0.079122 \tabularnewline
34 & -0.136521 & -1.2512 & 0.107161 \tabularnewline
35 & -0.117882 & -1.0804 & 0.141527 \tabularnewline
36 & -0.098732 & -0.9049 & 0.184054 \tabularnewline
37 & -0.078776 & -0.722 & 0.236151 \tabularnewline
38 & -0.058835 & -0.5392 & 0.295576 \tabularnewline
39 & -0.043157 & -0.3955 & 0.346722 \tabularnewline
40 & -0.0335 & -0.307 & 0.37979 \tabularnewline
41 & -0.025329 & -0.2321 & 0.408497 \tabularnewline
42 & -0.017473 & -0.1601 & 0.436576 \tabularnewline
43 & -0.009969 & -0.0914 & 0.46371 \tabularnewline
44 & -0.003253 & -0.0298 & 0.488143 \tabularnewline
45 & -0.000515 & -0.0047 & 0.498123 \tabularnewline
46 & -0.004601 & -0.0422 & 0.483234 \tabularnewline
47 & -0.013791 & -0.1264 & 0.449862 \tabularnewline
48 & -0.025374 & -0.2326 & 0.408336 \tabularnewline
\hline
\end{tabular}
%Source: https://freestatistics.org/blog/index.php?pk=293994&T=1

[TABLE]
[ROW][C]Autocorrelation Function[/C][/ROW]
[ROW][C]Time lag k[/C][C]ACF(k)[/C][C]T-STAT[/C][C]P-value[/C][/ROW]
[ROW][C]1[/C][C]0.968072[/C][C]8.8725[/C][C]0[/C][/ROW]
[ROW][C]2[/C][C]0.926378[/C][C]8.4904[/C][C]0[/C][/ROW]
[ROW][C]3[/C][C]0.880823[/C][C]8.0729[/C][C]0[/C][/ROW]
[ROW][C]4[/C][C]0.833202[/C][C]7.6364[/C][C]0[/C][/ROW]
[ROW][C]5[/C][C]0.780387[/C][C]7.1524[/C][C]0[/C][/ROW]
[ROW][C]6[/C][C]0.723609[/C][C]6.632[/C][C]0[/C][/ROW]
[ROW][C]7[/C][C]0.662994[/C][C]6.0764[/C][C]0[/C][/ROW]
[ROW][C]8[/C][C]0.603333[/C][C]5.5296[/C][C]0[/C][/ROW]
[ROW][C]9[/C][C]0.543352[/C][C]4.9799[/C][C]2e-06[/C][/ROW]
[ROW][C]10[/C][C]0.481365[/C][C]4.4118[/C][C]1.5e-05[/C][/ROW]
[ROW][C]11[/C][C]0.415884[/C][C]3.8116[/C][C]0.000131[/C][/ROW]
[ROW][C]12[/C][C]0.352521[/C][C]3.2309[/C][C]0.000881[/C][/ROW]
[ROW][C]13[/C][C]0.293567[/C][C]2.6906[/C][C]0.004302[/C][/ROW]
[ROW][C]14[/C][C]0.238036[/C][C]2.1816[/C][C]0.015965[/C][/ROW]
[ROW][C]15[/C][C]0.182691[/C][C]1.6744[/C][C]0.048886[/C][/ROW]
[ROW][C]16[/C][C]0.125509[/C][C]1.1503[/C][C]0.126641[/C][/ROW]
[ROW][C]17[/C][C]0.068948[/C][C]0.6319[/C][C]0.264577[/C][/ROW]
[ROW][C]18[/C][C]0.017664[/C][C]0.1619[/C][C]0.43589[/C][/ROW]
[ROW][C]19[/C][C]-0.016802[/C][C]-0.154[/C][C]0.438991[/C][/ROW]
[ROW][C]20[/C][C]-0.048267[/C][C]-0.4424[/C][C]0.329678[/C][/ROW]
[ROW][C]21[/C][C]-0.079356[/C][C]-0.7273[/C][C]0.23453[/C][/ROW]
[ROW][C]22[/C][C]-0.107946[/C][C]-0.9893[/C][C]0.162669[/C][/ROW]
[ROW][C]23[/C][C]-0.132541[/C][C]-1.2148[/C][C]0.11393[/C][/ROW]
[ROW][C]24[/C][C]-0.15383[/C][C]-1.4099[/C][C]0.081134[/C][/ROW]
[ROW][C]25[/C][C]-0.170238[/C][C]-1.5603[/C][C]0.061229[/C][/ROW]
[ROW][C]26[/C][C]-0.18879[/C][C]-1.7303[/C][C]0.043625[/C][/ROW]
[ROW][C]27[/C][C]-0.205439[/C][C]-1.8829[/C][C]0.031589[/C][/ROW]
[ROW][C]28[/C][C]-0.21337[/C][C]-1.9556[/C][C]0.02692[/C][/ROW]
[ROW][C]29[/C][C]-0.20708[/C][C]-1.8979[/C][C]0.030571[/C][/ROW]
[ROW][C]30[/C][C]-0.1963[/C][C]-1.7991[/C][C]0.037796[/C][/ROW]
[ROW][C]31[/C][C]-0.185309[/C][C]-1.6984[/C][C]0.046568[/C][/ROW]
[ROW][C]32[/C][C]-0.1722[/C][C]-1.5782[/C][C]0.059135[/C][/ROW]
[ROW][C]33[/C][C]-0.155336[/C][C]-1.4237[/C][C]0.079122[/C][/ROW]
[ROW][C]34[/C][C]-0.136521[/C][C]-1.2512[/C][C]0.107161[/C][/ROW]
[ROW][C]35[/C][C]-0.117882[/C][C]-1.0804[/C][C]0.141527[/C][/ROW]
[ROW][C]36[/C][C]-0.098732[/C][C]-0.9049[/C][C]0.184054[/C][/ROW]
[ROW][C]37[/C][C]-0.078776[/C][C]-0.722[/C][C]0.236151[/C][/ROW]
[ROW][C]38[/C][C]-0.058835[/C][C]-0.5392[/C][C]0.295576[/C][/ROW]
[ROW][C]39[/C][C]-0.043157[/C][C]-0.3955[/C][C]0.346722[/C][/ROW]
[ROW][C]40[/C][C]-0.0335[/C][C]-0.307[/C][C]0.37979[/C][/ROW]
[ROW][C]41[/C][C]-0.025329[/C][C]-0.2321[/C][C]0.408497[/C][/ROW]
[ROW][C]42[/C][C]-0.017473[/C][C]-0.1601[/C][C]0.436576[/C][/ROW]
[ROW][C]43[/C][C]-0.009969[/C][C]-0.0914[/C][C]0.46371[/C][/ROW]
[ROW][C]44[/C][C]-0.003253[/C][C]-0.0298[/C][C]0.488143[/C][/ROW]
[ROW][C]45[/C][C]-0.000515[/C][C]-0.0047[/C][C]0.498123[/C][/ROW]
[ROW][C]46[/C][C]-0.004601[/C][C]-0.0422[/C][C]0.483234[/C][/ROW]
[ROW][C]47[/C][C]-0.013791[/C][C]-0.1264[/C][C]0.449862[/C][/ROW]
[ROW][C]48[/C][C]-0.025374[/C][C]-0.2326[/C][C]0.408336[/C][/ROW]
[/TABLE]
Source: https://freestatistics.org/blog/index.php?pk=293994&T=1

Globally Unique Identifier (entire table): ba.freestatistics.org/blog/index.php?pk=293994&T=1

As an alternative you can also use a QR Code:  

The GUIDs for individual cells are displayed in the table below:

Autocorrelation Function
Time lag kACF(k)T-STATP-value
10.9680728.87250
20.9263788.49040
30.8808238.07290
40.8332027.63640
50.7803877.15240
60.7236096.6320
70.6629946.07640
80.6033335.52960
90.5433524.97992e-06
100.4813654.41181.5e-05
110.4158843.81160.000131
120.3525213.23090.000881
130.2935672.69060.004302
140.2380362.18160.015965
150.1826911.67440.048886
160.1255091.15030.126641
170.0689480.63190.264577
180.0176640.16190.43589
19-0.016802-0.1540.438991
20-0.048267-0.44240.329678
21-0.079356-0.72730.23453
22-0.107946-0.98930.162669
23-0.132541-1.21480.11393
24-0.15383-1.40990.081134
25-0.170238-1.56030.061229
26-0.18879-1.73030.043625
27-0.205439-1.88290.031589
28-0.21337-1.95560.02692
29-0.20708-1.89790.030571
30-0.1963-1.79910.037796
31-0.185309-1.69840.046568
32-0.1722-1.57820.059135
33-0.155336-1.42370.079122
34-0.136521-1.25120.107161
35-0.117882-1.08040.141527
36-0.098732-0.90490.184054
37-0.078776-0.7220.236151
38-0.058835-0.53920.295576
39-0.043157-0.39550.346722
40-0.0335-0.3070.37979
41-0.025329-0.23210.408497
42-0.017473-0.16010.436576
43-0.009969-0.09140.46371
44-0.003253-0.02980.488143
45-0.000515-0.00470.498123
46-0.004601-0.04220.483234
47-0.013791-0.12640.449862
48-0.025374-0.23260.408336


Partial Autocorrelation Function
Time lag kPACF(k)T-STATP-value
10.9680728.87250
2-0.171635-1.57310.059732
3-0.061399-0.56270.287557
4-0.04352-0.39890.3455
5-0.102084-0.93560.176076
6-0.071674-0.65690.25652
7-0.076662-0.70260.242119
8-0.001354-0.01240.495065
9-0.039863-0.36530.357885
10-0.066541-0.60990.271802
11-0.085426-0.78290.217931
120.0036760.03370.486602
130.0201170.18440.42708
14-0.006767-0.0620.475347
15-0.04976-0.45610.324762
16-0.080823-0.74080.230453
17-0.041526-0.38060.352232
180.0192660.17660.430132
190.2125831.94840.027355
20-0.051714-0.4740.318376
21-0.055023-0.50430.307687
22-0.018907-0.17330.431422
23-0.024303-0.22270.41214
24-0.014444-0.13240.447498
250.0294350.26980.393997
26-0.076529-0.70140.242497
27-0.017449-0.15990.436661
280.0782080.71680.237747
290.1570261.43920.076909
300.0276760.25370.400192
31-0.022245-0.20390.41947
320.0071910.06590.473806
33-0.010994-0.10080.459991
34-0.037005-0.33920.367669
35-0.028757-0.26360.39638
360.0391720.3590.36024
370.0550190.50430.307702
38-0.045774-0.41950.337951
39-0.112849-1.03430.151987
40-0.072731-0.66660.25343
410.0349670.32050.374702
420.0223290.20460.419172
430.0051070.04680.48139
44-0.061739-0.56590.286502
45-0.073202-0.67090.252061
46-0.048306-0.44270.32955
470.0250930.230.409331
48-0.004549-0.04170.483422

\begin{tabular}{lllllllll}
\hline
Partial Autocorrelation Function \tabularnewline
Time lag k & PACF(k) & T-STAT & P-value \tabularnewline
1 & 0.968072 & 8.8725 & 0 \tabularnewline
2 & -0.171635 & -1.5731 & 0.059732 \tabularnewline
3 & -0.061399 & -0.5627 & 0.287557 \tabularnewline
4 & -0.04352 & -0.3989 & 0.3455 \tabularnewline
5 & -0.102084 & -0.9356 & 0.176076 \tabularnewline
6 & -0.071674 & -0.6569 & 0.25652 \tabularnewline
7 & -0.076662 & -0.7026 & 0.242119 \tabularnewline
8 & -0.001354 & -0.0124 & 0.495065 \tabularnewline
9 & -0.039863 & -0.3653 & 0.357885 \tabularnewline
10 & -0.066541 & -0.6099 & 0.271802 \tabularnewline
11 & -0.085426 & -0.7829 & 0.217931 \tabularnewline
12 & 0.003676 & 0.0337 & 0.486602 \tabularnewline
13 & 0.020117 & 0.1844 & 0.42708 \tabularnewline
14 & -0.006767 & -0.062 & 0.475347 \tabularnewline
15 & -0.04976 & -0.4561 & 0.324762 \tabularnewline
16 & -0.080823 & -0.7408 & 0.230453 \tabularnewline
17 & -0.041526 & -0.3806 & 0.352232 \tabularnewline
18 & 0.019266 & 0.1766 & 0.430132 \tabularnewline
19 & 0.212583 & 1.9484 & 0.027355 \tabularnewline
20 & -0.051714 & -0.474 & 0.318376 \tabularnewline
21 & -0.055023 & -0.5043 & 0.307687 \tabularnewline
22 & -0.018907 & -0.1733 & 0.431422 \tabularnewline
23 & -0.024303 & -0.2227 & 0.41214 \tabularnewline
24 & -0.014444 & -0.1324 & 0.447498 \tabularnewline
25 & 0.029435 & 0.2698 & 0.393997 \tabularnewline
26 & -0.076529 & -0.7014 & 0.242497 \tabularnewline
27 & -0.017449 & -0.1599 & 0.436661 \tabularnewline
28 & 0.078208 & 0.7168 & 0.237747 \tabularnewline
29 & 0.157026 & 1.4392 & 0.076909 \tabularnewline
30 & 0.027676 & 0.2537 & 0.400192 \tabularnewline
31 & -0.022245 & -0.2039 & 0.41947 \tabularnewline
32 & 0.007191 & 0.0659 & 0.473806 \tabularnewline
33 & -0.010994 & -0.1008 & 0.459991 \tabularnewline
34 & -0.037005 & -0.3392 & 0.367669 \tabularnewline
35 & -0.028757 & -0.2636 & 0.39638 \tabularnewline
36 & 0.039172 & 0.359 & 0.36024 \tabularnewline
37 & 0.055019 & 0.5043 & 0.307702 \tabularnewline
38 & -0.045774 & -0.4195 & 0.337951 \tabularnewline
39 & -0.112849 & -1.0343 & 0.151987 \tabularnewline
40 & -0.072731 & -0.6666 & 0.25343 \tabularnewline
41 & 0.034967 & 0.3205 & 0.374702 \tabularnewline
42 & 0.022329 & 0.2046 & 0.419172 \tabularnewline
43 & 0.005107 & 0.0468 & 0.48139 \tabularnewline
44 & -0.061739 & -0.5659 & 0.286502 \tabularnewline
45 & -0.073202 & -0.6709 & 0.252061 \tabularnewline
46 & -0.048306 & -0.4427 & 0.32955 \tabularnewline
47 & 0.025093 & 0.23 & 0.409331 \tabularnewline
48 & -0.004549 & -0.0417 & 0.483422 \tabularnewline
\hline
\end{tabular}
%Source: https://freestatistics.org/blog/index.php?pk=293994&T=2

[TABLE]
[ROW][C]Partial Autocorrelation Function[/C][/ROW]
[ROW][C]Time lag k[/C][C]PACF(k)[/C][C]T-STAT[/C][C]P-value[/C][/ROW]
[ROW][C]1[/C][C]0.968072[/C][C]8.8725[/C][C]0[/C][/ROW]
[ROW][C]2[/C][C]-0.171635[/C][C]-1.5731[/C][C]0.059732[/C][/ROW]
[ROW][C]3[/C][C]-0.061399[/C][C]-0.5627[/C][C]0.287557[/C][/ROW]
[ROW][C]4[/C][C]-0.04352[/C][C]-0.3989[/C][C]0.3455[/C][/ROW]
[ROW][C]5[/C][C]-0.102084[/C][C]-0.9356[/C][C]0.176076[/C][/ROW]
[ROW][C]6[/C][C]-0.071674[/C][C]-0.6569[/C][C]0.25652[/C][/ROW]
[ROW][C]7[/C][C]-0.076662[/C][C]-0.7026[/C][C]0.242119[/C][/ROW]
[ROW][C]8[/C][C]-0.001354[/C][C]-0.0124[/C][C]0.495065[/C][/ROW]
[ROW][C]9[/C][C]-0.039863[/C][C]-0.3653[/C][C]0.357885[/C][/ROW]
[ROW][C]10[/C][C]-0.066541[/C][C]-0.6099[/C][C]0.271802[/C][/ROW]
[ROW][C]11[/C][C]-0.085426[/C][C]-0.7829[/C][C]0.217931[/C][/ROW]
[ROW][C]12[/C][C]0.003676[/C][C]0.0337[/C][C]0.486602[/C][/ROW]
[ROW][C]13[/C][C]0.020117[/C][C]0.1844[/C][C]0.42708[/C][/ROW]
[ROW][C]14[/C][C]-0.006767[/C][C]-0.062[/C][C]0.475347[/C][/ROW]
[ROW][C]15[/C][C]-0.04976[/C][C]-0.4561[/C][C]0.324762[/C][/ROW]
[ROW][C]16[/C][C]-0.080823[/C][C]-0.7408[/C][C]0.230453[/C][/ROW]
[ROW][C]17[/C][C]-0.041526[/C][C]-0.3806[/C][C]0.352232[/C][/ROW]
[ROW][C]18[/C][C]0.019266[/C][C]0.1766[/C][C]0.430132[/C][/ROW]
[ROW][C]19[/C][C]0.212583[/C][C]1.9484[/C][C]0.027355[/C][/ROW]
[ROW][C]20[/C][C]-0.051714[/C][C]-0.474[/C][C]0.318376[/C][/ROW]
[ROW][C]21[/C][C]-0.055023[/C][C]-0.5043[/C][C]0.307687[/C][/ROW]
[ROW][C]22[/C][C]-0.018907[/C][C]-0.1733[/C][C]0.431422[/C][/ROW]
[ROW][C]23[/C][C]-0.024303[/C][C]-0.2227[/C][C]0.41214[/C][/ROW]
[ROW][C]24[/C][C]-0.014444[/C][C]-0.1324[/C][C]0.447498[/C][/ROW]
[ROW][C]25[/C][C]0.029435[/C][C]0.2698[/C][C]0.393997[/C][/ROW]
[ROW][C]26[/C][C]-0.076529[/C][C]-0.7014[/C][C]0.242497[/C][/ROW]
[ROW][C]27[/C][C]-0.017449[/C][C]-0.1599[/C][C]0.436661[/C][/ROW]
[ROW][C]28[/C][C]0.078208[/C][C]0.7168[/C][C]0.237747[/C][/ROW]
[ROW][C]29[/C][C]0.157026[/C][C]1.4392[/C][C]0.076909[/C][/ROW]
[ROW][C]30[/C][C]0.027676[/C][C]0.2537[/C][C]0.400192[/C][/ROW]
[ROW][C]31[/C][C]-0.022245[/C][C]-0.2039[/C][C]0.41947[/C][/ROW]
[ROW][C]32[/C][C]0.007191[/C][C]0.0659[/C][C]0.473806[/C][/ROW]
[ROW][C]33[/C][C]-0.010994[/C][C]-0.1008[/C][C]0.459991[/C][/ROW]
[ROW][C]34[/C][C]-0.037005[/C][C]-0.3392[/C][C]0.367669[/C][/ROW]
[ROW][C]35[/C][C]-0.028757[/C][C]-0.2636[/C][C]0.39638[/C][/ROW]
[ROW][C]36[/C][C]0.039172[/C][C]0.359[/C][C]0.36024[/C][/ROW]
[ROW][C]37[/C][C]0.055019[/C][C]0.5043[/C][C]0.307702[/C][/ROW]
[ROW][C]38[/C][C]-0.045774[/C][C]-0.4195[/C][C]0.337951[/C][/ROW]
[ROW][C]39[/C][C]-0.112849[/C][C]-1.0343[/C][C]0.151987[/C][/ROW]
[ROW][C]40[/C][C]-0.072731[/C][C]-0.6666[/C][C]0.25343[/C][/ROW]
[ROW][C]41[/C][C]0.034967[/C][C]0.3205[/C][C]0.374702[/C][/ROW]
[ROW][C]42[/C][C]0.022329[/C][C]0.2046[/C][C]0.419172[/C][/ROW]
[ROW][C]43[/C][C]0.005107[/C][C]0.0468[/C][C]0.48139[/C][/ROW]
[ROW][C]44[/C][C]-0.061739[/C][C]-0.5659[/C][C]0.286502[/C][/ROW]
[ROW][C]45[/C][C]-0.073202[/C][C]-0.6709[/C][C]0.252061[/C][/ROW]
[ROW][C]46[/C][C]-0.048306[/C][C]-0.4427[/C][C]0.32955[/C][/ROW]
[ROW][C]47[/C][C]0.025093[/C][C]0.23[/C][C]0.409331[/C][/ROW]
[ROW][C]48[/C][C]-0.004549[/C][C]-0.0417[/C][C]0.483422[/C][/ROW]
[/TABLE]
Source: https://freestatistics.org/blog/index.php?pk=293994&T=2

Globally Unique Identifier (entire table): ba.freestatistics.org/blog/index.php?pk=293994&T=2

As an alternative you can also use a QR Code:  

The GUIDs for individual cells are displayed in the table below:

Partial Autocorrelation Function
Time lag kPACF(k)T-STATP-value
10.9680728.87250
2-0.171635-1.57310.059732
3-0.061399-0.56270.287557
4-0.04352-0.39890.3455
5-0.102084-0.93560.176076
6-0.071674-0.65690.25652
7-0.076662-0.70260.242119
8-0.001354-0.01240.495065
9-0.039863-0.36530.357885
10-0.066541-0.60990.271802
11-0.085426-0.78290.217931
120.0036760.03370.486602
130.0201170.18440.42708
14-0.006767-0.0620.475347
15-0.04976-0.45610.324762
16-0.080823-0.74080.230453
17-0.041526-0.38060.352232
180.0192660.17660.430132
190.2125831.94840.027355
20-0.051714-0.4740.318376
21-0.055023-0.50430.307687
22-0.018907-0.17330.431422
23-0.024303-0.22270.41214
24-0.014444-0.13240.447498
250.0294350.26980.393997
26-0.076529-0.70140.242497
27-0.017449-0.15990.436661
280.0782080.71680.237747
290.1570261.43920.076909
300.0276760.25370.400192
31-0.022245-0.20390.41947
320.0071910.06590.473806
33-0.010994-0.10080.459991
34-0.037005-0.33920.367669
35-0.028757-0.26360.39638
360.0391720.3590.36024
370.0550190.50430.307702
38-0.045774-0.41950.337951
39-0.112849-1.03430.151987
40-0.072731-0.66660.25343
410.0349670.32050.374702
420.0223290.20460.419172
430.0051070.04680.48139
44-0.061739-0.56590.286502
45-0.073202-0.67090.252061
46-0.048306-0.44270.32955
470.0250930.230.409331
48-0.004549-0.04170.483422


Parameters (Session):
par1 = 48 ; par2 = 1 ; par3 = 0 ; par4 = 0 ; par5 = 12 ; par6 = White Noise ; par7 = 0.95 ;
Parameters (R input):
par1 = 48 ; par2 = 1 ; par3 = 0 ; par4 = 0 ; par5 = 12 ; par6 = White Noise ; par7 = 0.95 ; par8 = ;
R code (references can be found in the software module):
if (par1 == 'Default') {
par1 = 10*log10(length(x))
} else {
par1 <- as.numeric(par1)
}
par2 <- as.numeric(par2)
par3 <- as.numeric(par3)
par4 <- as.numeric(par4)
par5 <- as.numeric(par5)
if (par6 == 'White Noise') par6 <- 'white' else par6 <- 'ma'
par7 <- as.numeric(par7)
if (par8 != '') par8 <- as.numeric(par8)
x <- na.omit(x)
ox <- x
if (par8 == '') {
if (par2 == 0) {
x <- log(x)
} else {
x <- (x ^ par2 - 1) / par2
}
} else {
x <- log(x,base=par8)
}
if (par3 > 0) x <- diff(x,lag=1,difference=par3)
if (par4 > 0) x <- diff(x,lag=par5,difference=par4)
bitmap(file='picts.png')
op <- par(mfrow=c(2,1))
plot(ox,type='l',main='Original Time Series',xlab='time',ylab='value')
if (par8=='') {
mytitle <- paste('Working Time Series (lambda=',par2,', d=',par3,', D=',par4,')',sep='')
mysub <- paste('(lambda=',par2,', d=',par3,', D=',par4,', CI=', par7, ', CI type=',par6,')',sep='')
} else {
mytitle <- paste('Working Time Series (base=',par8,', d=',par3,', D=',par4,')',sep='')
mysub <- paste('(base=',par8,', d=',par3,', D=',par4,', CI=', par7, ', CI type=',par6,')',sep='')
}
plot(x,type='l', main=mytitle,xlab='time',ylab='value')
par(op)
dev.off()
bitmap(file='pic1.png')
racf <- acf(x, par1, main='Autocorrelation', xlab='time lag', ylab='ACF', ci.type=par6, ci=par7, sub=mysub)
dev.off()
bitmap(file='pic2.png')
rpacf <- pacf(x,par1,main='Partial Autocorrelation',xlab='lags',ylab='PACF',sub=mysub)
dev.off()
(myacf <- c(racf$acf))
(mypacf <- c(rpacf$acf))
lengthx <- length(x)
sqrtn <- sqrt(lengthx)
load(file='createtable')
a<-table.start()
a<-table.row.start(a)
a<-table.element(a,'Autocorrelation Function',4,TRUE)
a<-table.row.end(a)
a<-table.row.start(a)
a<-table.element(a,'Time lag k',header=TRUE)
a<-table.element(a,hyperlink('basics.htm','ACF(k)','click here for more information about the Autocorrelation Function'),header=TRUE)
a<-table.element(a,'T-STAT',header=TRUE)
a<-table.element(a,'P-value',header=TRUE)
a<-table.row.end(a)
for (i in 2:(par1+1)) {
a<-table.row.start(a)
a<-table.element(a,i-1,header=TRUE)
a<-table.element(a,round(myacf[i],6))
mytstat <- myacf[i]*sqrtn
a<-table.element(a,round(mytstat,4))
a<-table.element(a,round(1-pt(abs(mytstat),lengthx),6))
a<-table.row.end(a)
}
a<-table.end(a)
table.save(a,file='mytable.tab')
a<-table.start()
a<-table.row.start(a)
a<-table.element(a,'Partial Autocorrelation Function',4,TRUE)
a<-table.row.end(a)
a<-table.row.start(a)
a<-table.element(a,'Time lag k',header=TRUE)
a<-table.element(a,hyperlink('basics.htm','PACF(k)','click here for more information about the Partial Autocorrelation Function'),header=TRUE)
a<-table.element(a,'T-STAT',header=TRUE)
a<-table.element(a,'P-value',header=TRUE)
a<-table.row.end(a)
for (i in 1:par1) {
a<-table.row.start(a)
a<-table.element(a,i,header=TRUE)
a<-table.element(a,round(mypacf[i],6))
mytstat <- mypacf[i]*sqrtn
a<-table.element(a,round(mytstat,4))
a<-table.element(a,round(1-pt(abs(mytstat),lengthx),6))
a<-table.row.end(a)
}
a<-table.end(a)
table.save(a,file='mytable1.tab')