Free Statistics

of Irreproducible Research!

Author's title

Author*Unverified author*
R Software Modulerwasp_autocorrelation.wasp
Title produced by software(Partial) Autocorrelation Function
Date of computationMon, 14 Mar 2016 17:15:42 +0000
Cite this page as followsStatistical Computations at FreeStatistics.org, Office for Research Development and Education, URL https://freestatistics.org/blog/index.php?v=date/2016/Mar/14/t1457975845l0h5lziqq15xw0j.htm/, Retrieved Sun, 28 Apr 2024 23:27:22 +0000
Statistical Computations at FreeStatistics.org, Office for Research Development and Education, URL https://freestatistics.org/blog/index.php?pk=294014, Retrieved Sun, 28 Apr 2024 23:27:22 +0000
QR Codes:

Original text written by user:
IsPrivate?No (this computation is public)
User-defined keywords
Estimated Impact92
Family? (F = Feedback message, R = changed R code, M = changed R Module, P = changed Parameters, D = changed Data)
-       [(Partial) Autocorrelation Function] [Uitvoer België] [2016-03-14 17:15:42] [30ac29e28bcab64021946a7872e1db5d] [Current]
Feedback Forum

Post a new message
Dataseries X:
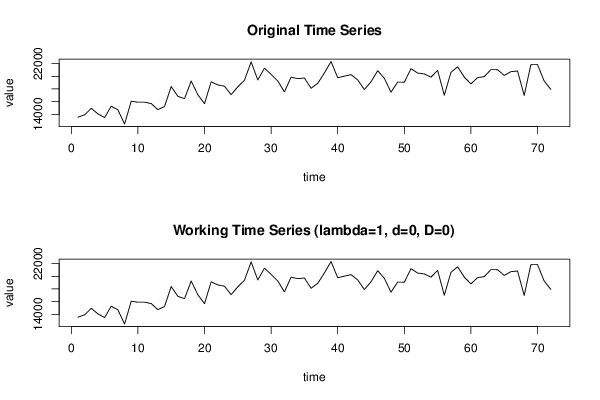
13566,7
13941,5
14964,1
14086
13505,1
15300,4
14725,2
12484,9
16082,6
15915,8
15916,1
15713
14746
15253,2
18384,3
16848,5
16485,5
19257,1
17093,4
15700,1
19124,3
18640,8
18439,2
17106,3
18347,7
19372,7
22263,8
19422,9
21268,6
20310
19256
17535,9
19857,4
19628,4
19727,5
18112,2
18889,3
20516,1
22317
19768,8
20015,8
20260,5
19434,3
17910
19134,4
20880,1
19680
17493,4
19087,8
19064,6
21191
20503,9
20364,1
19860,4
20924,1
17018,8
20607,4
21500,2
19868,3
18801,9
19787,5
19936,2
21047,6
21034,4
20132,8
20725,3
20827,8
16992,3
21818,2
21841,4
19252,2
17933,7


Summary of computational transaction
Raw Inputview raw input (R code)
Raw Outputview raw output of R engine
Computing time1 seconds
R Server'Sir Maurice George Kendall' @ kendall.wessa.net

\begin{tabular}{lllllllll}
\hline
Summary of computational transaction \tabularnewline
Raw Input & view raw input (R code)  \tabularnewline
Raw Output & view raw output of R engine  \tabularnewline
Computing time & 1 seconds \tabularnewline
R Server & 'Sir Maurice George Kendall' @ kendall.wessa.net \tabularnewline
\hline
\end{tabular}
%Source: https://freestatistics.org/blog/index.php?pk=294014&T=0

[TABLE]
[ROW][C]Summary of computational transaction[/C][/ROW]
[ROW][C]Raw Input[/C][C]view raw input (R code) [/C][/ROW]
[ROW][C]Raw Output[/C][C]view raw output of R engine [/C][/ROW]
[ROW][C]Computing time[/C][C]1 seconds[/C][/ROW]
[ROW][C]R Server[/C][C]'Sir Maurice George Kendall' @ kendall.wessa.net[/C][/ROW]
[/TABLE]
Source: https://freestatistics.org/blog/index.php?pk=294014&T=0

Globally Unique Identifier (entire table): ba.freestatistics.org/blog/index.php?pk=294014&T=0

As an alternative you can also use a QR Code:  

The GUIDs for individual cells are displayed in the table below:

Summary of computational transaction
Raw Inputview raw input (R code)
Raw Outputview raw output of R engine
Computing time1 seconds
R Server'Sir Maurice George Kendall' @ kendall.wessa.net


Autocorrelation Function
Time lag kACF(k)T-STATP-value
10.6929445.87980
20.5787254.91063e-06
30.6216395.27481e-06
40.6115615.18931e-06
50.5026824.26543e-05
60.5403454.5859e-06
70.4360263.69980.000209
80.4204533.56770.000323
90.3457772.9340.002243
100.2536782.15250.017354
110.3235192.74520.003816
120.4408023.74030.000183
130.1936011.64280.052396
140.0943650.80070.212966
150.1201111.01920.155765
160.13771.16840.123246
170.0469670.39850.34571
180.0783340.66470.254187
190.0176120.14940.440811
200.0086970.07380.470688
21-0.082455-0.69970.243198
22-0.098818-0.83850.202263
23-0.038758-0.32890.371604
240.0297540.25250.400699
25-0.097403-0.82650.205628
26-0.157316-1.33490.093062
27-0.105519-0.89540.186789
28-0.036399-0.30890.379163
29-0.100125-0.84960.199185
30-0.063749-0.54090.295115
31-0.057132-0.48480.314652
32-0.095727-0.81230.209656
33-0.156388-1.3270.094351
34-0.146595-1.24390.108786
35-0.126002-1.06920.144284
36-0.06438-0.54630.293281
37-0.137321-1.16520.123891
38-0.212882-1.80640.03752
39-0.142005-1.2050.116084
40-0.079663-0.6760.250616
41-0.162324-1.37740.086334
42-0.117878-1.00020.160274
43-0.119453-1.01360.157086
44-0.182511-1.54870.062924
45-0.223636-1.89760.030878
46-0.201907-1.71320.045486
47-0.212345-1.80180.037881
48-0.164117-1.39260.084017

\begin{tabular}{lllllllll}
\hline
Autocorrelation Function \tabularnewline
Time lag k & ACF(k) & T-STAT & P-value \tabularnewline
1 & 0.692944 & 5.8798 & 0 \tabularnewline
2 & 0.578725 & 4.9106 & 3e-06 \tabularnewline
3 & 0.621639 & 5.2748 & 1e-06 \tabularnewline
4 & 0.611561 & 5.1893 & 1e-06 \tabularnewline
5 & 0.502682 & 4.2654 & 3e-05 \tabularnewline
6 & 0.540345 & 4.585 & 9e-06 \tabularnewline
7 & 0.436026 & 3.6998 & 0.000209 \tabularnewline
8 & 0.420453 & 3.5677 & 0.000323 \tabularnewline
9 & 0.345777 & 2.934 & 0.002243 \tabularnewline
10 & 0.253678 & 2.1525 & 0.017354 \tabularnewline
11 & 0.323519 & 2.7452 & 0.003816 \tabularnewline
12 & 0.440802 & 3.7403 & 0.000183 \tabularnewline
13 & 0.193601 & 1.6428 & 0.052396 \tabularnewline
14 & 0.094365 & 0.8007 & 0.212966 \tabularnewline
15 & 0.120111 & 1.0192 & 0.155765 \tabularnewline
16 & 0.1377 & 1.1684 & 0.123246 \tabularnewline
17 & 0.046967 & 0.3985 & 0.34571 \tabularnewline
18 & 0.078334 & 0.6647 & 0.254187 \tabularnewline
19 & 0.017612 & 0.1494 & 0.440811 \tabularnewline
20 & 0.008697 & 0.0738 & 0.470688 \tabularnewline
21 & -0.082455 & -0.6997 & 0.243198 \tabularnewline
22 & -0.098818 & -0.8385 & 0.202263 \tabularnewline
23 & -0.038758 & -0.3289 & 0.371604 \tabularnewline
24 & 0.029754 & 0.2525 & 0.400699 \tabularnewline
25 & -0.097403 & -0.8265 & 0.205628 \tabularnewline
26 & -0.157316 & -1.3349 & 0.093062 \tabularnewline
27 & -0.105519 & -0.8954 & 0.186789 \tabularnewline
28 & -0.036399 & -0.3089 & 0.379163 \tabularnewline
29 & -0.100125 & -0.8496 & 0.199185 \tabularnewline
30 & -0.063749 & -0.5409 & 0.295115 \tabularnewline
31 & -0.057132 & -0.4848 & 0.314652 \tabularnewline
32 & -0.095727 & -0.8123 & 0.209656 \tabularnewline
33 & -0.156388 & -1.327 & 0.094351 \tabularnewline
34 & -0.146595 & -1.2439 & 0.108786 \tabularnewline
35 & -0.126002 & -1.0692 & 0.144284 \tabularnewline
36 & -0.06438 & -0.5463 & 0.293281 \tabularnewline
37 & -0.137321 & -1.1652 & 0.123891 \tabularnewline
38 & -0.212882 & -1.8064 & 0.03752 \tabularnewline
39 & -0.142005 & -1.205 & 0.116084 \tabularnewline
40 & -0.079663 & -0.676 & 0.250616 \tabularnewline
41 & -0.162324 & -1.3774 & 0.086334 \tabularnewline
42 & -0.117878 & -1.0002 & 0.160274 \tabularnewline
43 & -0.119453 & -1.0136 & 0.157086 \tabularnewline
44 & -0.182511 & -1.5487 & 0.062924 \tabularnewline
45 & -0.223636 & -1.8976 & 0.030878 \tabularnewline
46 & -0.201907 & -1.7132 & 0.045486 \tabularnewline
47 & -0.212345 & -1.8018 & 0.037881 \tabularnewline
48 & -0.164117 & -1.3926 & 0.084017 \tabularnewline
\hline
\end{tabular}
%Source: https://freestatistics.org/blog/index.php?pk=294014&T=1

[TABLE]
[ROW][C]Autocorrelation Function[/C][/ROW]
[ROW][C]Time lag k[/C][C]ACF(k)[/C][C]T-STAT[/C][C]P-value[/C][/ROW]
[ROW][C]1[/C][C]0.692944[/C][C]5.8798[/C][C]0[/C][/ROW]
[ROW][C]2[/C][C]0.578725[/C][C]4.9106[/C][C]3e-06[/C][/ROW]
[ROW][C]3[/C][C]0.621639[/C][C]5.2748[/C][C]1e-06[/C][/ROW]
[ROW][C]4[/C][C]0.611561[/C][C]5.1893[/C][C]1e-06[/C][/ROW]
[ROW][C]5[/C][C]0.502682[/C][C]4.2654[/C][C]3e-05[/C][/ROW]
[ROW][C]6[/C][C]0.540345[/C][C]4.585[/C][C]9e-06[/C][/ROW]
[ROW][C]7[/C][C]0.436026[/C][C]3.6998[/C][C]0.000209[/C][/ROW]
[ROW][C]8[/C][C]0.420453[/C][C]3.5677[/C][C]0.000323[/C][/ROW]
[ROW][C]9[/C][C]0.345777[/C][C]2.934[/C][C]0.002243[/C][/ROW]
[ROW][C]10[/C][C]0.253678[/C][C]2.1525[/C][C]0.017354[/C][/ROW]
[ROW][C]11[/C][C]0.323519[/C][C]2.7452[/C][C]0.003816[/C][/ROW]
[ROW][C]12[/C][C]0.440802[/C][C]3.7403[/C][C]0.000183[/C][/ROW]
[ROW][C]13[/C][C]0.193601[/C][C]1.6428[/C][C]0.052396[/C][/ROW]
[ROW][C]14[/C][C]0.094365[/C][C]0.8007[/C][C]0.212966[/C][/ROW]
[ROW][C]15[/C][C]0.120111[/C][C]1.0192[/C][C]0.155765[/C][/ROW]
[ROW][C]16[/C][C]0.1377[/C][C]1.1684[/C][C]0.123246[/C][/ROW]
[ROW][C]17[/C][C]0.046967[/C][C]0.3985[/C][C]0.34571[/C][/ROW]
[ROW][C]18[/C][C]0.078334[/C][C]0.6647[/C][C]0.254187[/C][/ROW]
[ROW][C]19[/C][C]0.017612[/C][C]0.1494[/C][C]0.440811[/C][/ROW]
[ROW][C]20[/C][C]0.008697[/C][C]0.0738[/C][C]0.470688[/C][/ROW]
[ROW][C]21[/C][C]-0.082455[/C][C]-0.6997[/C][C]0.243198[/C][/ROW]
[ROW][C]22[/C][C]-0.098818[/C][C]-0.8385[/C][C]0.202263[/C][/ROW]
[ROW][C]23[/C][C]-0.038758[/C][C]-0.3289[/C][C]0.371604[/C][/ROW]
[ROW][C]24[/C][C]0.029754[/C][C]0.2525[/C][C]0.400699[/C][/ROW]
[ROW][C]25[/C][C]-0.097403[/C][C]-0.8265[/C][C]0.205628[/C][/ROW]
[ROW][C]26[/C][C]-0.157316[/C][C]-1.3349[/C][C]0.093062[/C][/ROW]
[ROW][C]27[/C][C]-0.105519[/C][C]-0.8954[/C][C]0.186789[/C][/ROW]
[ROW][C]28[/C][C]-0.036399[/C][C]-0.3089[/C][C]0.379163[/C][/ROW]
[ROW][C]29[/C][C]-0.100125[/C][C]-0.8496[/C][C]0.199185[/C][/ROW]
[ROW][C]30[/C][C]-0.063749[/C][C]-0.5409[/C][C]0.295115[/C][/ROW]
[ROW][C]31[/C][C]-0.057132[/C][C]-0.4848[/C][C]0.314652[/C][/ROW]
[ROW][C]32[/C][C]-0.095727[/C][C]-0.8123[/C][C]0.209656[/C][/ROW]
[ROW][C]33[/C][C]-0.156388[/C][C]-1.327[/C][C]0.094351[/C][/ROW]
[ROW][C]34[/C][C]-0.146595[/C][C]-1.2439[/C][C]0.108786[/C][/ROW]
[ROW][C]35[/C][C]-0.126002[/C][C]-1.0692[/C][C]0.144284[/C][/ROW]
[ROW][C]36[/C][C]-0.06438[/C][C]-0.5463[/C][C]0.293281[/C][/ROW]
[ROW][C]37[/C][C]-0.137321[/C][C]-1.1652[/C][C]0.123891[/C][/ROW]
[ROW][C]38[/C][C]-0.212882[/C][C]-1.8064[/C][C]0.03752[/C][/ROW]
[ROW][C]39[/C][C]-0.142005[/C][C]-1.205[/C][C]0.116084[/C][/ROW]
[ROW][C]40[/C][C]-0.079663[/C][C]-0.676[/C][C]0.250616[/C][/ROW]
[ROW][C]41[/C][C]-0.162324[/C][C]-1.3774[/C][C]0.086334[/C][/ROW]
[ROW][C]42[/C][C]-0.117878[/C][C]-1.0002[/C][C]0.160274[/C][/ROW]
[ROW][C]43[/C][C]-0.119453[/C][C]-1.0136[/C][C]0.157086[/C][/ROW]
[ROW][C]44[/C][C]-0.182511[/C][C]-1.5487[/C][C]0.062924[/C][/ROW]
[ROW][C]45[/C][C]-0.223636[/C][C]-1.8976[/C][C]0.030878[/C][/ROW]
[ROW][C]46[/C][C]-0.201907[/C][C]-1.7132[/C][C]0.045486[/C][/ROW]
[ROW][C]47[/C][C]-0.212345[/C][C]-1.8018[/C][C]0.037881[/C][/ROW]
[ROW][C]48[/C][C]-0.164117[/C][C]-1.3926[/C][C]0.084017[/C][/ROW]
[/TABLE]
Source: https://freestatistics.org/blog/index.php?pk=294014&T=1

Globally Unique Identifier (entire table): ba.freestatistics.org/blog/index.php?pk=294014&T=1

As an alternative you can also use a QR Code:  

The GUIDs for individual cells are displayed in the table below:

Autocorrelation Function
Time lag kACF(k)T-STATP-value
10.6929445.87980
20.5787254.91063e-06
30.6216395.27481e-06
40.6115615.18931e-06
50.5026824.26543e-05
60.5403454.5859e-06
70.4360263.69980.000209
80.4204533.56770.000323
90.3457772.9340.002243
100.2536782.15250.017354
110.3235192.74520.003816
120.4408023.74030.000183
130.1936011.64280.052396
140.0943650.80070.212966
150.1201111.01920.155765
160.13771.16840.123246
170.0469670.39850.34571
180.0783340.66470.254187
190.0176120.14940.440811
200.0086970.07380.470688
21-0.082455-0.69970.243198
22-0.098818-0.83850.202263
23-0.038758-0.32890.371604
240.0297540.25250.400699
25-0.097403-0.82650.205628
26-0.157316-1.33490.093062
27-0.105519-0.89540.186789
28-0.036399-0.30890.379163
29-0.100125-0.84960.199185
30-0.063749-0.54090.295115
31-0.057132-0.48480.314652
32-0.095727-0.81230.209656
33-0.156388-1.3270.094351
34-0.146595-1.24390.108786
35-0.126002-1.06920.144284
36-0.06438-0.54630.293281
37-0.137321-1.16520.123891
38-0.212882-1.80640.03752
39-0.142005-1.2050.116084
40-0.079663-0.6760.250616
41-0.162324-1.37740.086334
42-0.117878-1.00020.160274
43-0.119453-1.01360.157086
44-0.182511-1.54870.062924
45-0.223636-1.89760.030878
46-0.201907-1.71320.045486
47-0.212345-1.80180.037881
48-0.164117-1.39260.084017


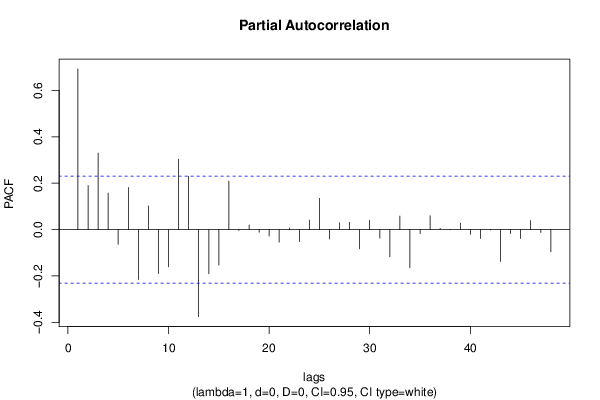
Partial Autocorrelation Function
Time lag kPACF(k)T-STATP-value
10.6929445.87980
20.1895891.60870.056028
30.3297852.79830.003293
40.1573321.3350.09304
5-0.063185-0.53610.296757
60.1812441.53790.064227
7-0.215115-1.82530.036051
80.1014780.86110.196028
9-0.189789-1.61040.055842
10-0.160245-1.35970.08908
110.3031412.57220.006084
120.2304011.9550.027232
13-0.375693-3.18790.001061
14-0.190744-1.61850.054962
15-0.15357-1.30310.098349
160.2088841.77240.040276
17-0.003481-0.02950.488259
180.0199340.16910.433077
19-0.011831-0.10040.460156
20-0.027612-0.23430.407711
21-0.054182-0.45980.323539
220.006640.05630.477614
23-0.052031-0.44150.330089
240.0407450.34570.365276
250.1347251.14320.128375
26-0.040581-0.34430.365797
270.0288950.24520.403507
280.0310590.26350.396443
29-0.082926-0.70360.241961
300.04020.34110.367009
31-0.037016-0.31410.377179
32-0.1176-0.99790.160843
330.0581960.49380.311471
34-0.164843-1.39870.083092
35-0.016975-0.1440.442936
360.0598630.5080.306519
370.004690.03980.484182
38-0.00106-0.0090.496423
390.0271910.23070.409093
40-0.020485-0.17380.431245
41-0.038671-0.32810.371883
42-0.001503-0.01280.49493
43-0.138112-1.17190.122547
44-0.017236-0.14630.442066
45-0.038537-0.3270.37231
460.0388840.32990.3712
47-0.01293-0.10970.45647
48-0.095419-0.80970.210402

\begin{tabular}{lllllllll}
\hline
Partial Autocorrelation Function \tabularnewline
Time lag k & PACF(k) & T-STAT & P-value \tabularnewline
1 & 0.692944 & 5.8798 & 0 \tabularnewline
2 & 0.189589 & 1.6087 & 0.056028 \tabularnewline
3 & 0.329785 & 2.7983 & 0.003293 \tabularnewline
4 & 0.157332 & 1.335 & 0.09304 \tabularnewline
5 & -0.063185 & -0.5361 & 0.296757 \tabularnewline
6 & 0.181244 & 1.5379 & 0.064227 \tabularnewline
7 & -0.215115 & -1.8253 & 0.036051 \tabularnewline
8 & 0.101478 & 0.8611 & 0.196028 \tabularnewline
9 & -0.189789 & -1.6104 & 0.055842 \tabularnewline
10 & -0.160245 & -1.3597 & 0.08908 \tabularnewline
11 & 0.303141 & 2.5722 & 0.006084 \tabularnewline
12 & 0.230401 & 1.955 & 0.027232 \tabularnewline
13 & -0.375693 & -3.1879 & 0.001061 \tabularnewline
14 & -0.190744 & -1.6185 & 0.054962 \tabularnewline
15 & -0.15357 & -1.3031 & 0.098349 \tabularnewline
16 & 0.208884 & 1.7724 & 0.040276 \tabularnewline
17 & -0.003481 & -0.0295 & 0.488259 \tabularnewline
18 & 0.019934 & 0.1691 & 0.433077 \tabularnewline
19 & -0.011831 & -0.1004 & 0.460156 \tabularnewline
20 & -0.027612 & -0.2343 & 0.407711 \tabularnewline
21 & -0.054182 & -0.4598 & 0.323539 \tabularnewline
22 & 0.00664 & 0.0563 & 0.477614 \tabularnewline
23 & -0.052031 & -0.4415 & 0.330089 \tabularnewline
24 & 0.040745 & 0.3457 & 0.365276 \tabularnewline
25 & 0.134725 & 1.1432 & 0.128375 \tabularnewline
26 & -0.040581 & -0.3443 & 0.365797 \tabularnewline
27 & 0.028895 & 0.2452 & 0.403507 \tabularnewline
28 & 0.031059 & 0.2635 & 0.396443 \tabularnewline
29 & -0.082926 & -0.7036 & 0.241961 \tabularnewline
30 & 0.0402 & 0.3411 & 0.367009 \tabularnewline
31 & -0.037016 & -0.3141 & 0.377179 \tabularnewline
32 & -0.1176 & -0.9979 & 0.160843 \tabularnewline
33 & 0.058196 & 0.4938 & 0.311471 \tabularnewline
34 & -0.164843 & -1.3987 & 0.083092 \tabularnewline
35 & -0.016975 & -0.144 & 0.442936 \tabularnewline
36 & 0.059863 & 0.508 & 0.306519 \tabularnewline
37 & 0.00469 & 0.0398 & 0.484182 \tabularnewline
38 & -0.00106 & -0.009 & 0.496423 \tabularnewline
39 & 0.027191 & 0.2307 & 0.409093 \tabularnewline
40 & -0.020485 & -0.1738 & 0.431245 \tabularnewline
41 & -0.038671 & -0.3281 & 0.371883 \tabularnewline
42 & -0.001503 & -0.0128 & 0.49493 \tabularnewline
43 & -0.138112 & -1.1719 & 0.122547 \tabularnewline
44 & -0.017236 & -0.1463 & 0.442066 \tabularnewline
45 & -0.038537 & -0.327 & 0.37231 \tabularnewline
46 & 0.038884 & 0.3299 & 0.3712 \tabularnewline
47 & -0.01293 & -0.1097 & 0.45647 \tabularnewline
48 & -0.095419 & -0.8097 & 0.210402 \tabularnewline
\hline
\end{tabular}
%Source: https://freestatistics.org/blog/index.php?pk=294014&T=2

[TABLE]
[ROW][C]Partial Autocorrelation Function[/C][/ROW]
[ROW][C]Time lag k[/C][C]PACF(k)[/C][C]T-STAT[/C][C]P-value[/C][/ROW]
[ROW][C]1[/C][C]0.692944[/C][C]5.8798[/C][C]0[/C][/ROW]
[ROW][C]2[/C][C]0.189589[/C][C]1.6087[/C][C]0.056028[/C][/ROW]
[ROW][C]3[/C][C]0.329785[/C][C]2.7983[/C][C]0.003293[/C][/ROW]
[ROW][C]4[/C][C]0.157332[/C][C]1.335[/C][C]0.09304[/C][/ROW]
[ROW][C]5[/C][C]-0.063185[/C][C]-0.5361[/C][C]0.296757[/C][/ROW]
[ROW][C]6[/C][C]0.181244[/C][C]1.5379[/C][C]0.064227[/C][/ROW]
[ROW][C]7[/C][C]-0.215115[/C][C]-1.8253[/C][C]0.036051[/C][/ROW]
[ROW][C]8[/C][C]0.101478[/C][C]0.8611[/C][C]0.196028[/C][/ROW]
[ROW][C]9[/C][C]-0.189789[/C][C]-1.6104[/C][C]0.055842[/C][/ROW]
[ROW][C]10[/C][C]-0.160245[/C][C]-1.3597[/C][C]0.08908[/C][/ROW]
[ROW][C]11[/C][C]0.303141[/C][C]2.5722[/C][C]0.006084[/C][/ROW]
[ROW][C]12[/C][C]0.230401[/C][C]1.955[/C][C]0.027232[/C][/ROW]
[ROW][C]13[/C][C]-0.375693[/C][C]-3.1879[/C][C]0.001061[/C][/ROW]
[ROW][C]14[/C][C]-0.190744[/C][C]-1.6185[/C][C]0.054962[/C][/ROW]
[ROW][C]15[/C][C]-0.15357[/C][C]-1.3031[/C][C]0.098349[/C][/ROW]
[ROW][C]16[/C][C]0.208884[/C][C]1.7724[/C][C]0.040276[/C][/ROW]
[ROW][C]17[/C][C]-0.003481[/C][C]-0.0295[/C][C]0.488259[/C][/ROW]
[ROW][C]18[/C][C]0.019934[/C][C]0.1691[/C][C]0.433077[/C][/ROW]
[ROW][C]19[/C][C]-0.011831[/C][C]-0.1004[/C][C]0.460156[/C][/ROW]
[ROW][C]20[/C][C]-0.027612[/C][C]-0.2343[/C][C]0.407711[/C][/ROW]
[ROW][C]21[/C][C]-0.054182[/C][C]-0.4598[/C][C]0.323539[/C][/ROW]
[ROW][C]22[/C][C]0.00664[/C][C]0.0563[/C][C]0.477614[/C][/ROW]
[ROW][C]23[/C][C]-0.052031[/C][C]-0.4415[/C][C]0.330089[/C][/ROW]
[ROW][C]24[/C][C]0.040745[/C][C]0.3457[/C][C]0.365276[/C][/ROW]
[ROW][C]25[/C][C]0.134725[/C][C]1.1432[/C][C]0.128375[/C][/ROW]
[ROW][C]26[/C][C]-0.040581[/C][C]-0.3443[/C][C]0.365797[/C][/ROW]
[ROW][C]27[/C][C]0.028895[/C][C]0.2452[/C][C]0.403507[/C][/ROW]
[ROW][C]28[/C][C]0.031059[/C][C]0.2635[/C][C]0.396443[/C][/ROW]
[ROW][C]29[/C][C]-0.082926[/C][C]-0.7036[/C][C]0.241961[/C][/ROW]
[ROW][C]30[/C][C]0.0402[/C][C]0.3411[/C][C]0.367009[/C][/ROW]
[ROW][C]31[/C][C]-0.037016[/C][C]-0.3141[/C][C]0.377179[/C][/ROW]
[ROW][C]32[/C][C]-0.1176[/C][C]-0.9979[/C][C]0.160843[/C][/ROW]
[ROW][C]33[/C][C]0.058196[/C][C]0.4938[/C][C]0.311471[/C][/ROW]
[ROW][C]34[/C][C]-0.164843[/C][C]-1.3987[/C][C]0.083092[/C][/ROW]
[ROW][C]35[/C][C]-0.016975[/C][C]-0.144[/C][C]0.442936[/C][/ROW]
[ROW][C]36[/C][C]0.059863[/C][C]0.508[/C][C]0.306519[/C][/ROW]
[ROW][C]37[/C][C]0.00469[/C][C]0.0398[/C][C]0.484182[/C][/ROW]
[ROW][C]38[/C][C]-0.00106[/C][C]-0.009[/C][C]0.496423[/C][/ROW]
[ROW][C]39[/C][C]0.027191[/C][C]0.2307[/C][C]0.409093[/C][/ROW]
[ROW][C]40[/C][C]-0.020485[/C][C]-0.1738[/C][C]0.431245[/C][/ROW]
[ROW][C]41[/C][C]-0.038671[/C][C]-0.3281[/C][C]0.371883[/C][/ROW]
[ROW][C]42[/C][C]-0.001503[/C][C]-0.0128[/C][C]0.49493[/C][/ROW]
[ROW][C]43[/C][C]-0.138112[/C][C]-1.1719[/C][C]0.122547[/C][/ROW]
[ROW][C]44[/C][C]-0.017236[/C][C]-0.1463[/C][C]0.442066[/C][/ROW]
[ROW][C]45[/C][C]-0.038537[/C][C]-0.327[/C][C]0.37231[/C][/ROW]
[ROW][C]46[/C][C]0.038884[/C][C]0.3299[/C][C]0.3712[/C][/ROW]
[ROW][C]47[/C][C]-0.01293[/C][C]-0.1097[/C][C]0.45647[/C][/ROW]
[ROW][C]48[/C][C]-0.095419[/C][C]-0.8097[/C][C]0.210402[/C][/ROW]
[/TABLE]
Source: https://freestatistics.org/blog/index.php?pk=294014&T=2

Globally Unique Identifier (entire table): ba.freestatistics.org/blog/index.php?pk=294014&T=2

As an alternative you can also use a QR Code:  

The GUIDs for individual cells are displayed in the table below:

Partial Autocorrelation Function
Time lag kPACF(k)T-STATP-value
10.6929445.87980
20.1895891.60870.056028
30.3297852.79830.003293
40.1573321.3350.09304
5-0.063185-0.53610.296757
60.1812441.53790.064227
7-0.215115-1.82530.036051
80.1014780.86110.196028
9-0.189789-1.61040.055842
10-0.160245-1.35970.08908
110.3031412.57220.006084
120.2304011.9550.027232
13-0.375693-3.18790.001061
14-0.190744-1.61850.054962
15-0.15357-1.30310.098349
160.2088841.77240.040276
17-0.003481-0.02950.488259
180.0199340.16910.433077
19-0.011831-0.10040.460156
20-0.027612-0.23430.407711
21-0.054182-0.45980.323539
220.006640.05630.477614
23-0.052031-0.44150.330089
240.0407450.34570.365276
250.1347251.14320.128375
26-0.040581-0.34430.365797
270.0288950.24520.403507
280.0310590.26350.396443
29-0.082926-0.70360.241961
300.04020.34110.367009
31-0.037016-0.31410.377179
32-0.1176-0.99790.160843
330.0581960.49380.311471
34-0.164843-1.39870.083092
35-0.016975-0.1440.442936
360.0598630.5080.306519
370.004690.03980.484182
38-0.00106-0.0090.496423
390.0271910.23070.409093
40-0.020485-0.17380.431245
41-0.038671-0.32810.371883
42-0.001503-0.01280.49493
43-0.138112-1.17190.122547
44-0.017236-0.14630.442066
45-0.038537-0.3270.37231
460.0388840.32990.3712
47-0.01293-0.10970.45647
48-0.095419-0.80970.210402


Parameters (Session):
par1 = 48 ; par2 = 1 ; par3 = 0 ; par4 = 0 ; par5 = 12 ; par6 = White Noise ; par7 = 0.95 ;
Parameters (R input):
par1 = 48 ; par2 = 1 ; par3 = 0 ; par4 = 0 ; par5 = 12 ; par6 = White Noise ; par7 = 0.95 ; par8 = ;
R code (references can be found in the software module):
par8 <- ''
par7 <- '0.95'
par6 <- 'White Noise'
par5 <- '12'
par4 <- '0'
par3 <- '1'
par2 <- '1'
par1 <- '48'
if (par1 == 'Default') {
par1 = 10*log10(length(x))
} else {
par1 <- as.numeric(par1)
}
par2 <- as.numeric(par2)
par3 <- as.numeric(par3)
par4 <- as.numeric(par4)
par5 <- as.numeric(par5)
if (par6 == 'White Noise') par6 <- 'white' else par6 <- 'ma'
par7 <- as.numeric(par7)
if (par8 != '') par8 <- as.numeric(par8)
x <- na.omit(x)
ox <- x
if (par8 == '') {
if (par2 == 0) {
x <- log(x)
} else {
x <- (x ^ par2 - 1) / par2
}
} else {
x <- log(x,base=par8)
}
if (par3 > 0) x <- diff(x,lag=1,difference=par3)
if (par4 > 0) x <- diff(x,lag=par5,difference=par4)
bitmap(file='picts.png')
op <- par(mfrow=c(2,1))
plot(ox,type='l',main='Original Time Series',xlab='time',ylab='value')
if (par8=='') {
mytitle <- paste('Working Time Series (lambda=',par2,', d=',par3,', D=',par4,')',sep='')
mysub <- paste('(lambda=',par2,', d=',par3,', D=',par4,', CI=', par7, ', CI type=',par6,')',sep='')
} else {
mytitle <- paste('Working Time Series (base=',par8,', d=',par3,', D=',par4,')',sep='')
mysub <- paste('(base=',par8,', d=',par3,', D=',par4,', CI=', par7, ', CI type=',par6,')',sep='')
}
plot(x,type='l', main=mytitle,xlab='time',ylab='value')
par(op)
dev.off()
bitmap(file='pic1.png')
racf <- acf(x, par1, main='Autocorrelation', xlab='time lag', ylab='ACF', ci.type=par6, ci=par7, sub=mysub)
dev.off()
bitmap(file='pic2.png')
rpacf <- pacf(x,par1,main='Partial Autocorrelation',xlab='lags',ylab='PACF',sub=mysub)
dev.off()
(myacf <- c(racf$acf))
(mypacf <- c(rpacf$acf))
lengthx <- length(x)
sqrtn <- sqrt(lengthx)
load(file='createtable')
a<-table.start()
a<-table.row.start(a)
a<-table.element(a,'Autocorrelation Function',4,TRUE)
a<-table.row.end(a)
a<-table.row.start(a)
a<-table.element(a,'Time lag k',header=TRUE)
a<-table.element(a,hyperlink('basics.htm','ACF(k)','click here for more information about the Autocorrelation Function'),header=TRUE)
a<-table.element(a,'T-STAT',header=TRUE)
a<-table.element(a,'P-value',header=TRUE)
a<-table.row.end(a)
for (i in 2:(par1+1)) {
a<-table.row.start(a)
a<-table.element(a,i-1,header=TRUE)
a<-table.element(a,round(myacf[i],6))
mytstat <- myacf[i]*sqrtn
a<-table.element(a,round(mytstat,4))
a<-table.element(a,round(1-pt(abs(mytstat),lengthx),6))
a<-table.row.end(a)
}
a<-table.end(a)
table.save(a,file='mytable.tab')
a<-table.start()
a<-table.row.start(a)
a<-table.element(a,'Partial Autocorrelation Function',4,TRUE)
a<-table.row.end(a)
a<-table.row.start(a)
a<-table.element(a,'Time lag k',header=TRUE)
a<-table.element(a,hyperlink('basics.htm','PACF(k)','click here for more information about the Partial Autocorrelation Function'),header=TRUE)
a<-table.element(a,'T-STAT',header=TRUE)
a<-table.element(a,'P-value',header=TRUE)
a<-table.row.end(a)
for (i in 1:par1) {
a<-table.row.start(a)
a<-table.element(a,i,header=TRUE)
a<-table.element(a,round(mypacf[i],6))
mytstat <- mypacf[i]*sqrtn
a<-table.element(a,round(mytstat,4))
a<-table.element(a,round(1-pt(abs(mytstat),lengthx),6))
a<-table.row.end(a)
}
a<-table.end(a)
table.save(a,file='mytable1.tab')