Free Statistics

of Irreproducible Research!

Author's title

Author*Unverified author*
R Software Modulerwasp_autocorrelation.wasp
Title produced by software(Partial) Autocorrelation Function
Date of computationMon, 14 Mar 2016 17:20:51 +0000
Cite this page as followsStatistical Computations at FreeStatistics.org, Office for Research Development and Education, URL https://freestatistics.org/blog/index.php?v=date/2016/Mar/14/t1457976163oc1xsezb2pfriu8.htm/, Retrieved Mon, 29 Apr 2024 02:28:37 +0000
Statistical Computations at FreeStatistics.org, Office for Research Development and Education, URL https://freestatistics.org/blog/index.php?pk=294015, Retrieved Mon, 29 Apr 2024 02:28:37 +0000
QR Codes:

Original text written by user:
IsPrivate?No (this computation is public)
User-defined keywords
Estimated Impact89
Family? (F = Feedback message, R = changed R code, M = changed R Module, P = changed Parameters, D = changed Data)
-       [(Partial) Autocorrelation Function] [Uitvoer België] [2016-03-14 17:20:51] [30ac29e28bcab64021946a7872e1db5d] [Current]
Feedback Forum

Post a new message
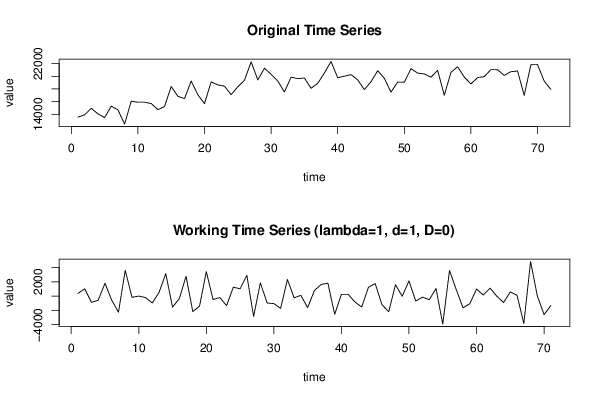
Dataseries X:
13566.7
13941.5
14964.1
14086
13505.1
15300.4
14725.2
12484.9
16082.6
15915.8
15916.1
15713
14746
15253.2
18384.3
16848.5
16485.5
19257.1
17093.4
15700.1
19124.3
18640.8
18439.2
17106.3
18347.7
19372.7
22263.8
19422.9
21268.6
20310
19256
17535.9
19857.4
19628.4
19727.5
18112.2
18889.3
20516.1
22317
19768.8
20015.8
20260.5
19434.3
17910
19134.4
20880.1
19680
17493.4
19087.8
19064.6
21191
20503.9
20364.1
19860.4
20924.1
17018.8
20607.4
21500.2
19868.3
18801.9
19787.5
19936.2
21047.6
21034.4
20132.8
20725.3
20827.8
16992.3
21818.2
21841.4
19252.2
17933.7


Summary of computational transaction
Raw Inputview raw input (R code)
Raw Outputview raw output of R engine
Computing time2 seconds
R Server'Herman Ole Andreas Wold' @ wold.wessa.net

\begin{tabular}{lllllllll}
\hline
Summary of computational transaction \tabularnewline
Raw Input & view raw input (R code)  \tabularnewline
Raw Output & view raw output of R engine  \tabularnewline
Computing time & 2 seconds \tabularnewline
R Server & 'Herman Ole Andreas Wold' @ wold.wessa.net \tabularnewline
\hline
\end{tabular}
%Source: https://freestatistics.org/blog/index.php?pk=294015&T=0

[TABLE]
[ROW][C]Summary of computational transaction[/C][/ROW]
[ROW][C]Raw Input[/C][C]view raw input (R code) [/C][/ROW]
[ROW][C]Raw Output[/C][C]view raw output of R engine [/C][/ROW]
[ROW][C]Computing time[/C][C]2 seconds[/C][/ROW]
[ROW][C]R Server[/C][C]'Herman Ole Andreas Wold' @ wold.wessa.net[/C][/ROW]
[/TABLE]
Source: https://freestatistics.org/blog/index.php?pk=294015&T=0

Globally Unique Identifier (entire table): ba.freestatistics.org/blog/index.php?pk=294015&T=0

As an alternative you can also use a QR Code:  

The GUIDs for individual cells are displayed in the table below:

Summary of computational transaction
Raw Inputview raw input (R code)
Raw Outputview raw output of R engine
Computing time2 seconds
R Server'Herman Ole Andreas Wold' @ wold.wessa.net


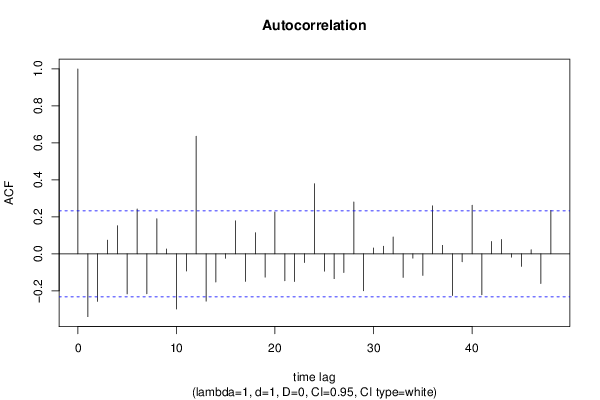
Autocorrelation Function
Time lag kACF(k)T-STATP-value
1-0.339718-2.86250.00276
2-0.257089-2.16630.016825
30.0740590.6240.267303
40.1519421.28030.102306
5-0.216537-1.82460.036136
60.2428352.04620.022223
7-0.215999-1.820.036484
80.1900111.60110.056902
90.0263080.22170.412601
10-0.29859-2.5160.007067
11-0.09255-0.77980.219038
120.6362025.36070
13-0.255894-2.15620.017228
14-0.152613-1.28590.101321
15-0.02382-0.20070.42075
160.1782241.50170.068799
17-0.148898-1.25460.106862
180.1141740.9620.169645
19-0.126-1.06170.145986
200.2267951.9110.030021
21-0.146039-1.23050.111277
22-0.149857-1.26270.105411
23-0.0465-0.39180.348184
240.3791033.19440.001045
25-0.093382-0.78690.216993
26-0.134083-1.12980.13118
27-0.101169-0.85250.198412
280.2803372.36220.010457
29-0.199676-1.68250.048432
300.0316280.26650.395313
310.0411920.34710.364774
320.0915750.77160.221448
33-0.127489-1.07420.143176
34-0.023155-0.19510.422932
35-0.116529-0.98190.164744
360.2595732.18720.016011
370.0457330.38540.350563
38-0.225358-1.89890.030821
39-0.0424-0.35730.360975
400.2626512.21310.015052
41-0.221055-1.86260.033325
420.0667990.56290.287652
430.0780720.65780.256383
44-0.017999-0.15170.439942
45-0.067888-0.5720.284554
460.0225070.18960.425063
47-0.160108-1.34910.090797
480.2351431.98140.025713

\begin{tabular}{lllllllll}
\hline
Autocorrelation Function \tabularnewline
Time lag k & ACF(k) & T-STAT & P-value \tabularnewline
1 & -0.339718 & -2.8625 & 0.00276 \tabularnewline
2 & -0.257089 & -2.1663 & 0.016825 \tabularnewline
3 & 0.074059 & 0.624 & 0.267303 \tabularnewline
4 & 0.151942 & 1.2803 & 0.102306 \tabularnewline
5 & -0.216537 & -1.8246 & 0.036136 \tabularnewline
6 & 0.242835 & 2.0462 & 0.022223 \tabularnewline
7 & -0.215999 & -1.82 & 0.036484 \tabularnewline
8 & 0.190011 & 1.6011 & 0.056902 \tabularnewline
9 & 0.026308 & 0.2217 & 0.412601 \tabularnewline
10 & -0.29859 & -2.516 & 0.007067 \tabularnewline
11 & -0.09255 & -0.7798 & 0.219038 \tabularnewline
12 & 0.636202 & 5.3607 & 0 \tabularnewline
13 & -0.255894 & -2.1562 & 0.017228 \tabularnewline
14 & -0.152613 & -1.2859 & 0.101321 \tabularnewline
15 & -0.02382 & -0.2007 & 0.42075 \tabularnewline
16 & 0.178224 & 1.5017 & 0.068799 \tabularnewline
17 & -0.148898 & -1.2546 & 0.106862 \tabularnewline
18 & 0.114174 & 0.962 & 0.169645 \tabularnewline
19 & -0.126 & -1.0617 & 0.145986 \tabularnewline
20 & 0.226795 & 1.911 & 0.030021 \tabularnewline
21 & -0.146039 & -1.2305 & 0.111277 \tabularnewline
22 & -0.149857 & -1.2627 & 0.105411 \tabularnewline
23 & -0.0465 & -0.3918 & 0.348184 \tabularnewline
24 & 0.379103 & 3.1944 & 0.001045 \tabularnewline
25 & -0.093382 & -0.7869 & 0.216993 \tabularnewline
26 & -0.134083 & -1.1298 & 0.13118 \tabularnewline
27 & -0.101169 & -0.8525 & 0.198412 \tabularnewline
28 & 0.280337 & 2.3622 & 0.010457 \tabularnewline
29 & -0.199676 & -1.6825 & 0.048432 \tabularnewline
30 & 0.031628 & 0.2665 & 0.395313 \tabularnewline
31 & 0.041192 & 0.3471 & 0.364774 \tabularnewline
32 & 0.091575 & 0.7716 & 0.221448 \tabularnewline
33 & -0.127489 & -1.0742 & 0.143176 \tabularnewline
34 & -0.023155 & -0.1951 & 0.422932 \tabularnewline
35 & -0.116529 & -0.9819 & 0.164744 \tabularnewline
36 & 0.259573 & 2.1872 & 0.016011 \tabularnewline
37 & 0.045733 & 0.3854 & 0.350563 \tabularnewline
38 & -0.225358 & -1.8989 & 0.030821 \tabularnewline
39 & -0.0424 & -0.3573 & 0.360975 \tabularnewline
40 & 0.262651 & 2.2131 & 0.015052 \tabularnewline
41 & -0.221055 & -1.8626 & 0.033325 \tabularnewline
42 & 0.066799 & 0.5629 & 0.287652 \tabularnewline
43 & 0.078072 & 0.6578 & 0.256383 \tabularnewline
44 & -0.017999 & -0.1517 & 0.439942 \tabularnewline
45 & -0.067888 & -0.572 & 0.284554 \tabularnewline
46 & 0.022507 & 0.1896 & 0.425063 \tabularnewline
47 & -0.160108 & -1.3491 & 0.090797 \tabularnewline
48 & 0.235143 & 1.9814 & 0.025713 \tabularnewline
\hline
\end{tabular}
%Source: https://freestatistics.org/blog/index.php?pk=294015&T=1

[TABLE]
[ROW][C]Autocorrelation Function[/C][/ROW]
[ROW][C]Time lag k[/C][C]ACF(k)[/C][C]T-STAT[/C][C]P-value[/C][/ROW]
[ROW][C]1[/C][C]-0.339718[/C][C]-2.8625[/C][C]0.00276[/C][/ROW]
[ROW][C]2[/C][C]-0.257089[/C][C]-2.1663[/C][C]0.016825[/C][/ROW]
[ROW][C]3[/C][C]0.074059[/C][C]0.624[/C][C]0.267303[/C][/ROW]
[ROW][C]4[/C][C]0.151942[/C][C]1.2803[/C][C]0.102306[/C][/ROW]
[ROW][C]5[/C][C]-0.216537[/C][C]-1.8246[/C][C]0.036136[/C][/ROW]
[ROW][C]6[/C][C]0.242835[/C][C]2.0462[/C][C]0.022223[/C][/ROW]
[ROW][C]7[/C][C]-0.215999[/C][C]-1.82[/C][C]0.036484[/C][/ROW]
[ROW][C]8[/C][C]0.190011[/C][C]1.6011[/C][C]0.056902[/C][/ROW]
[ROW][C]9[/C][C]0.026308[/C][C]0.2217[/C][C]0.412601[/C][/ROW]
[ROW][C]10[/C][C]-0.29859[/C][C]-2.516[/C][C]0.007067[/C][/ROW]
[ROW][C]11[/C][C]-0.09255[/C][C]-0.7798[/C][C]0.219038[/C][/ROW]
[ROW][C]12[/C][C]0.636202[/C][C]5.3607[/C][C]0[/C][/ROW]
[ROW][C]13[/C][C]-0.255894[/C][C]-2.1562[/C][C]0.017228[/C][/ROW]
[ROW][C]14[/C][C]-0.152613[/C][C]-1.2859[/C][C]0.101321[/C][/ROW]
[ROW][C]15[/C][C]-0.02382[/C][C]-0.2007[/C][C]0.42075[/C][/ROW]
[ROW][C]16[/C][C]0.178224[/C][C]1.5017[/C][C]0.068799[/C][/ROW]
[ROW][C]17[/C][C]-0.148898[/C][C]-1.2546[/C][C]0.106862[/C][/ROW]
[ROW][C]18[/C][C]0.114174[/C][C]0.962[/C][C]0.169645[/C][/ROW]
[ROW][C]19[/C][C]-0.126[/C][C]-1.0617[/C][C]0.145986[/C][/ROW]
[ROW][C]20[/C][C]0.226795[/C][C]1.911[/C][C]0.030021[/C][/ROW]
[ROW][C]21[/C][C]-0.146039[/C][C]-1.2305[/C][C]0.111277[/C][/ROW]
[ROW][C]22[/C][C]-0.149857[/C][C]-1.2627[/C][C]0.105411[/C][/ROW]
[ROW][C]23[/C][C]-0.0465[/C][C]-0.3918[/C][C]0.348184[/C][/ROW]
[ROW][C]24[/C][C]0.379103[/C][C]3.1944[/C][C]0.001045[/C][/ROW]
[ROW][C]25[/C][C]-0.093382[/C][C]-0.7869[/C][C]0.216993[/C][/ROW]
[ROW][C]26[/C][C]-0.134083[/C][C]-1.1298[/C][C]0.13118[/C][/ROW]
[ROW][C]27[/C][C]-0.101169[/C][C]-0.8525[/C][C]0.198412[/C][/ROW]
[ROW][C]28[/C][C]0.280337[/C][C]2.3622[/C][C]0.010457[/C][/ROW]
[ROW][C]29[/C][C]-0.199676[/C][C]-1.6825[/C][C]0.048432[/C][/ROW]
[ROW][C]30[/C][C]0.031628[/C][C]0.2665[/C][C]0.395313[/C][/ROW]
[ROW][C]31[/C][C]0.041192[/C][C]0.3471[/C][C]0.364774[/C][/ROW]
[ROW][C]32[/C][C]0.091575[/C][C]0.7716[/C][C]0.221448[/C][/ROW]
[ROW][C]33[/C][C]-0.127489[/C][C]-1.0742[/C][C]0.143176[/C][/ROW]
[ROW][C]34[/C][C]-0.023155[/C][C]-0.1951[/C][C]0.422932[/C][/ROW]
[ROW][C]35[/C][C]-0.116529[/C][C]-0.9819[/C][C]0.164744[/C][/ROW]
[ROW][C]36[/C][C]0.259573[/C][C]2.1872[/C][C]0.016011[/C][/ROW]
[ROW][C]37[/C][C]0.045733[/C][C]0.3854[/C][C]0.350563[/C][/ROW]
[ROW][C]38[/C][C]-0.225358[/C][C]-1.8989[/C][C]0.030821[/C][/ROW]
[ROW][C]39[/C][C]-0.0424[/C][C]-0.3573[/C][C]0.360975[/C][/ROW]
[ROW][C]40[/C][C]0.262651[/C][C]2.2131[/C][C]0.015052[/C][/ROW]
[ROW][C]41[/C][C]-0.221055[/C][C]-1.8626[/C][C]0.033325[/C][/ROW]
[ROW][C]42[/C][C]0.066799[/C][C]0.5629[/C][C]0.287652[/C][/ROW]
[ROW][C]43[/C][C]0.078072[/C][C]0.6578[/C][C]0.256383[/C][/ROW]
[ROW][C]44[/C][C]-0.017999[/C][C]-0.1517[/C][C]0.439942[/C][/ROW]
[ROW][C]45[/C][C]-0.067888[/C][C]-0.572[/C][C]0.284554[/C][/ROW]
[ROW][C]46[/C][C]0.022507[/C][C]0.1896[/C][C]0.425063[/C][/ROW]
[ROW][C]47[/C][C]-0.160108[/C][C]-1.3491[/C][C]0.090797[/C][/ROW]
[ROW][C]48[/C][C]0.235143[/C][C]1.9814[/C][C]0.025713[/C][/ROW]
[/TABLE]
Source: https://freestatistics.org/blog/index.php?pk=294015&T=1

Globally Unique Identifier (entire table): ba.freestatistics.org/blog/index.php?pk=294015&T=1

As an alternative you can also use a QR Code:  

The GUIDs for individual cells are displayed in the table below:

Autocorrelation Function
Time lag kACF(k)T-STATP-value
1-0.339718-2.86250.00276
2-0.257089-2.16630.016825
30.0740590.6240.267303
40.1519421.28030.102306
5-0.216537-1.82460.036136
60.2428352.04620.022223
7-0.215999-1.820.036484
80.1900111.60110.056902
90.0263080.22170.412601
10-0.29859-2.5160.007067
11-0.09255-0.77980.219038
120.6362025.36070
13-0.255894-2.15620.017228
14-0.152613-1.28590.101321
15-0.02382-0.20070.42075
160.1782241.50170.068799
17-0.148898-1.25460.106862
180.1141740.9620.169645
19-0.126-1.06170.145986
200.2267951.9110.030021
21-0.146039-1.23050.111277
22-0.149857-1.26270.105411
23-0.0465-0.39180.348184
240.3791033.19440.001045
25-0.093382-0.78690.216993
26-0.134083-1.12980.13118
27-0.101169-0.85250.198412
280.2803372.36220.010457
29-0.199676-1.68250.048432
300.0316280.26650.395313
310.0411920.34710.364774
320.0915750.77160.221448
33-0.127489-1.07420.143176
34-0.023155-0.19510.422932
35-0.116529-0.98190.164744
360.2595732.18720.016011
370.0457330.38540.350563
38-0.225358-1.89890.030821
39-0.0424-0.35730.360975
400.2626512.21310.015052
41-0.221055-1.86260.033325
420.0667990.56290.287652
430.0780720.65780.256383
44-0.017999-0.15170.439942
45-0.067888-0.5720.284554
460.0225070.18960.425063
47-0.160108-1.34910.090797
480.2351431.98140.025713


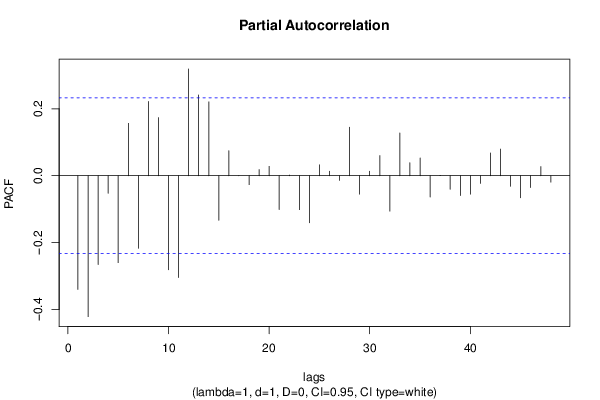
Partial Autocorrelation Function
Time lag kPACF(k)T-STATP-value
1-0.339718-2.86250.00276
2-0.421096-3.54820.000346
3-0.265359-2.2360.01425
4-0.052285-0.44060.330433
5-0.2598-2.18910.015939
60.1564191.3180.095869
7-0.216605-1.82510.036092
80.2218881.86970.032827
90.173571.46250.074005
10-0.281023-2.36790.010307
11-0.304228-2.56350.006241
120.3190582.68840.004469
130.2413632.03380.022857
140.2207351.85990.033518
15-0.132984-1.12050.13313
160.074490.62770.266118
17-0.000327-0.00280.498906
18-0.026662-0.22470.411447
190.0182190.15350.439212
200.0280860.23670.406802
21-0.100781-0.84920.199312
220.0018950.0160.493652
23-0.101294-0.85350.198121
24-0.140565-1.18440.120097
250.0325220.2740.392428
260.0132130.11130.455834
27-0.013932-0.11740.453441
280.1447721.21990.113275
29-0.055077-0.46410.322002
300.0132620.11170.45567
310.0600580.50610.307191
32-0.10574-0.8910.187975
330.1275951.07510.142977
340.0389970.32860.371715
350.0528650.44540.328676
36-0.063517-0.53520.297092
370.0005640.00480.498109
38-0.040245-0.33910.367765
39-0.058923-0.49650.310539
40-0.054992-0.46340.322257
41-0.022878-0.19280.423843
420.0678490.57170.284664
430.0794620.66960.252656
44-0.031312-0.26380.396335
45-0.065682-0.55340.290849
46-0.035412-0.29840.38314
470.0272740.22980.40945
48-0.019186-0.16170.436013

\begin{tabular}{lllllllll}
\hline
Partial Autocorrelation Function \tabularnewline
Time lag k & PACF(k) & T-STAT & P-value \tabularnewline
1 & -0.339718 & -2.8625 & 0.00276 \tabularnewline
2 & -0.421096 & -3.5482 & 0.000346 \tabularnewline
3 & -0.265359 & -2.236 & 0.01425 \tabularnewline
4 & -0.052285 & -0.4406 & 0.330433 \tabularnewline
5 & -0.2598 & -2.1891 & 0.015939 \tabularnewline
6 & 0.156419 & 1.318 & 0.095869 \tabularnewline
7 & -0.216605 & -1.8251 & 0.036092 \tabularnewline
8 & 0.221888 & 1.8697 & 0.032827 \tabularnewline
9 & 0.17357 & 1.4625 & 0.074005 \tabularnewline
10 & -0.281023 & -2.3679 & 0.010307 \tabularnewline
11 & -0.304228 & -2.5635 & 0.006241 \tabularnewline
12 & 0.319058 & 2.6884 & 0.004469 \tabularnewline
13 & 0.241363 & 2.0338 & 0.022857 \tabularnewline
14 & 0.220735 & 1.8599 & 0.033518 \tabularnewline
15 & -0.132984 & -1.1205 & 0.13313 \tabularnewline
16 & 0.07449 & 0.6277 & 0.266118 \tabularnewline
17 & -0.000327 & -0.0028 & 0.498906 \tabularnewline
18 & -0.026662 & -0.2247 & 0.411447 \tabularnewline
19 & 0.018219 & 0.1535 & 0.439212 \tabularnewline
20 & 0.028086 & 0.2367 & 0.406802 \tabularnewline
21 & -0.100781 & -0.8492 & 0.199312 \tabularnewline
22 & 0.001895 & 0.016 & 0.493652 \tabularnewline
23 & -0.101294 & -0.8535 & 0.198121 \tabularnewline
24 & -0.140565 & -1.1844 & 0.120097 \tabularnewline
25 & 0.032522 & 0.274 & 0.392428 \tabularnewline
26 & 0.013213 & 0.1113 & 0.455834 \tabularnewline
27 & -0.013932 & -0.1174 & 0.453441 \tabularnewline
28 & 0.144772 & 1.2199 & 0.113275 \tabularnewline
29 & -0.055077 & -0.4641 & 0.322002 \tabularnewline
30 & 0.013262 & 0.1117 & 0.45567 \tabularnewline
31 & 0.060058 & 0.5061 & 0.307191 \tabularnewline
32 & -0.10574 & -0.891 & 0.187975 \tabularnewline
33 & 0.127595 & 1.0751 & 0.142977 \tabularnewline
34 & 0.038997 & 0.3286 & 0.371715 \tabularnewline
35 & 0.052865 & 0.4454 & 0.328676 \tabularnewline
36 & -0.063517 & -0.5352 & 0.297092 \tabularnewline
37 & 0.000564 & 0.0048 & 0.498109 \tabularnewline
38 & -0.040245 & -0.3391 & 0.367765 \tabularnewline
39 & -0.058923 & -0.4965 & 0.310539 \tabularnewline
40 & -0.054992 & -0.4634 & 0.322257 \tabularnewline
41 & -0.022878 & -0.1928 & 0.423843 \tabularnewline
42 & 0.067849 & 0.5717 & 0.284664 \tabularnewline
43 & 0.079462 & 0.6696 & 0.252656 \tabularnewline
44 & -0.031312 & -0.2638 & 0.396335 \tabularnewline
45 & -0.065682 & -0.5534 & 0.290849 \tabularnewline
46 & -0.035412 & -0.2984 & 0.38314 \tabularnewline
47 & 0.027274 & 0.2298 & 0.40945 \tabularnewline
48 & -0.019186 & -0.1617 & 0.436013 \tabularnewline
\hline
\end{tabular}
%Source: https://freestatistics.org/blog/index.php?pk=294015&T=2

[TABLE]
[ROW][C]Partial Autocorrelation Function[/C][/ROW]
[ROW][C]Time lag k[/C][C]PACF(k)[/C][C]T-STAT[/C][C]P-value[/C][/ROW]
[ROW][C]1[/C][C]-0.339718[/C][C]-2.8625[/C][C]0.00276[/C][/ROW]
[ROW][C]2[/C][C]-0.421096[/C][C]-3.5482[/C][C]0.000346[/C][/ROW]
[ROW][C]3[/C][C]-0.265359[/C][C]-2.236[/C][C]0.01425[/C][/ROW]
[ROW][C]4[/C][C]-0.052285[/C][C]-0.4406[/C][C]0.330433[/C][/ROW]
[ROW][C]5[/C][C]-0.2598[/C][C]-2.1891[/C][C]0.015939[/C][/ROW]
[ROW][C]6[/C][C]0.156419[/C][C]1.318[/C][C]0.095869[/C][/ROW]
[ROW][C]7[/C][C]-0.216605[/C][C]-1.8251[/C][C]0.036092[/C][/ROW]
[ROW][C]8[/C][C]0.221888[/C][C]1.8697[/C][C]0.032827[/C][/ROW]
[ROW][C]9[/C][C]0.17357[/C][C]1.4625[/C][C]0.074005[/C][/ROW]
[ROW][C]10[/C][C]-0.281023[/C][C]-2.3679[/C][C]0.010307[/C][/ROW]
[ROW][C]11[/C][C]-0.304228[/C][C]-2.5635[/C][C]0.006241[/C][/ROW]
[ROW][C]12[/C][C]0.319058[/C][C]2.6884[/C][C]0.004469[/C][/ROW]
[ROW][C]13[/C][C]0.241363[/C][C]2.0338[/C][C]0.022857[/C][/ROW]
[ROW][C]14[/C][C]0.220735[/C][C]1.8599[/C][C]0.033518[/C][/ROW]
[ROW][C]15[/C][C]-0.132984[/C][C]-1.1205[/C][C]0.13313[/C][/ROW]
[ROW][C]16[/C][C]0.07449[/C][C]0.6277[/C][C]0.266118[/C][/ROW]
[ROW][C]17[/C][C]-0.000327[/C][C]-0.0028[/C][C]0.498906[/C][/ROW]
[ROW][C]18[/C][C]-0.026662[/C][C]-0.2247[/C][C]0.411447[/C][/ROW]
[ROW][C]19[/C][C]0.018219[/C][C]0.1535[/C][C]0.439212[/C][/ROW]
[ROW][C]20[/C][C]0.028086[/C][C]0.2367[/C][C]0.406802[/C][/ROW]
[ROW][C]21[/C][C]-0.100781[/C][C]-0.8492[/C][C]0.199312[/C][/ROW]
[ROW][C]22[/C][C]0.001895[/C][C]0.016[/C][C]0.493652[/C][/ROW]
[ROW][C]23[/C][C]-0.101294[/C][C]-0.8535[/C][C]0.198121[/C][/ROW]
[ROW][C]24[/C][C]-0.140565[/C][C]-1.1844[/C][C]0.120097[/C][/ROW]
[ROW][C]25[/C][C]0.032522[/C][C]0.274[/C][C]0.392428[/C][/ROW]
[ROW][C]26[/C][C]0.013213[/C][C]0.1113[/C][C]0.455834[/C][/ROW]
[ROW][C]27[/C][C]-0.013932[/C][C]-0.1174[/C][C]0.453441[/C][/ROW]
[ROW][C]28[/C][C]0.144772[/C][C]1.2199[/C][C]0.113275[/C][/ROW]
[ROW][C]29[/C][C]-0.055077[/C][C]-0.4641[/C][C]0.322002[/C][/ROW]
[ROW][C]30[/C][C]0.013262[/C][C]0.1117[/C][C]0.45567[/C][/ROW]
[ROW][C]31[/C][C]0.060058[/C][C]0.5061[/C][C]0.307191[/C][/ROW]
[ROW][C]32[/C][C]-0.10574[/C][C]-0.891[/C][C]0.187975[/C][/ROW]
[ROW][C]33[/C][C]0.127595[/C][C]1.0751[/C][C]0.142977[/C][/ROW]
[ROW][C]34[/C][C]0.038997[/C][C]0.3286[/C][C]0.371715[/C][/ROW]
[ROW][C]35[/C][C]0.052865[/C][C]0.4454[/C][C]0.328676[/C][/ROW]
[ROW][C]36[/C][C]-0.063517[/C][C]-0.5352[/C][C]0.297092[/C][/ROW]
[ROW][C]37[/C][C]0.000564[/C][C]0.0048[/C][C]0.498109[/C][/ROW]
[ROW][C]38[/C][C]-0.040245[/C][C]-0.3391[/C][C]0.367765[/C][/ROW]
[ROW][C]39[/C][C]-0.058923[/C][C]-0.4965[/C][C]0.310539[/C][/ROW]
[ROW][C]40[/C][C]-0.054992[/C][C]-0.4634[/C][C]0.322257[/C][/ROW]
[ROW][C]41[/C][C]-0.022878[/C][C]-0.1928[/C][C]0.423843[/C][/ROW]
[ROW][C]42[/C][C]0.067849[/C][C]0.5717[/C][C]0.284664[/C][/ROW]
[ROW][C]43[/C][C]0.079462[/C][C]0.6696[/C][C]0.252656[/C][/ROW]
[ROW][C]44[/C][C]-0.031312[/C][C]-0.2638[/C][C]0.396335[/C][/ROW]
[ROW][C]45[/C][C]-0.065682[/C][C]-0.5534[/C][C]0.290849[/C][/ROW]
[ROW][C]46[/C][C]-0.035412[/C][C]-0.2984[/C][C]0.38314[/C][/ROW]
[ROW][C]47[/C][C]0.027274[/C][C]0.2298[/C][C]0.40945[/C][/ROW]
[ROW][C]48[/C][C]-0.019186[/C][C]-0.1617[/C][C]0.436013[/C][/ROW]
[/TABLE]
Source: https://freestatistics.org/blog/index.php?pk=294015&T=2

Globally Unique Identifier (entire table): ba.freestatistics.org/blog/index.php?pk=294015&T=2

As an alternative you can also use a QR Code:  

The GUIDs for individual cells are displayed in the table below:

Partial Autocorrelation Function
Time lag kPACF(k)T-STATP-value
1-0.339718-2.86250.00276
2-0.421096-3.54820.000346
3-0.265359-2.2360.01425
4-0.052285-0.44060.330433
5-0.2598-2.18910.015939
60.1564191.3180.095869
7-0.216605-1.82510.036092
80.2218881.86970.032827
90.173571.46250.074005
10-0.281023-2.36790.010307
11-0.304228-2.56350.006241
120.3190582.68840.004469
130.2413632.03380.022857
140.2207351.85990.033518
15-0.132984-1.12050.13313
160.074490.62770.266118
17-0.000327-0.00280.498906
18-0.026662-0.22470.411447
190.0182190.15350.439212
200.0280860.23670.406802
21-0.100781-0.84920.199312
220.0018950.0160.493652
23-0.101294-0.85350.198121
24-0.140565-1.18440.120097
250.0325220.2740.392428
260.0132130.11130.455834
27-0.013932-0.11740.453441
280.1447721.21990.113275
29-0.055077-0.46410.322002
300.0132620.11170.45567
310.0600580.50610.307191
32-0.10574-0.8910.187975
330.1275951.07510.142977
340.0389970.32860.371715
350.0528650.44540.328676
36-0.063517-0.53520.297092
370.0005640.00480.498109
38-0.040245-0.33910.367765
39-0.058923-0.49650.310539
40-0.054992-0.46340.322257
41-0.022878-0.19280.423843
420.0678490.57170.284664
430.0794620.66960.252656
44-0.031312-0.26380.396335
45-0.065682-0.55340.290849
46-0.035412-0.29840.38314
470.0272740.22980.40945
48-0.019186-0.16170.436013


Parameters (Session):
par1 = 48 ; par2 = 1 ; par3 = 1 ; par4 = 0 ; par5 = 12 ; par6 = White Noise ; par7 = 0.95 ;
Parameters (R input):
par1 = 48 ; par2 = 1 ; par3 = 1 ; par4 = 0 ; par5 = 12 ; par6 = White Noise ; par7 = 0.95 ; par8 = ;
R code (references can be found in the software module):
par8 <- ''
par7 <- '0.95'
par6 <- 'White Noise'
par5 <- '12'
par4 <- '0'
par3 <- '0'
par2 <- '1'
par1 <- '48'
if (par1 == 'Default') {
par1 = 10*log10(length(x))
} else {
par1 <- as.numeric(par1)
}
par2 <- as.numeric(par2)
par3 <- as.numeric(par3)
par4 <- as.numeric(par4)
par5 <- as.numeric(par5)
if (par6 == 'White Noise') par6 <- 'white' else par6 <- 'ma'
par7 <- as.numeric(par7)
if (par8 != '') par8 <- as.numeric(par8)
x <- na.omit(x)
ox <- x
if (par8 == '') {
if (par2 == 0) {
x <- log(x)
} else {
x <- (x ^ par2 - 1) / par2
}
} else {
x <- log(x,base=par8)
}
if (par3 > 0) x <- diff(x,lag=1,difference=par3)
if (par4 > 0) x <- diff(x,lag=par5,difference=par4)
bitmap(file='picts.png')
op <- par(mfrow=c(2,1))
plot(ox,type='l',main='Original Time Series',xlab='time',ylab='value')
if (par8=='') {
mytitle <- paste('Working Time Series (lambda=',par2,', d=',par3,', D=',par4,')',sep='')
mysub <- paste('(lambda=',par2,', d=',par3,', D=',par4,', CI=', par7, ', CI type=',par6,')',sep='')
} else {
mytitle <- paste('Working Time Series (base=',par8,', d=',par3,', D=',par4,')',sep='')
mysub <- paste('(base=',par8,', d=',par3,', D=',par4,', CI=', par7, ', CI type=',par6,')',sep='')
}
plot(x,type='l', main=mytitle,xlab='time',ylab='value')
par(op)
dev.off()
bitmap(file='pic1.png')
racf <- acf(x, par1, main='Autocorrelation', xlab='time lag', ylab='ACF', ci.type=par6, ci=par7, sub=mysub)
dev.off()
bitmap(file='pic2.png')
rpacf <- pacf(x,par1,main='Partial Autocorrelation',xlab='lags',ylab='PACF',sub=mysub)
dev.off()
(myacf <- c(racf$acf))
(mypacf <- c(rpacf$acf))
lengthx <- length(x)
sqrtn <- sqrt(lengthx)
load(file='createtable')
a<-table.start()
a<-table.row.start(a)
a<-table.element(a,'Autocorrelation Function',4,TRUE)
a<-table.row.end(a)
a<-table.row.start(a)
a<-table.element(a,'Time lag k',header=TRUE)
a<-table.element(a,hyperlink('basics.htm','ACF(k)','click here for more information about the Autocorrelation Function'),header=TRUE)
a<-table.element(a,'T-STAT',header=TRUE)
a<-table.element(a,'P-value',header=TRUE)
a<-table.row.end(a)
for (i in 2:(par1+1)) {
a<-table.row.start(a)
a<-table.element(a,i-1,header=TRUE)
a<-table.element(a,round(myacf[i],6))
mytstat <- myacf[i]*sqrtn
a<-table.element(a,round(mytstat,4))
a<-table.element(a,round(1-pt(abs(mytstat),lengthx),6))
a<-table.row.end(a)
}
a<-table.end(a)
table.save(a,file='mytable.tab')
a<-table.start()
a<-table.row.start(a)
a<-table.element(a,'Partial Autocorrelation Function',4,TRUE)
a<-table.row.end(a)
a<-table.row.start(a)
a<-table.element(a,'Time lag k',header=TRUE)
a<-table.element(a,hyperlink('basics.htm','PACF(k)','click here for more information about the Partial Autocorrelation Function'),header=TRUE)
a<-table.element(a,'T-STAT',header=TRUE)
a<-table.element(a,'P-value',header=TRUE)
a<-table.row.end(a)
for (i in 1:par1) {
a<-table.row.start(a)
a<-table.element(a,i,header=TRUE)
a<-table.element(a,round(mypacf[i],6))
mytstat <- mypacf[i]*sqrtn
a<-table.element(a,round(mytstat,4))
a<-table.element(a,round(1-pt(abs(mytstat),lengthx),6))
a<-table.row.end(a)
}
a<-table.end(a)
table.save(a,file='mytable1.tab')