Free Statistics

of Irreproducible Research!

Author's title

Author*Unverified author*
R Software Modulerwasp_autocorrelation.wasp
Title produced by software(Partial) Autocorrelation Function
Date of computationMon, 14 Mar 2016 19:05:15 +0000
Cite this page as followsStatistical Computations at FreeStatistics.org, Office for Research Development and Education, URL https://freestatistics.org/blog/index.php?v=date/2016/Mar/14/t1457982338enouz0rqlm5tg7q.htm/, Retrieved Mon, 29 Apr 2024 00:05:57 +0000
Statistical Computations at FreeStatistics.org, Office for Research Development and Education, URL https://freestatistics.org/blog/index.php?pk=294035, Retrieved Mon, 29 Apr 2024 00:05:57 +0000
QR Codes:

Original text written by user:
IsPrivate?No (this computation is public)
User-defined keywords
Estimated Impact105
Family? (F = Feedback message, R = changed R code, M = changed R Module, P = changed Parameters, D = changed Data)
-       [(Partial) Autocorrelation Function] [] [2016-03-14 19:05:15] [9d122f8260d20611f07666190c7f1fd6] [Current]
Feedback Forum

Post a new message
Dataseries X:
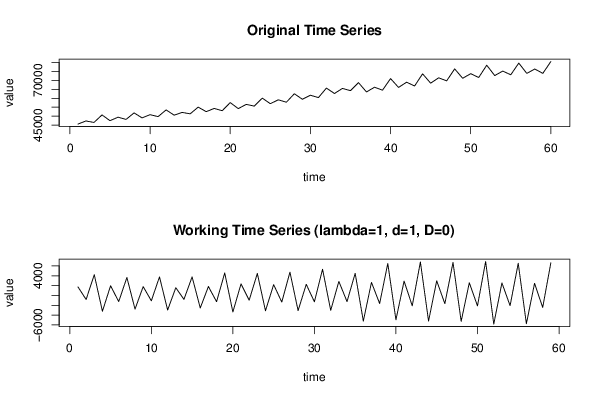
45564.6
47295.5
46465.5
50679.5
47452.8
49415.4
48165.3
51814
49030.7
50820.8
49729.5
53501.6
50524.9
52095
51290.3
55064
52505.2
54318.3
53039.6
57607.6
54236.4
56586.4
55614
60085.9
56963.5
59152.8
57804.6
62541.5
59449.3
61704.7
60399
65724.7
62679.4
65526.5
64274.8
68769.1
63542.8
66198
64544.9
71041.8
66087.2
69005.8
66897
73702
68485.3
71457
69774.6
76479.7
71204.7
73783.9
71651
78541.6
72714.4
75258
73168.1
79701.6
73944.5
76401.2
73948.1
80583.3


Summary of computational transaction
Raw Inputview raw input (R code)
Raw Outputview raw output of R engine
Computing time1 seconds
R Server'Sir Maurice George Kendall' @ kendall.wessa.net

\begin{tabular}{lllllllll}
\hline
Summary of computational transaction \tabularnewline
Raw Input & view raw input (R code)  \tabularnewline
Raw Output & view raw output of R engine  \tabularnewline
Computing time & 1 seconds \tabularnewline
R Server & 'Sir Maurice George Kendall' @ kendall.wessa.net \tabularnewline
\hline
\end{tabular}
%Source: https://freestatistics.org/blog/index.php?pk=294035&T=0

[TABLE]
[ROW][C]Summary of computational transaction[/C][/ROW]
[ROW][C]Raw Input[/C][C]view raw input (R code) [/C][/ROW]
[ROW][C]Raw Output[/C][C]view raw output of R engine [/C][/ROW]
[ROW][C]Computing time[/C][C]1 seconds[/C][/ROW]
[ROW][C]R Server[/C][C]'Sir Maurice George Kendall' @ kendall.wessa.net[/C][/ROW]
[/TABLE]
Source: https://freestatistics.org/blog/index.php?pk=294035&T=0

Globally Unique Identifier (entire table): ba.freestatistics.org/blog/index.php?pk=294035&T=0

As an alternative you can also use a QR Code:  

The GUIDs for individual cells are displayed in the table below:

Summary of computational transaction
Raw Inputview raw input (R code)
Raw Outputview raw output of R engine
Computing time1 seconds
R Server'Sir Maurice George Kendall' @ kendall.wessa.net


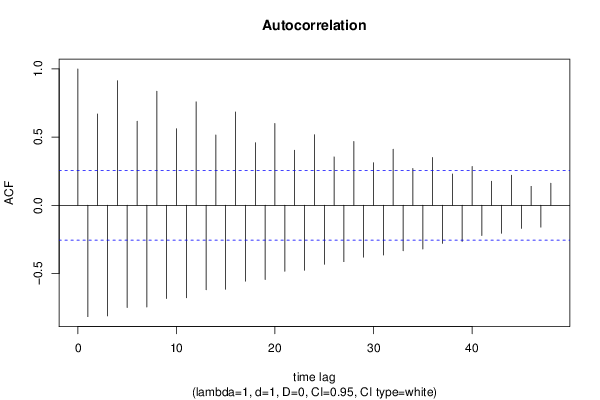
Autocorrelation Function
Time lag kACF(k)T-STATP-value
1-0.817076-6.27610
20.6694865.14242e-06
3-0.811612-6.23410
40.913367.01560
5-0.750441-5.76420
60.6167224.73717e-06
7-0.746005-5.73020
80.8368816.42820
9-0.684506-5.25781e-06
100.5617874.31523.1e-05
11-0.678881-5.21461e-06
120.7584385.82570
13-0.619815-4.76096e-06
140.5155943.96040.000102
15-0.615526-4.72797e-06
160.6844495.25741e-06
17-0.5565-4.27463.5e-05
180.4592343.52740.00041
19-0.544669-4.18374.8e-05
200.5995794.60551.1e-05
21-0.484642-3.72260.000221
220.4034343.09880.001487
23-0.477059-3.66440.000266
240.5177273.97679.7e-05
25-0.432937-3.32550.000761
260.3547832.72510.004223
27-0.41343-3.17560.001189
280.4675413.59120.000336
29-0.380395-2.92190.002462
300.311562.39310.009953
31-0.36473-2.80150.003434
320.4109323.15640.001258
33-0.333893-2.56470.006446
340.2698742.07290.021277
35-0.321411-2.46880.008236
360.3509292.69550.004571
37-0.27947-2.14670.017972
380.2289131.75830.04194
39-0.265005-2.03550.023148
400.2846772.18660.016373
41-0.221955-1.70490.04674
420.1767421.35760.089884
43-0.205144-1.57570.060217
440.2200931.69060.048098
45-0.169528-1.30220.09896
460.1386511.0650.145607
47-0.160511-1.23290.111249
480.1620131.24440.109128

\begin{tabular}{lllllllll}
\hline
Autocorrelation Function \tabularnewline
Time lag k & ACF(k) & T-STAT & P-value \tabularnewline
1 & -0.817076 & -6.2761 & 0 \tabularnewline
2 & 0.669486 & 5.1424 & 2e-06 \tabularnewline
3 & -0.811612 & -6.2341 & 0 \tabularnewline
4 & 0.91336 & 7.0156 & 0 \tabularnewline
5 & -0.750441 & -5.7642 & 0 \tabularnewline
6 & 0.616722 & 4.7371 & 7e-06 \tabularnewline
7 & -0.746005 & -5.7302 & 0 \tabularnewline
8 & 0.836881 & 6.4282 & 0 \tabularnewline
9 & -0.684506 & -5.2578 & 1e-06 \tabularnewline
10 & 0.561787 & 4.3152 & 3.1e-05 \tabularnewline
11 & -0.678881 & -5.2146 & 1e-06 \tabularnewline
12 & 0.758438 & 5.8257 & 0 \tabularnewline
13 & -0.619815 & -4.7609 & 6e-06 \tabularnewline
14 & 0.515594 & 3.9604 & 0.000102 \tabularnewline
15 & -0.615526 & -4.7279 & 7e-06 \tabularnewline
16 & 0.684449 & 5.2574 & 1e-06 \tabularnewline
17 & -0.5565 & -4.2746 & 3.5e-05 \tabularnewline
18 & 0.459234 & 3.5274 & 0.00041 \tabularnewline
19 & -0.544669 & -4.1837 & 4.8e-05 \tabularnewline
20 & 0.599579 & 4.6055 & 1.1e-05 \tabularnewline
21 & -0.484642 & -3.7226 & 0.000221 \tabularnewline
22 & 0.403434 & 3.0988 & 0.001487 \tabularnewline
23 & -0.477059 & -3.6644 & 0.000266 \tabularnewline
24 & 0.517727 & 3.9767 & 9.7e-05 \tabularnewline
25 & -0.432937 & -3.3255 & 0.000761 \tabularnewline
26 & 0.354783 & 2.7251 & 0.004223 \tabularnewline
27 & -0.41343 & -3.1756 & 0.001189 \tabularnewline
28 & 0.467541 & 3.5912 & 0.000336 \tabularnewline
29 & -0.380395 & -2.9219 & 0.002462 \tabularnewline
30 & 0.31156 & 2.3931 & 0.009953 \tabularnewline
31 & -0.36473 & -2.8015 & 0.003434 \tabularnewline
32 & 0.410932 & 3.1564 & 0.001258 \tabularnewline
33 & -0.333893 & -2.5647 & 0.006446 \tabularnewline
34 & 0.269874 & 2.0729 & 0.021277 \tabularnewline
35 & -0.321411 & -2.4688 & 0.008236 \tabularnewline
36 & 0.350929 & 2.6955 & 0.004571 \tabularnewline
37 & -0.27947 & -2.1467 & 0.017972 \tabularnewline
38 & 0.228913 & 1.7583 & 0.04194 \tabularnewline
39 & -0.265005 & -2.0355 & 0.023148 \tabularnewline
40 & 0.284677 & 2.1866 & 0.016373 \tabularnewline
41 & -0.221955 & -1.7049 & 0.04674 \tabularnewline
42 & 0.176742 & 1.3576 & 0.089884 \tabularnewline
43 & -0.205144 & -1.5757 & 0.060217 \tabularnewline
44 & 0.220093 & 1.6906 & 0.048098 \tabularnewline
45 & -0.169528 & -1.3022 & 0.09896 \tabularnewline
46 & 0.138651 & 1.065 & 0.145607 \tabularnewline
47 & -0.160511 & -1.2329 & 0.111249 \tabularnewline
48 & 0.162013 & 1.2444 & 0.109128 \tabularnewline
\hline
\end{tabular}
%Source: https://freestatistics.org/blog/index.php?pk=294035&T=1

[TABLE]
[ROW][C]Autocorrelation Function[/C][/ROW]
[ROW][C]Time lag k[/C][C]ACF(k)[/C][C]T-STAT[/C][C]P-value[/C][/ROW]
[ROW][C]1[/C][C]-0.817076[/C][C]-6.2761[/C][C]0[/C][/ROW]
[ROW][C]2[/C][C]0.669486[/C][C]5.1424[/C][C]2e-06[/C][/ROW]
[ROW][C]3[/C][C]-0.811612[/C][C]-6.2341[/C][C]0[/C][/ROW]
[ROW][C]4[/C][C]0.91336[/C][C]7.0156[/C][C]0[/C][/ROW]
[ROW][C]5[/C][C]-0.750441[/C][C]-5.7642[/C][C]0[/C][/ROW]
[ROW][C]6[/C][C]0.616722[/C][C]4.7371[/C][C]7e-06[/C][/ROW]
[ROW][C]7[/C][C]-0.746005[/C][C]-5.7302[/C][C]0[/C][/ROW]
[ROW][C]8[/C][C]0.836881[/C][C]6.4282[/C][C]0[/C][/ROW]
[ROW][C]9[/C][C]-0.684506[/C][C]-5.2578[/C][C]1e-06[/C][/ROW]
[ROW][C]10[/C][C]0.561787[/C][C]4.3152[/C][C]3.1e-05[/C][/ROW]
[ROW][C]11[/C][C]-0.678881[/C][C]-5.2146[/C][C]1e-06[/C][/ROW]
[ROW][C]12[/C][C]0.758438[/C][C]5.8257[/C][C]0[/C][/ROW]
[ROW][C]13[/C][C]-0.619815[/C][C]-4.7609[/C][C]6e-06[/C][/ROW]
[ROW][C]14[/C][C]0.515594[/C][C]3.9604[/C][C]0.000102[/C][/ROW]
[ROW][C]15[/C][C]-0.615526[/C][C]-4.7279[/C][C]7e-06[/C][/ROW]
[ROW][C]16[/C][C]0.684449[/C][C]5.2574[/C][C]1e-06[/C][/ROW]
[ROW][C]17[/C][C]-0.5565[/C][C]-4.2746[/C][C]3.5e-05[/C][/ROW]
[ROW][C]18[/C][C]0.459234[/C][C]3.5274[/C][C]0.00041[/C][/ROW]
[ROW][C]19[/C][C]-0.544669[/C][C]-4.1837[/C][C]4.8e-05[/C][/ROW]
[ROW][C]20[/C][C]0.599579[/C][C]4.6055[/C][C]1.1e-05[/C][/ROW]
[ROW][C]21[/C][C]-0.484642[/C][C]-3.7226[/C][C]0.000221[/C][/ROW]
[ROW][C]22[/C][C]0.403434[/C][C]3.0988[/C][C]0.001487[/C][/ROW]
[ROW][C]23[/C][C]-0.477059[/C][C]-3.6644[/C][C]0.000266[/C][/ROW]
[ROW][C]24[/C][C]0.517727[/C][C]3.9767[/C][C]9.7e-05[/C][/ROW]
[ROW][C]25[/C][C]-0.432937[/C][C]-3.3255[/C][C]0.000761[/C][/ROW]
[ROW][C]26[/C][C]0.354783[/C][C]2.7251[/C][C]0.004223[/C][/ROW]
[ROW][C]27[/C][C]-0.41343[/C][C]-3.1756[/C][C]0.001189[/C][/ROW]
[ROW][C]28[/C][C]0.467541[/C][C]3.5912[/C][C]0.000336[/C][/ROW]
[ROW][C]29[/C][C]-0.380395[/C][C]-2.9219[/C][C]0.002462[/C][/ROW]
[ROW][C]30[/C][C]0.31156[/C][C]2.3931[/C][C]0.009953[/C][/ROW]
[ROW][C]31[/C][C]-0.36473[/C][C]-2.8015[/C][C]0.003434[/C][/ROW]
[ROW][C]32[/C][C]0.410932[/C][C]3.1564[/C][C]0.001258[/C][/ROW]
[ROW][C]33[/C][C]-0.333893[/C][C]-2.5647[/C][C]0.006446[/C][/ROW]
[ROW][C]34[/C][C]0.269874[/C][C]2.0729[/C][C]0.021277[/C][/ROW]
[ROW][C]35[/C][C]-0.321411[/C][C]-2.4688[/C][C]0.008236[/C][/ROW]
[ROW][C]36[/C][C]0.350929[/C][C]2.6955[/C][C]0.004571[/C][/ROW]
[ROW][C]37[/C][C]-0.27947[/C][C]-2.1467[/C][C]0.017972[/C][/ROW]
[ROW][C]38[/C][C]0.228913[/C][C]1.7583[/C][C]0.04194[/C][/ROW]
[ROW][C]39[/C][C]-0.265005[/C][C]-2.0355[/C][C]0.023148[/C][/ROW]
[ROW][C]40[/C][C]0.284677[/C][C]2.1866[/C][C]0.016373[/C][/ROW]
[ROW][C]41[/C][C]-0.221955[/C][C]-1.7049[/C][C]0.04674[/C][/ROW]
[ROW][C]42[/C][C]0.176742[/C][C]1.3576[/C][C]0.089884[/C][/ROW]
[ROW][C]43[/C][C]-0.205144[/C][C]-1.5757[/C][C]0.060217[/C][/ROW]
[ROW][C]44[/C][C]0.220093[/C][C]1.6906[/C][C]0.048098[/C][/ROW]
[ROW][C]45[/C][C]-0.169528[/C][C]-1.3022[/C][C]0.09896[/C][/ROW]
[ROW][C]46[/C][C]0.138651[/C][C]1.065[/C][C]0.145607[/C][/ROW]
[ROW][C]47[/C][C]-0.160511[/C][C]-1.2329[/C][C]0.111249[/C][/ROW]
[ROW][C]48[/C][C]0.162013[/C][C]1.2444[/C][C]0.109128[/C][/ROW]
[/TABLE]
Source: https://freestatistics.org/blog/index.php?pk=294035&T=1

Globally Unique Identifier (entire table): ba.freestatistics.org/blog/index.php?pk=294035&T=1

As an alternative you can also use a QR Code:  

The GUIDs for individual cells are displayed in the table below:

Autocorrelation Function
Time lag kACF(k)T-STATP-value
1-0.817076-6.27610
20.6694865.14242e-06
3-0.811612-6.23410
40.913367.01560
5-0.750441-5.76420
60.6167224.73717e-06
7-0.746005-5.73020
80.8368816.42820
9-0.684506-5.25781e-06
100.5617874.31523.1e-05
11-0.678881-5.21461e-06
120.7584385.82570
13-0.619815-4.76096e-06
140.5155943.96040.000102
15-0.615526-4.72797e-06
160.6844495.25741e-06
17-0.5565-4.27463.5e-05
180.4592343.52740.00041
19-0.544669-4.18374.8e-05
200.5995794.60551.1e-05
21-0.484642-3.72260.000221
220.4034343.09880.001487
23-0.477059-3.66440.000266
240.5177273.97679.7e-05
25-0.432937-3.32550.000761
260.3547832.72510.004223
27-0.41343-3.17560.001189
280.4675413.59120.000336
29-0.380395-2.92190.002462
300.311562.39310.009953
31-0.36473-2.80150.003434
320.4109323.15640.001258
33-0.333893-2.56470.006446
340.2698742.07290.021277
35-0.321411-2.46880.008236
360.3509292.69550.004571
37-0.27947-2.14670.017972
380.2289131.75830.04194
39-0.265005-2.03550.023148
400.2846772.18660.016373
41-0.221955-1.70490.04674
420.1767421.35760.089884
43-0.205144-1.57570.060217
440.2200931.69060.048098
45-0.169528-1.30220.09896
460.1386511.0650.145607
47-0.160511-1.23290.111249
480.1620131.24440.109128


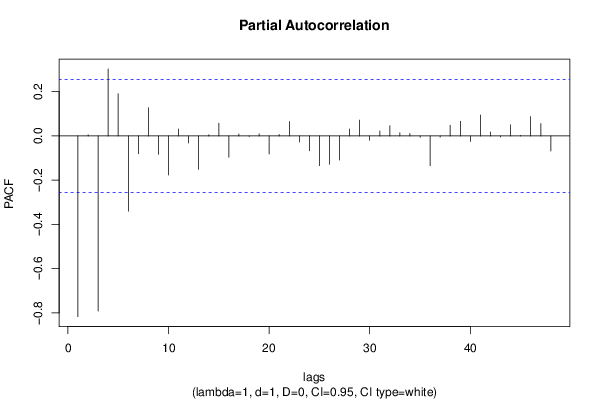
Partial Autocorrelation Function
Time lag kPACF(k)T-STATP-value
1-0.817076-6.27610
20.0056340.04330.482815
3-0.791483-6.07950
40.302922.32680.011715
50.190511.46330.074342
6-0.340098-2.61230.005694
7-0.080891-0.62130.268386
80.1275310.97960.165646
9-0.082843-0.63630.263511
10-0.176985-1.35940.089589
110.0315450.24230.404692
12-0.031707-0.24350.404215
13-0.150628-1.1570.125968
140.0054880.04220.483259
150.0574210.44110.330392
16-0.096159-0.73860.231536
170.0088390.06790.473051
18-0.002474-0.0190.49245
190.0093550.07190.471478
20-0.08199-0.62980.265637
210.0067520.05190.479406
220.0649770.49910.309782
23-0.027123-0.20830.417843
24-0.066879-0.51370.304687
25-0.134128-1.03030.153548
26-0.128215-0.98480.164363
27-0.109019-0.83740.202875
280.0314790.24180.404888
290.0717450.55110.29183
30-0.019186-0.14740.441672
310.0220870.16970.432933
320.0463760.35620.361474
330.0143480.11020.456309
340.0107720.08270.467169
35-0.006103-0.04690.481385
36-0.134851-1.03580.152259
37-0.005335-0.0410.483726
380.0480450.3690.356709
390.066820.51330.304845
40-0.025488-0.19580.422729
410.0949680.72950.234303
420.0177420.13630.446031
43-0.004879-0.03750.485115
440.0500570.38450.350997
450.0024690.0190.492467
460.087490.6720.252095
470.0556380.42740.335335
48-0.067884-0.52140.302011

\begin{tabular}{lllllllll}
\hline
Partial Autocorrelation Function \tabularnewline
Time lag k & PACF(k) & T-STAT & P-value \tabularnewline
1 & -0.817076 & -6.2761 & 0 \tabularnewline
2 & 0.005634 & 0.0433 & 0.482815 \tabularnewline
3 & -0.791483 & -6.0795 & 0 \tabularnewline
4 & 0.30292 & 2.3268 & 0.011715 \tabularnewline
5 & 0.19051 & 1.4633 & 0.074342 \tabularnewline
6 & -0.340098 & -2.6123 & 0.005694 \tabularnewline
7 & -0.080891 & -0.6213 & 0.268386 \tabularnewline
8 & 0.127531 & 0.9796 & 0.165646 \tabularnewline
9 & -0.082843 & -0.6363 & 0.263511 \tabularnewline
10 & -0.176985 & -1.3594 & 0.089589 \tabularnewline
11 & 0.031545 & 0.2423 & 0.404692 \tabularnewline
12 & -0.031707 & -0.2435 & 0.404215 \tabularnewline
13 & -0.150628 & -1.157 & 0.125968 \tabularnewline
14 & 0.005488 & 0.0422 & 0.483259 \tabularnewline
15 & 0.057421 & 0.4411 & 0.330392 \tabularnewline
16 & -0.096159 & -0.7386 & 0.231536 \tabularnewline
17 & 0.008839 & 0.0679 & 0.473051 \tabularnewline
18 & -0.002474 & -0.019 & 0.49245 \tabularnewline
19 & 0.009355 & 0.0719 & 0.471478 \tabularnewline
20 & -0.08199 & -0.6298 & 0.265637 \tabularnewline
21 & 0.006752 & 0.0519 & 0.479406 \tabularnewline
22 & 0.064977 & 0.4991 & 0.309782 \tabularnewline
23 & -0.027123 & -0.2083 & 0.417843 \tabularnewline
24 & -0.066879 & -0.5137 & 0.304687 \tabularnewline
25 & -0.134128 & -1.0303 & 0.153548 \tabularnewline
26 & -0.128215 & -0.9848 & 0.164363 \tabularnewline
27 & -0.109019 & -0.8374 & 0.202875 \tabularnewline
28 & 0.031479 & 0.2418 & 0.404888 \tabularnewline
29 & 0.071745 & 0.5511 & 0.29183 \tabularnewline
30 & -0.019186 & -0.1474 & 0.441672 \tabularnewline
31 & 0.022087 & 0.1697 & 0.432933 \tabularnewline
32 & 0.046376 & 0.3562 & 0.361474 \tabularnewline
33 & 0.014348 & 0.1102 & 0.456309 \tabularnewline
34 & 0.010772 & 0.0827 & 0.467169 \tabularnewline
35 & -0.006103 & -0.0469 & 0.481385 \tabularnewline
36 & -0.134851 & -1.0358 & 0.152259 \tabularnewline
37 & -0.005335 & -0.041 & 0.483726 \tabularnewline
38 & 0.048045 & 0.369 & 0.356709 \tabularnewline
39 & 0.06682 & 0.5133 & 0.304845 \tabularnewline
40 & -0.025488 & -0.1958 & 0.422729 \tabularnewline
41 & 0.094968 & 0.7295 & 0.234303 \tabularnewline
42 & 0.017742 & 0.1363 & 0.446031 \tabularnewline
43 & -0.004879 & -0.0375 & 0.485115 \tabularnewline
44 & 0.050057 & 0.3845 & 0.350997 \tabularnewline
45 & 0.002469 & 0.019 & 0.492467 \tabularnewline
46 & 0.08749 & 0.672 & 0.252095 \tabularnewline
47 & 0.055638 & 0.4274 & 0.335335 \tabularnewline
48 & -0.067884 & -0.5214 & 0.302011 \tabularnewline
\hline
\end{tabular}
%Source: https://freestatistics.org/blog/index.php?pk=294035&T=2

[TABLE]
[ROW][C]Partial Autocorrelation Function[/C][/ROW]
[ROW][C]Time lag k[/C][C]PACF(k)[/C][C]T-STAT[/C][C]P-value[/C][/ROW]
[ROW][C]1[/C][C]-0.817076[/C][C]-6.2761[/C][C]0[/C][/ROW]
[ROW][C]2[/C][C]0.005634[/C][C]0.0433[/C][C]0.482815[/C][/ROW]
[ROW][C]3[/C][C]-0.791483[/C][C]-6.0795[/C][C]0[/C][/ROW]
[ROW][C]4[/C][C]0.30292[/C][C]2.3268[/C][C]0.011715[/C][/ROW]
[ROW][C]5[/C][C]0.19051[/C][C]1.4633[/C][C]0.074342[/C][/ROW]
[ROW][C]6[/C][C]-0.340098[/C][C]-2.6123[/C][C]0.005694[/C][/ROW]
[ROW][C]7[/C][C]-0.080891[/C][C]-0.6213[/C][C]0.268386[/C][/ROW]
[ROW][C]8[/C][C]0.127531[/C][C]0.9796[/C][C]0.165646[/C][/ROW]
[ROW][C]9[/C][C]-0.082843[/C][C]-0.6363[/C][C]0.263511[/C][/ROW]
[ROW][C]10[/C][C]-0.176985[/C][C]-1.3594[/C][C]0.089589[/C][/ROW]
[ROW][C]11[/C][C]0.031545[/C][C]0.2423[/C][C]0.404692[/C][/ROW]
[ROW][C]12[/C][C]-0.031707[/C][C]-0.2435[/C][C]0.404215[/C][/ROW]
[ROW][C]13[/C][C]-0.150628[/C][C]-1.157[/C][C]0.125968[/C][/ROW]
[ROW][C]14[/C][C]0.005488[/C][C]0.0422[/C][C]0.483259[/C][/ROW]
[ROW][C]15[/C][C]0.057421[/C][C]0.4411[/C][C]0.330392[/C][/ROW]
[ROW][C]16[/C][C]-0.096159[/C][C]-0.7386[/C][C]0.231536[/C][/ROW]
[ROW][C]17[/C][C]0.008839[/C][C]0.0679[/C][C]0.473051[/C][/ROW]
[ROW][C]18[/C][C]-0.002474[/C][C]-0.019[/C][C]0.49245[/C][/ROW]
[ROW][C]19[/C][C]0.009355[/C][C]0.0719[/C][C]0.471478[/C][/ROW]
[ROW][C]20[/C][C]-0.08199[/C][C]-0.6298[/C][C]0.265637[/C][/ROW]
[ROW][C]21[/C][C]0.006752[/C][C]0.0519[/C][C]0.479406[/C][/ROW]
[ROW][C]22[/C][C]0.064977[/C][C]0.4991[/C][C]0.309782[/C][/ROW]
[ROW][C]23[/C][C]-0.027123[/C][C]-0.2083[/C][C]0.417843[/C][/ROW]
[ROW][C]24[/C][C]-0.066879[/C][C]-0.5137[/C][C]0.304687[/C][/ROW]
[ROW][C]25[/C][C]-0.134128[/C][C]-1.0303[/C][C]0.153548[/C][/ROW]
[ROW][C]26[/C][C]-0.128215[/C][C]-0.9848[/C][C]0.164363[/C][/ROW]
[ROW][C]27[/C][C]-0.109019[/C][C]-0.8374[/C][C]0.202875[/C][/ROW]
[ROW][C]28[/C][C]0.031479[/C][C]0.2418[/C][C]0.404888[/C][/ROW]
[ROW][C]29[/C][C]0.071745[/C][C]0.5511[/C][C]0.29183[/C][/ROW]
[ROW][C]30[/C][C]-0.019186[/C][C]-0.1474[/C][C]0.441672[/C][/ROW]
[ROW][C]31[/C][C]0.022087[/C][C]0.1697[/C][C]0.432933[/C][/ROW]
[ROW][C]32[/C][C]0.046376[/C][C]0.3562[/C][C]0.361474[/C][/ROW]
[ROW][C]33[/C][C]0.014348[/C][C]0.1102[/C][C]0.456309[/C][/ROW]
[ROW][C]34[/C][C]0.010772[/C][C]0.0827[/C][C]0.467169[/C][/ROW]
[ROW][C]35[/C][C]-0.006103[/C][C]-0.0469[/C][C]0.481385[/C][/ROW]
[ROW][C]36[/C][C]-0.134851[/C][C]-1.0358[/C][C]0.152259[/C][/ROW]
[ROW][C]37[/C][C]-0.005335[/C][C]-0.041[/C][C]0.483726[/C][/ROW]
[ROW][C]38[/C][C]0.048045[/C][C]0.369[/C][C]0.356709[/C][/ROW]
[ROW][C]39[/C][C]0.06682[/C][C]0.5133[/C][C]0.304845[/C][/ROW]
[ROW][C]40[/C][C]-0.025488[/C][C]-0.1958[/C][C]0.422729[/C][/ROW]
[ROW][C]41[/C][C]0.094968[/C][C]0.7295[/C][C]0.234303[/C][/ROW]
[ROW][C]42[/C][C]0.017742[/C][C]0.1363[/C][C]0.446031[/C][/ROW]
[ROW][C]43[/C][C]-0.004879[/C][C]-0.0375[/C][C]0.485115[/C][/ROW]
[ROW][C]44[/C][C]0.050057[/C][C]0.3845[/C][C]0.350997[/C][/ROW]
[ROW][C]45[/C][C]0.002469[/C][C]0.019[/C][C]0.492467[/C][/ROW]
[ROW][C]46[/C][C]0.08749[/C][C]0.672[/C][C]0.252095[/C][/ROW]
[ROW][C]47[/C][C]0.055638[/C][C]0.4274[/C][C]0.335335[/C][/ROW]
[ROW][C]48[/C][C]-0.067884[/C][C]-0.5214[/C][C]0.302011[/C][/ROW]
[/TABLE]
Source: https://freestatistics.org/blog/index.php?pk=294035&T=2

Globally Unique Identifier (entire table): ba.freestatistics.org/blog/index.php?pk=294035&T=2

As an alternative you can also use a QR Code:  

The GUIDs for individual cells are displayed in the table below:

Partial Autocorrelation Function
Time lag kPACF(k)T-STATP-value
1-0.817076-6.27610
20.0056340.04330.482815
3-0.791483-6.07950
40.302922.32680.011715
50.190511.46330.074342
6-0.340098-2.61230.005694
7-0.080891-0.62130.268386
80.1275310.97960.165646
9-0.082843-0.63630.263511
10-0.176985-1.35940.089589
110.0315450.24230.404692
12-0.031707-0.24350.404215
13-0.150628-1.1570.125968
140.0054880.04220.483259
150.0574210.44110.330392
16-0.096159-0.73860.231536
170.0088390.06790.473051
18-0.002474-0.0190.49245
190.0093550.07190.471478
20-0.08199-0.62980.265637
210.0067520.05190.479406
220.0649770.49910.309782
23-0.027123-0.20830.417843
24-0.066879-0.51370.304687
25-0.134128-1.03030.153548
26-0.128215-0.98480.164363
27-0.109019-0.83740.202875
280.0314790.24180.404888
290.0717450.55110.29183
30-0.019186-0.14740.441672
310.0220870.16970.432933
320.0463760.35620.361474
330.0143480.11020.456309
340.0107720.08270.467169
35-0.006103-0.04690.481385
36-0.134851-1.03580.152259
37-0.005335-0.0410.483726
380.0480450.3690.356709
390.066820.51330.304845
40-0.025488-0.19580.422729
410.0949680.72950.234303
420.0177420.13630.446031
43-0.004879-0.03750.485115
440.0500570.38450.350997
450.0024690.0190.492467
460.087490.6720.252095
470.0556380.42740.335335
48-0.067884-0.52140.302011


Parameters (Session):
par1 = 48 ; par2 = 1 ; par3 = 1 ; par4 = 0 ; par5 = 12 ; par6 = White Noise ; par7 = 0.95 ;
Parameters (R input):
par1 = 48 ; par2 = 1 ; par3 = 1 ; par4 = 0 ; par5 = 12 ; par6 = White Noise ; par7 = 0.95 ; par8 = ;
R code (references can be found in the software module):
if (par1 == 'Default') {
par1 = 10*log10(length(x))
} else {
par1 <- as.numeric(par1)
}
par2 <- as.numeric(par2)
par3 <- as.numeric(par3)
par4 <- as.numeric(par4)
par5 <- as.numeric(par5)
if (par6 == 'White Noise') par6 <- 'white' else par6 <- 'ma'
par7 <- as.numeric(par7)
if (par8 != '') par8 <- as.numeric(par8)
x <- na.omit(x)
ox <- x
if (par8 == '') {
if (par2 == 0) {
x <- log(x)
} else {
x <- (x ^ par2 - 1) / par2
}
} else {
x <- log(x,base=par8)
}
if (par3 > 0) x <- diff(x,lag=1,difference=par3)
if (par4 > 0) x <- diff(x,lag=par5,difference=par4)
bitmap(file='picts.png')
op <- par(mfrow=c(2,1))
plot(ox,type='l',main='Original Time Series',xlab='time',ylab='value')
if (par8=='') {
mytitle <- paste('Working Time Series (lambda=',par2,', d=',par3,', D=',par4,')',sep='')
mysub <- paste('(lambda=',par2,', d=',par3,', D=',par4,', CI=', par7, ', CI type=',par6,')',sep='')
} else {
mytitle <- paste('Working Time Series (base=',par8,', d=',par3,', D=',par4,')',sep='')
mysub <- paste('(base=',par8,', d=',par3,', D=',par4,', CI=', par7, ', CI type=',par6,')',sep='')
}
plot(x,type='l', main=mytitle,xlab='time',ylab='value')
par(op)
dev.off()
bitmap(file='pic1.png')
racf <- acf(x, par1, main='Autocorrelation', xlab='time lag', ylab='ACF', ci.type=par6, ci=par7, sub=mysub)
dev.off()
bitmap(file='pic2.png')
rpacf <- pacf(x,par1,main='Partial Autocorrelation',xlab='lags',ylab='PACF',sub=mysub)
dev.off()
(myacf <- c(racf$acf))
(mypacf <- c(rpacf$acf))
lengthx <- length(x)
sqrtn <- sqrt(lengthx)
load(file='createtable')
a<-table.start()
a<-table.row.start(a)
a<-table.element(a,'Autocorrelation Function',4,TRUE)
a<-table.row.end(a)
a<-table.row.start(a)
a<-table.element(a,'Time lag k',header=TRUE)
a<-table.element(a,hyperlink('basics.htm','ACF(k)','click here for more information about the Autocorrelation Function'),header=TRUE)
a<-table.element(a,'T-STAT',header=TRUE)
a<-table.element(a,'P-value',header=TRUE)
a<-table.row.end(a)
for (i in 2:(par1+1)) {
a<-table.row.start(a)
a<-table.element(a,i-1,header=TRUE)
a<-table.element(a,round(myacf[i],6))
mytstat <- myacf[i]*sqrtn
a<-table.element(a,round(mytstat,4))
a<-table.element(a,round(1-pt(abs(mytstat),lengthx),6))
a<-table.row.end(a)
}
a<-table.end(a)
table.save(a,file='mytable.tab')
a<-table.start()
a<-table.row.start(a)
a<-table.element(a,'Partial Autocorrelation Function',4,TRUE)
a<-table.row.end(a)
a<-table.row.start(a)
a<-table.element(a,'Time lag k',header=TRUE)
a<-table.element(a,hyperlink('basics.htm','PACF(k)','click here for more information about the Partial Autocorrelation Function'),header=TRUE)
a<-table.element(a,'T-STAT',header=TRUE)
a<-table.element(a,'P-value',header=TRUE)
a<-table.row.end(a)
for (i in 1:par1) {
a<-table.row.start(a)
a<-table.element(a,i,header=TRUE)
a<-table.element(a,round(mypacf[i],6))
mytstat <- mypacf[i]*sqrtn
a<-table.element(a,round(mytstat,4))
a<-table.element(a,round(1-pt(abs(mytstat),lengthx),6))
a<-table.row.end(a)
}
a<-table.end(a)
table.save(a,file='mytable1.tab')