Free Statistics

of Irreproducible Research!

Author's title

Author*Unverified author*
R Software Modulerwasp_autocorrelation.wasp
Title produced by software(Partial) Autocorrelation Function
Date of computationMon, 14 Mar 2016 20:37:52 +0000
Cite this page as followsStatistical Computations at FreeStatistics.org, Office for Research Development and Education, URL https://freestatistics.org/blog/index.php?v=date/2016/Mar/14/t14579879186aur5mwg6igttwo.htm/, Retrieved Mon, 29 Apr 2024 07:43:09 +0000
Statistical Computations at FreeStatistics.org, Office for Research Development and Education, URL https://freestatistics.org/blog/index.php?pk=294055, Retrieved Mon, 29 Apr 2024 07:43:09 +0000
QR Codes:

Original text written by user:
IsPrivate?No (this computation is public)
User-defined keywords
Estimated Impact91
Family? (F = Feedback message, R = changed R code, M = changed R Module, P = changed Parameters, D = changed Data)
-       [(Partial) Autocorrelation Function] [opgave 7 oef 2.1] [2016-03-14 20:37:52] [d41d8cd98f00b204e9800998ecf8427e] [Current]
- R PD    [(Partial) Autocorrelation Function] [oef 7.2] [2016-05-16 13:38:04] [2bf671dd2119522aabd3d84a723d1bc5]
Feedback Forum

Post a new message
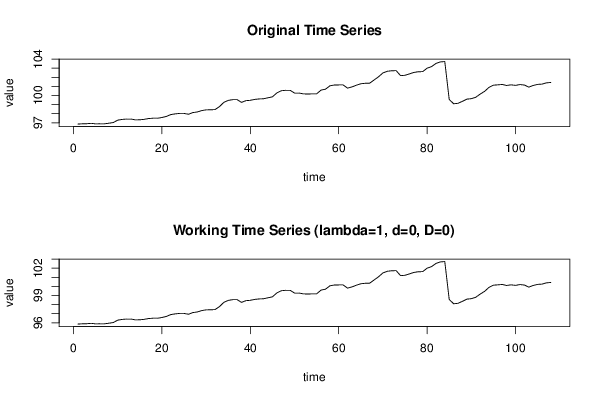
Dataseries X:
96,86
96,89
96,9
96,94
96,88
96,89
96,89
96,95
97,03
97,29
97,37
97,41
97,41
97,32
97,33
97,38
97,47
97,5
97,5
97,58
97,7
97,9
97,98
98,03
98,03
97,94
98,12
98,19
98,34
98,42
98,43
98,45
98,77
99,24
99,46
99,54
99,55
99,24
99,43
99,47
99,57
99,62
99,64
99,75
99,85
100,28
100,52
100,57
100,57
100,27
100,27
100,18
100,16
100,18
100,18
100,59
100,69
101,06
101,15
101,16
101,16
100,81
100,94
101,13
101,29
101,34
101,35
101,7
102,05
102,48
102,66
102,72
102,73
102,18
102,22
102,37
102,53
102,61
102,62
103
103,17
103,52
103,69
103,73
99,57
99,09
99,14
99,36
99,6
99,65
99,8
100,15
100,45
100,89
101,13
101,17
101,21
101,1
101,17
101,11
101,2
101,15
100,92
101,1
101,22
101,25
101,39
101,43


Summary of computational transaction
Raw Inputview raw input (R code)
Raw Outputview raw output of R engine
Computing time1 seconds
R Server'Sir Maurice George Kendall' @ kendall.wessa.net

\begin{tabular}{lllllllll}
\hline
Summary of computational transaction \tabularnewline
Raw Input & view raw input (R code)  \tabularnewline
Raw Output & view raw output of R engine  \tabularnewline
Computing time & 1 seconds \tabularnewline
R Server & 'Sir Maurice George Kendall' @ kendall.wessa.net \tabularnewline
\hline
\end{tabular}
%Source: https://freestatistics.org/blog/index.php?pk=294055&T=0

[TABLE]
[ROW][C]Summary of computational transaction[/C][/ROW]
[ROW][C]Raw Input[/C][C]view raw input (R code) [/C][/ROW]
[ROW][C]Raw Output[/C][C]view raw output of R engine [/C][/ROW]
[ROW][C]Computing time[/C][C]1 seconds[/C][/ROW]
[ROW][C]R Server[/C][C]'Sir Maurice George Kendall' @ kendall.wessa.net[/C][/ROW]
[/TABLE]
Source: https://freestatistics.org/blog/index.php?pk=294055&T=0

Globally Unique Identifier (entire table): ba.freestatistics.org/blog/index.php?pk=294055&T=0

As an alternative you can also use a QR Code:  

The GUIDs for individual cells are displayed in the table below:

Summary of computational transaction
Raw Inputview raw input (R code)
Raw Outputview raw output of R engine
Computing time1 seconds
R Server'Sir Maurice George Kendall' @ kendall.wessa.net


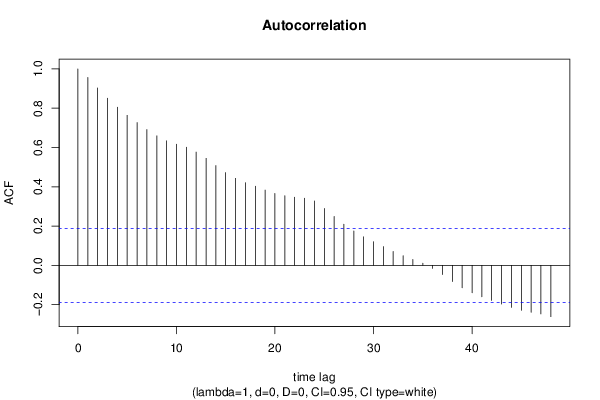
Autocorrelation Function
Time lag kACF(k)T-STATP-value
10.9562189.93730
20.9034419.38880
30.8509478.84330
40.8046618.36230
50.7635667.93520
60.7267037.55210
70.6911787.18290
80.6592036.85060
90.6339496.58820
100.6168856.41090
110.6013196.24910
120.5765445.99160
130.5446615.66030
140.5076955.27610
150.4722364.90762e-06
160.4428214.60196e-06
170.4208654.37381.4e-05
180.4024494.18242.9e-05
190.3830373.98066.2e-05
200.3658493.8020.000119
210.3542153.68110.000182
220.3471963.60820.000234
230.341353.54740.000288
240.3273213.40160.00047
250.2899063.01280.001612
260.2487752.58530.00553
270.2089572.17150.016039
280.1750461.81910.035831
290.1449621.50650.067431
300.1200771.24790.107388
310.0954130.99160.161814
320.0703330.73090.233204
330.0484940.5040.307656
340.029790.30960.378735
350.0108560.11280.455192
36-0.015526-0.16130.43606
37-0.046794-0.48630.313872
38-0.082349-0.85580.197002
39-0.114249-1.18730.118854
40-0.13924-1.4470.075393
41-0.159931-1.66210.049701
42-0.178389-1.85390.033243
43-0.196529-2.04240.021775
44-0.214027-2.22420.014107
45-0.228893-2.37870.009564
46-0.239306-2.48690.007207
47-0.247098-2.56790.005799
48-0.261247-2.7150.003859

\begin{tabular}{lllllllll}
\hline
Autocorrelation Function \tabularnewline
Time lag k & ACF(k) & T-STAT & P-value \tabularnewline
1 & 0.956218 & 9.9373 & 0 \tabularnewline
2 & 0.903441 & 9.3888 & 0 \tabularnewline
3 & 0.850947 & 8.8433 & 0 \tabularnewline
4 & 0.804661 & 8.3623 & 0 \tabularnewline
5 & 0.763566 & 7.9352 & 0 \tabularnewline
6 & 0.726703 & 7.5521 & 0 \tabularnewline
7 & 0.691178 & 7.1829 & 0 \tabularnewline
8 & 0.659203 & 6.8506 & 0 \tabularnewline
9 & 0.633949 & 6.5882 & 0 \tabularnewline
10 & 0.616885 & 6.4109 & 0 \tabularnewline
11 & 0.601319 & 6.2491 & 0 \tabularnewline
12 & 0.576544 & 5.9916 & 0 \tabularnewline
13 & 0.544661 & 5.6603 & 0 \tabularnewline
14 & 0.507695 & 5.2761 & 0 \tabularnewline
15 & 0.472236 & 4.9076 & 2e-06 \tabularnewline
16 & 0.442821 & 4.6019 & 6e-06 \tabularnewline
17 & 0.420865 & 4.3738 & 1.4e-05 \tabularnewline
18 & 0.402449 & 4.1824 & 2.9e-05 \tabularnewline
19 & 0.383037 & 3.9806 & 6.2e-05 \tabularnewline
20 & 0.365849 & 3.802 & 0.000119 \tabularnewline
21 & 0.354215 & 3.6811 & 0.000182 \tabularnewline
22 & 0.347196 & 3.6082 & 0.000234 \tabularnewline
23 & 0.34135 & 3.5474 & 0.000288 \tabularnewline
24 & 0.327321 & 3.4016 & 0.00047 \tabularnewline
25 & 0.289906 & 3.0128 & 0.001612 \tabularnewline
26 & 0.248775 & 2.5853 & 0.00553 \tabularnewline
27 & 0.208957 & 2.1715 & 0.016039 \tabularnewline
28 & 0.175046 & 1.8191 & 0.035831 \tabularnewline
29 & 0.144962 & 1.5065 & 0.067431 \tabularnewline
30 & 0.120077 & 1.2479 & 0.107388 \tabularnewline
31 & 0.095413 & 0.9916 & 0.161814 \tabularnewline
32 & 0.070333 & 0.7309 & 0.233204 \tabularnewline
33 & 0.048494 & 0.504 & 0.307656 \tabularnewline
34 & 0.02979 & 0.3096 & 0.378735 \tabularnewline
35 & 0.010856 & 0.1128 & 0.455192 \tabularnewline
36 & -0.015526 & -0.1613 & 0.43606 \tabularnewline
37 & -0.046794 & -0.4863 & 0.313872 \tabularnewline
38 & -0.082349 & -0.8558 & 0.197002 \tabularnewline
39 & -0.114249 & -1.1873 & 0.118854 \tabularnewline
40 & -0.13924 & -1.447 & 0.075393 \tabularnewline
41 & -0.159931 & -1.6621 & 0.049701 \tabularnewline
42 & -0.178389 & -1.8539 & 0.033243 \tabularnewline
43 & -0.196529 & -2.0424 & 0.021775 \tabularnewline
44 & -0.214027 & -2.2242 & 0.014107 \tabularnewline
45 & -0.228893 & -2.3787 & 0.009564 \tabularnewline
46 & -0.239306 & -2.4869 & 0.007207 \tabularnewline
47 & -0.247098 & -2.5679 & 0.005799 \tabularnewline
48 & -0.261247 & -2.715 & 0.003859 \tabularnewline
\hline
\end{tabular}
%Source: https://freestatistics.org/blog/index.php?pk=294055&T=1

[TABLE]
[ROW][C]Autocorrelation Function[/C][/ROW]
[ROW][C]Time lag k[/C][C]ACF(k)[/C][C]T-STAT[/C][C]P-value[/C][/ROW]
[ROW][C]1[/C][C]0.956218[/C][C]9.9373[/C][C]0[/C][/ROW]
[ROW][C]2[/C][C]0.903441[/C][C]9.3888[/C][C]0[/C][/ROW]
[ROW][C]3[/C][C]0.850947[/C][C]8.8433[/C][C]0[/C][/ROW]
[ROW][C]4[/C][C]0.804661[/C][C]8.3623[/C][C]0[/C][/ROW]
[ROW][C]5[/C][C]0.763566[/C][C]7.9352[/C][C]0[/C][/ROW]
[ROW][C]6[/C][C]0.726703[/C][C]7.5521[/C][C]0[/C][/ROW]
[ROW][C]7[/C][C]0.691178[/C][C]7.1829[/C][C]0[/C][/ROW]
[ROW][C]8[/C][C]0.659203[/C][C]6.8506[/C][C]0[/C][/ROW]
[ROW][C]9[/C][C]0.633949[/C][C]6.5882[/C][C]0[/C][/ROW]
[ROW][C]10[/C][C]0.616885[/C][C]6.4109[/C][C]0[/C][/ROW]
[ROW][C]11[/C][C]0.601319[/C][C]6.2491[/C][C]0[/C][/ROW]
[ROW][C]12[/C][C]0.576544[/C][C]5.9916[/C][C]0[/C][/ROW]
[ROW][C]13[/C][C]0.544661[/C][C]5.6603[/C][C]0[/C][/ROW]
[ROW][C]14[/C][C]0.507695[/C][C]5.2761[/C][C]0[/C][/ROW]
[ROW][C]15[/C][C]0.472236[/C][C]4.9076[/C][C]2e-06[/C][/ROW]
[ROW][C]16[/C][C]0.442821[/C][C]4.6019[/C][C]6e-06[/C][/ROW]
[ROW][C]17[/C][C]0.420865[/C][C]4.3738[/C][C]1.4e-05[/C][/ROW]
[ROW][C]18[/C][C]0.402449[/C][C]4.1824[/C][C]2.9e-05[/C][/ROW]
[ROW][C]19[/C][C]0.383037[/C][C]3.9806[/C][C]6.2e-05[/C][/ROW]
[ROW][C]20[/C][C]0.365849[/C][C]3.802[/C][C]0.000119[/C][/ROW]
[ROW][C]21[/C][C]0.354215[/C][C]3.6811[/C][C]0.000182[/C][/ROW]
[ROW][C]22[/C][C]0.347196[/C][C]3.6082[/C][C]0.000234[/C][/ROW]
[ROW][C]23[/C][C]0.34135[/C][C]3.5474[/C][C]0.000288[/C][/ROW]
[ROW][C]24[/C][C]0.327321[/C][C]3.4016[/C][C]0.00047[/C][/ROW]
[ROW][C]25[/C][C]0.289906[/C][C]3.0128[/C][C]0.001612[/C][/ROW]
[ROW][C]26[/C][C]0.248775[/C][C]2.5853[/C][C]0.00553[/C][/ROW]
[ROW][C]27[/C][C]0.208957[/C][C]2.1715[/C][C]0.016039[/C][/ROW]
[ROW][C]28[/C][C]0.175046[/C][C]1.8191[/C][C]0.035831[/C][/ROW]
[ROW][C]29[/C][C]0.144962[/C][C]1.5065[/C][C]0.067431[/C][/ROW]
[ROW][C]30[/C][C]0.120077[/C][C]1.2479[/C][C]0.107388[/C][/ROW]
[ROW][C]31[/C][C]0.095413[/C][C]0.9916[/C][C]0.161814[/C][/ROW]
[ROW][C]32[/C][C]0.070333[/C][C]0.7309[/C][C]0.233204[/C][/ROW]
[ROW][C]33[/C][C]0.048494[/C][C]0.504[/C][C]0.307656[/C][/ROW]
[ROW][C]34[/C][C]0.02979[/C][C]0.3096[/C][C]0.378735[/C][/ROW]
[ROW][C]35[/C][C]0.010856[/C][C]0.1128[/C][C]0.455192[/C][/ROW]
[ROW][C]36[/C][C]-0.015526[/C][C]-0.1613[/C][C]0.43606[/C][/ROW]
[ROW][C]37[/C][C]-0.046794[/C][C]-0.4863[/C][C]0.313872[/C][/ROW]
[ROW][C]38[/C][C]-0.082349[/C][C]-0.8558[/C][C]0.197002[/C][/ROW]
[ROW][C]39[/C][C]-0.114249[/C][C]-1.1873[/C][C]0.118854[/C][/ROW]
[ROW][C]40[/C][C]-0.13924[/C][C]-1.447[/C][C]0.075393[/C][/ROW]
[ROW][C]41[/C][C]-0.159931[/C][C]-1.6621[/C][C]0.049701[/C][/ROW]
[ROW][C]42[/C][C]-0.178389[/C][C]-1.8539[/C][C]0.033243[/C][/ROW]
[ROW][C]43[/C][C]-0.196529[/C][C]-2.0424[/C][C]0.021775[/C][/ROW]
[ROW][C]44[/C][C]-0.214027[/C][C]-2.2242[/C][C]0.014107[/C][/ROW]
[ROW][C]45[/C][C]-0.228893[/C][C]-2.3787[/C][C]0.009564[/C][/ROW]
[ROW][C]46[/C][C]-0.239306[/C][C]-2.4869[/C][C]0.007207[/C][/ROW]
[ROW][C]47[/C][C]-0.247098[/C][C]-2.5679[/C][C]0.005799[/C][/ROW]
[ROW][C]48[/C][C]-0.261247[/C][C]-2.715[/C][C]0.003859[/C][/ROW]
[/TABLE]
Source: https://freestatistics.org/blog/index.php?pk=294055&T=1

Globally Unique Identifier (entire table): ba.freestatistics.org/blog/index.php?pk=294055&T=1

As an alternative you can also use a QR Code:  

The GUIDs for individual cells are displayed in the table below:

Autocorrelation Function
Time lag kACF(k)T-STATP-value
10.9562189.93730
20.9034419.38880
30.8509478.84330
40.8046618.36230
50.7635667.93520
60.7267037.55210
70.6911787.18290
80.6592036.85060
90.6339496.58820
100.6168856.41090
110.6013196.24910
120.5765445.99160
130.5446615.66030
140.5076955.27610
150.4722364.90762e-06
160.4428214.60196e-06
170.4208654.37381.4e-05
180.4024494.18242.9e-05
190.3830373.98066.2e-05
200.3658493.8020.000119
210.3542153.68110.000182
220.3471963.60820.000234
230.341353.54740.000288
240.3273213.40160.00047
250.2899063.01280.001612
260.2487752.58530.00553
270.2089572.17150.016039
280.1750461.81910.035831
290.1449621.50650.067431
300.1200771.24790.107388
310.0954130.99160.161814
320.0703330.73090.233204
330.0484940.5040.307656
340.029790.30960.378735
350.0108560.11280.455192
36-0.015526-0.16130.43606
37-0.046794-0.48630.313872
38-0.082349-0.85580.197002
39-0.114249-1.18730.118854
40-0.13924-1.4470.075393
41-0.159931-1.66210.049701
42-0.178389-1.85390.033243
43-0.196529-2.04240.021775
44-0.214027-2.22420.014107
45-0.228893-2.37870.009564
46-0.239306-2.48690.007207
47-0.247098-2.56790.005799
48-0.261247-2.7150.003859


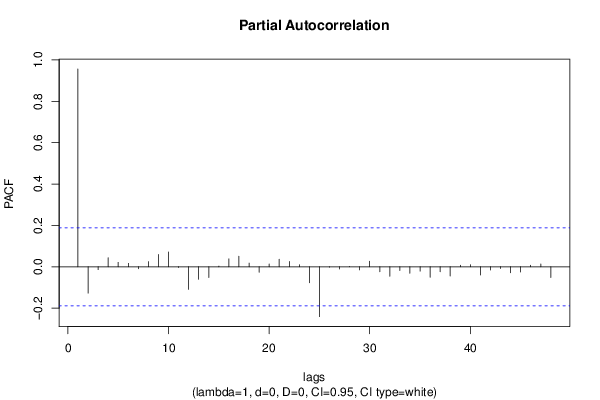
Partial Autocorrelation Function
Time lag kPACF(k)T-STATP-value
10.9562189.93730
2-0.12742-1.32420.094118
3-0.013943-0.14490.442532
40.0435680.45280.325809
50.0214530.22290.411998
60.016490.17140.432128
7-0.009917-0.10310.459051
80.0249940.25970.397776
90.0595760.61910.268567
100.0715290.74330.229442
11-0.0036-0.03740.485112
12-0.109258-1.13540.129353
13-0.05995-0.6230.267294
14-0.051793-0.53820.295757
150.0033910.03520.485976
160.0382910.39790.345734
170.0513480.53360.29735
180.017780.18480.426875
19-0.026429-0.27470.392054
200.0134370.13960.444602
210.0360420.37460.354361
220.0251670.26150.397088
230.0099720.10360.458828
24-0.077463-0.8050.211289
25-0.241059-2.50520.006866
26-0.001637-0.0170.49323
27-0.011154-0.11590.453968
280.0017510.01820.492757
29-0.015112-0.1570.43775
300.0270950.28160.389402
31-0.024062-0.25010.401507
32-0.046111-0.47920.316384
33-0.017789-0.18490.426841
34-0.031569-0.32810.371745
35-0.020947-0.21770.414043
36-0.050463-0.52440.300527
37-0.023761-0.24690.402715
38-0.044656-0.46410.321764
390.0074250.07720.469318
400.0100020.10390.458703
41-0.039527-0.41080.341026
42-0.01555-0.16160.43596
43-0.008629-0.08970.464355
44-0.029217-0.30360.380995
45-0.025342-0.26340.396388
460.0074710.07760.469128
470.0134870.14020.444398
48-0.051904-0.53940.295359

\begin{tabular}{lllllllll}
\hline
Partial Autocorrelation Function \tabularnewline
Time lag k & PACF(k) & T-STAT & P-value \tabularnewline
1 & 0.956218 & 9.9373 & 0 \tabularnewline
2 & -0.12742 & -1.3242 & 0.094118 \tabularnewline
3 & -0.013943 & -0.1449 & 0.442532 \tabularnewline
4 & 0.043568 & 0.4528 & 0.325809 \tabularnewline
5 & 0.021453 & 0.2229 & 0.411998 \tabularnewline
6 & 0.01649 & 0.1714 & 0.432128 \tabularnewline
7 & -0.009917 & -0.1031 & 0.459051 \tabularnewline
8 & 0.024994 & 0.2597 & 0.397776 \tabularnewline
9 & 0.059576 & 0.6191 & 0.268567 \tabularnewline
10 & 0.071529 & 0.7433 & 0.229442 \tabularnewline
11 & -0.0036 & -0.0374 & 0.485112 \tabularnewline
12 & -0.109258 & -1.1354 & 0.129353 \tabularnewline
13 & -0.05995 & -0.623 & 0.267294 \tabularnewline
14 & -0.051793 & -0.5382 & 0.295757 \tabularnewline
15 & 0.003391 & 0.0352 & 0.485976 \tabularnewline
16 & 0.038291 & 0.3979 & 0.345734 \tabularnewline
17 & 0.051348 & 0.5336 & 0.29735 \tabularnewline
18 & 0.01778 & 0.1848 & 0.426875 \tabularnewline
19 & -0.026429 & -0.2747 & 0.392054 \tabularnewline
20 & 0.013437 & 0.1396 & 0.444602 \tabularnewline
21 & 0.036042 & 0.3746 & 0.354361 \tabularnewline
22 & 0.025167 & 0.2615 & 0.397088 \tabularnewline
23 & 0.009972 & 0.1036 & 0.458828 \tabularnewline
24 & -0.077463 & -0.805 & 0.211289 \tabularnewline
25 & -0.241059 & -2.5052 & 0.006866 \tabularnewline
26 & -0.001637 & -0.017 & 0.49323 \tabularnewline
27 & -0.011154 & -0.1159 & 0.453968 \tabularnewline
28 & 0.001751 & 0.0182 & 0.492757 \tabularnewline
29 & -0.015112 & -0.157 & 0.43775 \tabularnewline
30 & 0.027095 & 0.2816 & 0.389402 \tabularnewline
31 & -0.024062 & -0.2501 & 0.401507 \tabularnewline
32 & -0.046111 & -0.4792 & 0.316384 \tabularnewline
33 & -0.017789 & -0.1849 & 0.426841 \tabularnewline
34 & -0.031569 & -0.3281 & 0.371745 \tabularnewline
35 & -0.020947 & -0.2177 & 0.414043 \tabularnewline
36 & -0.050463 & -0.5244 & 0.300527 \tabularnewline
37 & -0.023761 & -0.2469 & 0.402715 \tabularnewline
38 & -0.044656 & -0.4641 & 0.321764 \tabularnewline
39 & 0.007425 & 0.0772 & 0.469318 \tabularnewline
40 & 0.010002 & 0.1039 & 0.458703 \tabularnewline
41 & -0.039527 & -0.4108 & 0.341026 \tabularnewline
42 & -0.01555 & -0.1616 & 0.43596 \tabularnewline
43 & -0.008629 & -0.0897 & 0.464355 \tabularnewline
44 & -0.029217 & -0.3036 & 0.380995 \tabularnewline
45 & -0.025342 & -0.2634 & 0.396388 \tabularnewline
46 & 0.007471 & 0.0776 & 0.469128 \tabularnewline
47 & 0.013487 & 0.1402 & 0.444398 \tabularnewline
48 & -0.051904 & -0.5394 & 0.295359 \tabularnewline
\hline
\end{tabular}
%Source: https://freestatistics.org/blog/index.php?pk=294055&T=2

[TABLE]
[ROW][C]Partial Autocorrelation Function[/C][/ROW]
[ROW][C]Time lag k[/C][C]PACF(k)[/C][C]T-STAT[/C][C]P-value[/C][/ROW]
[ROW][C]1[/C][C]0.956218[/C][C]9.9373[/C][C]0[/C][/ROW]
[ROW][C]2[/C][C]-0.12742[/C][C]-1.3242[/C][C]0.094118[/C][/ROW]
[ROW][C]3[/C][C]-0.013943[/C][C]-0.1449[/C][C]0.442532[/C][/ROW]
[ROW][C]4[/C][C]0.043568[/C][C]0.4528[/C][C]0.325809[/C][/ROW]
[ROW][C]5[/C][C]0.021453[/C][C]0.2229[/C][C]0.411998[/C][/ROW]
[ROW][C]6[/C][C]0.01649[/C][C]0.1714[/C][C]0.432128[/C][/ROW]
[ROW][C]7[/C][C]-0.009917[/C][C]-0.1031[/C][C]0.459051[/C][/ROW]
[ROW][C]8[/C][C]0.024994[/C][C]0.2597[/C][C]0.397776[/C][/ROW]
[ROW][C]9[/C][C]0.059576[/C][C]0.6191[/C][C]0.268567[/C][/ROW]
[ROW][C]10[/C][C]0.071529[/C][C]0.7433[/C][C]0.229442[/C][/ROW]
[ROW][C]11[/C][C]-0.0036[/C][C]-0.0374[/C][C]0.485112[/C][/ROW]
[ROW][C]12[/C][C]-0.109258[/C][C]-1.1354[/C][C]0.129353[/C][/ROW]
[ROW][C]13[/C][C]-0.05995[/C][C]-0.623[/C][C]0.267294[/C][/ROW]
[ROW][C]14[/C][C]-0.051793[/C][C]-0.5382[/C][C]0.295757[/C][/ROW]
[ROW][C]15[/C][C]0.003391[/C][C]0.0352[/C][C]0.485976[/C][/ROW]
[ROW][C]16[/C][C]0.038291[/C][C]0.3979[/C][C]0.345734[/C][/ROW]
[ROW][C]17[/C][C]0.051348[/C][C]0.5336[/C][C]0.29735[/C][/ROW]
[ROW][C]18[/C][C]0.01778[/C][C]0.1848[/C][C]0.426875[/C][/ROW]
[ROW][C]19[/C][C]-0.026429[/C][C]-0.2747[/C][C]0.392054[/C][/ROW]
[ROW][C]20[/C][C]0.013437[/C][C]0.1396[/C][C]0.444602[/C][/ROW]
[ROW][C]21[/C][C]0.036042[/C][C]0.3746[/C][C]0.354361[/C][/ROW]
[ROW][C]22[/C][C]0.025167[/C][C]0.2615[/C][C]0.397088[/C][/ROW]
[ROW][C]23[/C][C]0.009972[/C][C]0.1036[/C][C]0.458828[/C][/ROW]
[ROW][C]24[/C][C]-0.077463[/C][C]-0.805[/C][C]0.211289[/C][/ROW]
[ROW][C]25[/C][C]-0.241059[/C][C]-2.5052[/C][C]0.006866[/C][/ROW]
[ROW][C]26[/C][C]-0.001637[/C][C]-0.017[/C][C]0.49323[/C][/ROW]
[ROW][C]27[/C][C]-0.011154[/C][C]-0.1159[/C][C]0.453968[/C][/ROW]
[ROW][C]28[/C][C]0.001751[/C][C]0.0182[/C][C]0.492757[/C][/ROW]
[ROW][C]29[/C][C]-0.015112[/C][C]-0.157[/C][C]0.43775[/C][/ROW]
[ROW][C]30[/C][C]0.027095[/C][C]0.2816[/C][C]0.389402[/C][/ROW]
[ROW][C]31[/C][C]-0.024062[/C][C]-0.2501[/C][C]0.401507[/C][/ROW]
[ROW][C]32[/C][C]-0.046111[/C][C]-0.4792[/C][C]0.316384[/C][/ROW]
[ROW][C]33[/C][C]-0.017789[/C][C]-0.1849[/C][C]0.426841[/C][/ROW]
[ROW][C]34[/C][C]-0.031569[/C][C]-0.3281[/C][C]0.371745[/C][/ROW]
[ROW][C]35[/C][C]-0.020947[/C][C]-0.2177[/C][C]0.414043[/C][/ROW]
[ROW][C]36[/C][C]-0.050463[/C][C]-0.5244[/C][C]0.300527[/C][/ROW]
[ROW][C]37[/C][C]-0.023761[/C][C]-0.2469[/C][C]0.402715[/C][/ROW]
[ROW][C]38[/C][C]-0.044656[/C][C]-0.4641[/C][C]0.321764[/C][/ROW]
[ROW][C]39[/C][C]0.007425[/C][C]0.0772[/C][C]0.469318[/C][/ROW]
[ROW][C]40[/C][C]0.010002[/C][C]0.1039[/C][C]0.458703[/C][/ROW]
[ROW][C]41[/C][C]-0.039527[/C][C]-0.4108[/C][C]0.341026[/C][/ROW]
[ROW][C]42[/C][C]-0.01555[/C][C]-0.1616[/C][C]0.43596[/C][/ROW]
[ROW][C]43[/C][C]-0.008629[/C][C]-0.0897[/C][C]0.464355[/C][/ROW]
[ROW][C]44[/C][C]-0.029217[/C][C]-0.3036[/C][C]0.380995[/C][/ROW]
[ROW][C]45[/C][C]-0.025342[/C][C]-0.2634[/C][C]0.396388[/C][/ROW]
[ROW][C]46[/C][C]0.007471[/C][C]0.0776[/C][C]0.469128[/C][/ROW]
[ROW][C]47[/C][C]0.013487[/C][C]0.1402[/C][C]0.444398[/C][/ROW]
[ROW][C]48[/C][C]-0.051904[/C][C]-0.5394[/C][C]0.295359[/C][/ROW]
[/TABLE]
Source: https://freestatistics.org/blog/index.php?pk=294055&T=2

Globally Unique Identifier (entire table): ba.freestatistics.org/blog/index.php?pk=294055&T=2

As an alternative you can also use a QR Code:  

The GUIDs for individual cells are displayed in the table below:

Partial Autocorrelation Function
Time lag kPACF(k)T-STATP-value
10.9562189.93730
2-0.12742-1.32420.094118
3-0.013943-0.14490.442532
40.0435680.45280.325809
50.0214530.22290.411998
60.016490.17140.432128
7-0.009917-0.10310.459051
80.0249940.25970.397776
90.0595760.61910.268567
100.0715290.74330.229442
11-0.0036-0.03740.485112
12-0.109258-1.13540.129353
13-0.05995-0.6230.267294
14-0.051793-0.53820.295757
150.0033910.03520.485976
160.0382910.39790.345734
170.0513480.53360.29735
180.017780.18480.426875
19-0.026429-0.27470.392054
200.0134370.13960.444602
210.0360420.37460.354361
220.0251670.26150.397088
230.0099720.10360.458828
24-0.077463-0.8050.211289
25-0.241059-2.50520.006866
26-0.001637-0.0170.49323
27-0.011154-0.11590.453968
280.0017510.01820.492757
29-0.015112-0.1570.43775
300.0270950.28160.389402
31-0.024062-0.25010.401507
32-0.046111-0.47920.316384
33-0.017789-0.18490.426841
34-0.031569-0.32810.371745
35-0.020947-0.21770.414043
36-0.050463-0.52440.300527
37-0.023761-0.24690.402715
38-0.044656-0.46410.321764
390.0074250.07720.469318
400.0100020.10390.458703
41-0.039527-0.41080.341026
42-0.01555-0.16160.43596
43-0.008629-0.08970.464355
44-0.029217-0.30360.380995
45-0.025342-0.26340.396388
460.0074710.07760.469128
470.0134870.14020.444398
48-0.051904-0.53940.295359


Parameters (Session):
par1 = 48 ; par2 = 1 ; par3 = 0 ; par4 = 0 ; par5 = 12 ; par6 = White Noise ; par7 = 0.95 ;
Parameters (R input):
par1 = 48 ; par2 = 1 ; par3 = 0 ; par4 = 0 ; par5 = 12 ; par6 = White Noise ; par7 = 0.95 ; par8 = ;
R code (references can be found in the software module):
par8 <- ''
par7 <- '0.95'
par6 <- 'White Noise'
par5 <- '12'
par4 <- '0'
par3 <- '0'
par2 <- '1'
par1 <- '48'
if (par1 == 'Default') {
par1 = 10*log10(length(x))
} else {
par1 <- as.numeric(par1)
}
par2 <- as.numeric(par2)
par3 <- as.numeric(par3)
par4 <- as.numeric(par4)
par5 <- as.numeric(par5)
if (par6 == 'White Noise') par6 <- 'white' else par6 <- 'ma'
par7 <- as.numeric(par7)
if (par8 != '') par8 <- as.numeric(par8)
x <- na.omit(x)
ox <- x
if (par8 == '') {
if (par2 == 0) {
x <- log(x)
} else {
x <- (x ^ par2 - 1) / par2
}
} else {
x <- log(x,base=par8)
}
if (par3 > 0) x <- diff(x,lag=1,difference=par3)
if (par4 > 0) x <- diff(x,lag=par5,difference=par4)
bitmap(file='picts.png')
op <- par(mfrow=c(2,1))
plot(ox,type='l',main='Original Time Series',xlab='time',ylab='value')
if (par8=='') {
mytitle <- paste('Working Time Series (lambda=',par2,', d=',par3,', D=',par4,')',sep='')
mysub <- paste('(lambda=',par2,', d=',par3,', D=',par4,', CI=', par7, ', CI type=',par6,')',sep='')
} else {
mytitle <- paste('Working Time Series (base=',par8,', d=',par3,', D=',par4,')',sep='')
mysub <- paste('(base=',par8,', d=',par3,', D=',par4,', CI=', par7, ', CI type=',par6,')',sep='')
}
plot(x,type='l', main=mytitle,xlab='time',ylab='value')
par(op)
dev.off()
bitmap(file='pic1.png')
racf <- acf(x, par1, main='Autocorrelation', xlab='time lag', ylab='ACF', ci.type=par6, ci=par7, sub=mysub)
dev.off()
bitmap(file='pic2.png')
rpacf <- pacf(x,par1,main='Partial Autocorrelation',xlab='lags',ylab='PACF',sub=mysub)
dev.off()
(myacf <- c(racf$acf))
(mypacf <- c(rpacf$acf))
lengthx <- length(x)
sqrtn <- sqrt(lengthx)
load(file='createtable')
a<-table.start()
a<-table.row.start(a)
a<-table.element(a,'Autocorrelation Function',4,TRUE)
a<-table.row.end(a)
a<-table.row.start(a)
a<-table.element(a,'Time lag k',header=TRUE)
a<-table.element(a,hyperlink('basics.htm','ACF(k)','click here for more information about the Autocorrelation Function'),header=TRUE)
a<-table.element(a,'T-STAT',header=TRUE)
a<-table.element(a,'P-value',header=TRUE)
a<-table.row.end(a)
for (i in 2:(par1+1)) {
a<-table.row.start(a)
a<-table.element(a,i-1,header=TRUE)
a<-table.element(a,round(myacf[i],6))
mytstat <- myacf[i]*sqrtn
a<-table.element(a,round(mytstat,4))
a<-table.element(a,round(1-pt(abs(mytstat),lengthx),6))
a<-table.row.end(a)
}
a<-table.end(a)
table.save(a,file='mytable.tab')
a<-table.start()
a<-table.row.start(a)
a<-table.element(a,'Partial Autocorrelation Function',4,TRUE)
a<-table.row.end(a)
a<-table.row.start(a)
a<-table.element(a,'Time lag k',header=TRUE)
a<-table.element(a,hyperlink('basics.htm','PACF(k)','click here for more information about the Partial Autocorrelation Function'),header=TRUE)
a<-table.element(a,'T-STAT',header=TRUE)
a<-table.element(a,'P-value',header=TRUE)
a<-table.row.end(a)
for (i in 1:par1) {
a<-table.row.start(a)
a<-table.element(a,i,header=TRUE)
a<-table.element(a,round(mypacf[i],6))
mytstat <- mypacf[i]*sqrtn
a<-table.element(a,round(mytstat,4))
a<-table.element(a,round(1-pt(abs(mytstat),lengthx),6))
a<-table.row.end(a)
}
a<-table.end(a)
table.save(a,file='mytable1.tab')