Free Statistics

of Irreproducible Research!

Author's title

Author*Unverified author*
R Software Modulerwasp_autocorrelation.wasp
Title produced by software(Partial) Autocorrelation Function
Date of computationMon, 14 Mar 2016 20:39:57 +0000
Cite this page as followsStatistical Computations at FreeStatistics.org, Office for Research Development and Education, URL https://freestatistics.org/blog/index.php?v=date/2016/Mar/14/t1457988040kdgbqsgi4n067f8.htm/, Retrieved Sun, 28 Apr 2024 20:29:02 +0000
Statistical Computations at FreeStatistics.org, Office for Research Development and Education, URL https://freestatistics.org/blog/index.php?pk=294056, Retrieved Sun, 28 Apr 2024 20:29:02 +0000
QR Codes:

Original text written by user:
IsPrivate?No (this computation is public)
User-defined keywords
Estimated Impact68
Family? (F = Feedback message, R = changed R code, M = changed R Module, P = changed Parameters, D = changed Data)
-       [(Partial) Autocorrelation Function] [opgave 7 oef 2.3] [2016-03-14 20:39:57] [d41d8cd98f00b204e9800998ecf8427e] [Current]
Feedback Forum

Post a new message
Dataseries X:
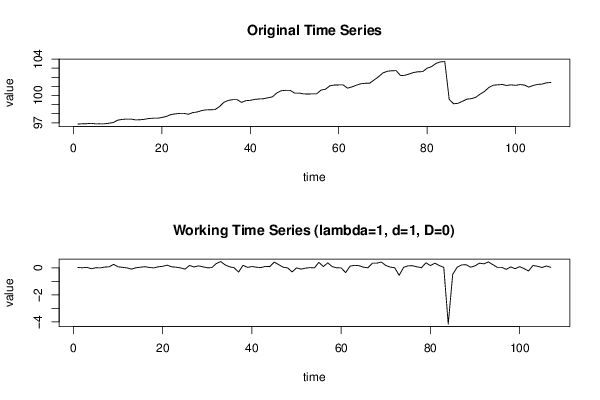
96.86
96.89
96.9
96.94
96.88
96.89
96.89
96.95
97.03
97.29
97.37
97.41
97.41
97.32
97.33
97.38
97.47
97.5
97.5
97.58
97.7
97.9
97.98
98.03
98.03
97.94
98.12
98.19
98.34
98.42
98.43
98.45
98.77
99.24
99.46
99.54
99.55
99.24
99.43
99.47
99.57
99.62
99.64
99.75
99.85
100.28
100.52
100.57
100.57
100.27
100.27
100.18
100.16
100.18
100.18
100.59
100.69
101.06
101.15
101.16
101.16
100.81
100.94
101.13
101.29
101.34
101.35
101.7
102.05
102.48
102.66
102.72
102.73
102.18
102.22
102.37
102.53
102.61
102.62
103
103.17
103.52
103.69
103.73
99.57
99.09
99.14
99.36
99.6
99.65
99.8
100.15
100.45
100.89
101.13
101.17
101.21
101.1
101.17
101.11
101.2
101.15
100.92
101.1
101.22
101.25
101.39
101.43


Summary of computational transaction
Raw Inputview raw input (R code)
Raw Outputview raw output of R engine
Computing time1 seconds
R Server'Gwilym Jenkins' @ jenkins.wessa.net

\begin{tabular}{lllllllll}
\hline
Summary of computational transaction \tabularnewline
Raw Input & view raw input (R code)  \tabularnewline
Raw Output & view raw output of R engine  \tabularnewline
Computing time & 1 seconds \tabularnewline
R Server & 'Gwilym Jenkins' @ jenkins.wessa.net \tabularnewline
\hline
\end{tabular}
%Source: https://freestatistics.org/blog/index.php?pk=294056&T=0

[TABLE]
[ROW][C]Summary of computational transaction[/C][/ROW]
[ROW][C]Raw Input[/C][C]view raw input (R code) [/C][/ROW]
[ROW][C]Raw Output[/C][C]view raw output of R engine [/C][/ROW]
[ROW][C]Computing time[/C][C]1 seconds[/C][/ROW]
[ROW][C]R Server[/C][C]'Gwilym Jenkins' @ jenkins.wessa.net[/C][/ROW]
[/TABLE]
Source: https://freestatistics.org/blog/index.php?pk=294056&T=0

Globally Unique Identifier (entire table): ba.freestatistics.org/blog/index.php?pk=294056&T=0

As an alternative you can also use a QR Code:  

The GUIDs for individual cells are displayed in the table below:

Summary of computational transaction
Raw Inputview raw input (R code)
Raw Outputview raw output of R engine
Computing time1 seconds
R Server'Gwilym Jenkins' @ jenkins.wessa.net


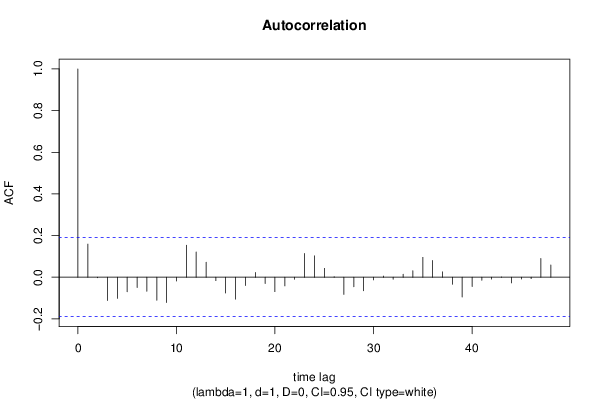
Autocorrelation Function
Time lag kACF(k)T-STATP-value
10.1587721.64240.051726
2-0.002516-0.0260.489642
3-0.111925-1.15780.12477
4-0.101775-1.05280.14741
5-0.06978-0.72180.235992
6-0.049815-0.51530.303706
7-0.067598-0.69920.24296
8-0.110934-1.14750.126864
9-0.121484-1.25660.105811
10-0.018507-0.19140.424272
110.1537031.58990.057402
120.121221.25390.106303
130.0716790.74150.230022
14-0.016554-0.17120.432182
15-0.07635-0.78980.215703
16-0.105279-1.0890.139296
17-0.039679-0.41040.341152
180.0227370.23520.407254
19-0.030232-0.31270.377549
20-0.069452-0.71840.237032
21-0.041697-0.43130.333552
22-0.009859-0.1020.459481
230.1135691.17480.121347
240.1023741.0590.146
250.0422630.43720.331433
260.0018420.01910.492416
27-0.082482-0.85320.197727
28-0.046121-0.47710.31714
29-0.064777-0.67010.252131
30-0.012914-0.13360.446991
310.0051190.0530.478933
32-0.009753-0.10090.459914
330.0144710.14970.440645
340.0305990.31650.376112
350.0952960.98570.16324
360.0798950.82640.205196
370.0255290.26410.396117
38-0.034078-0.35250.362576
39-0.095106-0.98380.16372
40-0.044698-0.46240.322382
41-0.01433-0.14820.441218
42-0.00917-0.09490.462305
430.0013090.01350.49461
44-0.027273-0.28210.389199
45-0.008331-0.08620.465744
46-0.006984-0.07220.471272
470.0901790.93280.176507
480.0586370.60650.272717

\begin{tabular}{lllllllll}
\hline
Autocorrelation Function \tabularnewline
Time lag k & ACF(k) & T-STAT & P-value \tabularnewline
1 & 0.158772 & 1.6424 & 0.051726 \tabularnewline
2 & -0.002516 & -0.026 & 0.489642 \tabularnewline
3 & -0.111925 & -1.1578 & 0.12477 \tabularnewline
4 & -0.101775 & -1.0528 & 0.14741 \tabularnewline
5 & -0.06978 & -0.7218 & 0.235992 \tabularnewline
6 & -0.049815 & -0.5153 & 0.303706 \tabularnewline
7 & -0.067598 & -0.6992 & 0.24296 \tabularnewline
8 & -0.110934 & -1.1475 & 0.126864 \tabularnewline
9 & -0.121484 & -1.2566 & 0.105811 \tabularnewline
10 & -0.018507 & -0.1914 & 0.424272 \tabularnewline
11 & 0.153703 & 1.5899 & 0.057402 \tabularnewline
12 & 0.12122 & 1.2539 & 0.106303 \tabularnewline
13 & 0.071679 & 0.7415 & 0.230022 \tabularnewline
14 & -0.016554 & -0.1712 & 0.432182 \tabularnewline
15 & -0.07635 & -0.7898 & 0.215703 \tabularnewline
16 & -0.105279 & -1.089 & 0.139296 \tabularnewline
17 & -0.039679 & -0.4104 & 0.341152 \tabularnewline
18 & 0.022737 & 0.2352 & 0.407254 \tabularnewline
19 & -0.030232 & -0.3127 & 0.377549 \tabularnewline
20 & -0.069452 & -0.7184 & 0.237032 \tabularnewline
21 & -0.041697 & -0.4313 & 0.333552 \tabularnewline
22 & -0.009859 & -0.102 & 0.459481 \tabularnewline
23 & 0.113569 & 1.1748 & 0.121347 \tabularnewline
24 & 0.102374 & 1.059 & 0.146 \tabularnewline
25 & 0.042263 & 0.4372 & 0.331433 \tabularnewline
26 & 0.001842 & 0.0191 & 0.492416 \tabularnewline
27 & -0.082482 & -0.8532 & 0.197727 \tabularnewline
28 & -0.046121 & -0.4771 & 0.31714 \tabularnewline
29 & -0.064777 & -0.6701 & 0.252131 \tabularnewline
30 & -0.012914 & -0.1336 & 0.446991 \tabularnewline
31 & 0.005119 & 0.053 & 0.478933 \tabularnewline
32 & -0.009753 & -0.1009 & 0.459914 \tabularnewline
33 & 0.014471 & 0.1497 & 0.440645 \tabularnewline
34 & 0.030599 & 0.3165 & 0.376112 \tabularnewline
35 & 0.095296 & 0.9857 & 0.16324 \tabularnewline
36 & 0.079895 & 0.8264 & 0.205196 \tabularnewline
37 & 0.025529 & 0.2641 & 0.396117 \tabularnewline
38 & -0.034078 & -0.3525 & 0.362576 \tabularnewline
39 & -0.095106 & -0.9838 & 0.16372 \tabularnewline
40 & -0.044698 & -0.4624 & 0.322382 \tabularnewline
41 & -0.01433 & -0.1482 & 0.441218 \tabularnewline
42 & -0.00917 & -0.0949 & 0.462305 \tabularnewline
43 & 0.001309 & 0.0135 & 0.49461 \tabularnewline
44 & -0.027273 & -0.2821 & 0.389199 \tabularnewline
45 & -0.008331 & -0.0862 & 0.465744 \tabularnewline
46 & -0.006984 & -0.0722 & 0.471272 \tabularnewline
47 & 0.090179 & 0.9328 & 0.176507 \tabularnewline
48 & 0.058637 & 0.6065 & 0.272717 \tabularnewline
\hline
\end{tabular}
%Source: https://freestatistics.org/blog/index.php?pk=294056&T=1

[TABLE]
[ROW][C]Autocorrelation Function[/C][/ROW]
[ROW][C]Time lag k[/C][C]ACF(k)[/C][C]T-STAT[/C][C]P-value[/C][/ROW]
[ROW][C]1[/C][C]0.158772[/C][C]1.6424[/C][C]0.051726[/C][/ROW]
[ROW][C]2[/C][C]-0.002516[/C][C]-0.026[/C][C]0.489642[/C][/ROW]
[ROW][C]3[/C][C]-0.111925[/C][C]-1.1578[/C][C]0.12477[/C][/ROW]
[ROW][C]4[/C][C]-0.101775[/C][C]-1.0528[/C][C]0.14741[/C][/ROW]
[ROW][C]5[/C][C]-0.06978[/C][C]-0.7218[/C][C]0.235992[/C][/ROW]
[ROW][C]6[/C][C]-0.049815[/C][C]-0.5153[/C][C]0.303706[/C][/ROW]
[ROW][C]7[/C][C]-0.067598[/C][C]-0.6992[/C][C]0.24296[/C][/ROW]
[ROW][C]8[/C][C]-0.110934[/C][C]-1.1475[/C][C]0.126864[/C][/ROW]
[ROW][C]9[/C][C]-0.121484[/C][C]-1.2566[/C][C]0.105811[/C][/ROW]
[ROW][C]10[/C][C]-0.018507[/C][C]-0.1914[/C][C]0.424272[/C][/ROW]
[ROW][C]11[/C][C]0.153703[/C][C]1.5899[/C][C]0.057402[/C][/ROW]
[ROW][C]12[/C][C]0.12122[/C][C]1.2539[/C][C]0.106303[/C][/ROW]
[ROW][C]13[/C][C]0.071679[/C][C]0.7415[/C][C]0.230022[/C][/ROW]
[ROW][C]14[/C][C]-0.016554[/C][C]-0.1712[/C][C]0.432182[/C][/ROW]
[ROW][C]15[/C][C]-0.07635[/C][C]-0.7898[/C][C]0.215703[/C][/ROW]
[ROW][C]16[/C][C]-0.105279[/C][C]-1.089[/C][C]0.139296[/C][/ROW]
[ROW][C]17[/C][C]-0.039679[/C][C]-0.4104[/C][C]0.341152[/C][/ROW]
[ROW][C]18[/C][C]0.022737[/C][C]0.2352[/C][C]0.407254[/C][/ROW]
[ROW][C]19[/C][C]-0.030232[/C][C]-0.3127[/C][C]0.377549[/C][/ROW]
[ROW][C]20[/C][C]-0.069452[/C][C]-0.7184[/C][C]0.237032[/C][/ROW]
[ROW][C]21[/C][C]-0.041697[/C][C]-0.4313[/C][C]0.333552[/C][/ROW]
[ROW][C]22[/C][C]-0.009859[/C][C]-0.102[/C][C]0.459481[/C][/ROW]
[ROW][C]23[/C][C]0.113569[/C][C]1.1748[/C][C]0.121347[/C][/ROW]
[ROW][C]24[/C][C]0.102374[/C][C]1.059[/C][C]0.146[/C][/ROW]
[ROW][C]25[/C][C]0.042263[/C][C]0.4372[/C][C]0.331433[/C][/ROW]
[ROW][C]26[/C][C]0.001842[/C][C]0.0191[/C][C]0.492416[/C][/ROW]
[ROW][C]27[/C][C]-0.082482[/C][C]-0.8532[/C][C]0.197727[/C][/ROW]
[ROW][C]28[/C][C]-0.046121[/C][C]-0.4771[/C][C]0.31714[/C][/ROW]
[ROW][C]29[/C][C]-0.064777[/C][C]-0.6701[/C][C]0.252131[/C][/ROW]
[ROW][C]30[/C][C]-0.012914[/C][C]-0.1336[/C][C]0.446991[/C][/ROW]
[ROW][C]31[/C][C]0.005119[/C][C]0.053[/C][C]0.478933[/C][/ROW]
[ROW][C]32[/C][C]-0.009753[/C][C]-0.1009[/C][C]0.459914[/C][/ROW]
[ROW][C]33[/C][C]0.014471[/C][C]0.1497[/C][C]0.440645[/C][/ROW]
[ROW][C]34[/C][C]0.030599[/C][C]0.3165[/C][C]0.376112[/C][/ROW]
[ROW][C]35[/C][C]0.095296[/C][C]0.9857[/C][C]0.16324[/C][/ROW]
[ROW][C]36[/C][C]0.079895[/C][C]0.8264[/C][C]0.205196[/C][/ROW]
[ROW][C]37[/C][C]0.025529[/C][C]0.2641[/C][C]0.396117[/C][/ROW]
[ROW][C]38[/C][C]-0.034078[/C][C]-0.3525[/C][C]0.362576[/C][/ROW]
[ROW][C]39[/C][C]-0.095106[/C][C]-0.9838[/C][C]0.16372[/C][/ROW]
[ROW][C]40[/C][C]-0.044698[/C][C]-0.4624[/C][C]0.322382[/C][/ROW]
[ROW][C]41[/C][C]-0.01433[/C][C]-0.1482[/C][C]0.441218[/C][/ROW]
[ROW][C]42[/C][C]-0.00917[/C][C]-0.0949[/C][C]0.462305[/C][/ROW]
[ROW][C]43[/C][C]0.001309[/C][C]0.0135[/C][C]0.49461[/C][/ROW]
[ROW][C]44[/C][C]-0.027273[/C][C]-0.2821[/C][C]0.389199[/C][/ROW]
[ROW][C]45[/C][C]-0.008331[/C][C]-0.0862[/C][C]0.465744[/C][/ROW]
[ROW][C]46[/C][C]-0.006984[/C][C]-0.0722[/C][C]0.471272[/C][/ROW]
[ROW][C]47[/C][C]0.090179[/C][C]0.9328[/C][C]0.176507[/C][/ROW]
[ROW][C]48[/C][C]0.058637[/C][C]0.6065[/C][C]0.272717[/C][/ROW]
[/TABLE]
Source: https://freestatistics.org/blog/index.php?pk=294056&T=1

Globally Unique Identifier (entire table): ba.freestatistics.org/blog/index.php?pk=294056&T=1

As an alternative you can also use a QR Code:  

The GUIDs for individual cells are displayed in the table below:

Autocorrelation Function
Time lag kACF(k)T-STATP-value
10.1587721.64240.051726
2-0.002516-0.0260.489642
3-0.111925-1.15780.12477
4-0.101775-1.05280.14741
5-0.06978-0.72180.235992
6-0.049815-0.51530.303706
7-0.067598-0.69920.24296
8-0.110934-1.14750.126864
9-0.121484-1.25660.105811
10-0.018507-0.19140.424272
110.1537031.58990.057402
120.121221.25390.106303
130.0716790.74150.230022
14-0.016554-0.17120.432182
15-0.07635-0.78980.215703
16-0.105279-1.0890.139296
17-0.039679-0.41040.341152
180.0227370.23520.407254
19-0.030232-0.31270.377549
20-0.069452-0.71840.237032
21-0.041697-0.43130.333552
22-0.009859-0.1020.459481
230.1135691.17480.121347
240.1023741.0590.146
250.0422630.43720.331433
260.0018420.01910.492416
27-0.082482-0.85320.197727
28-0.046121-0.47710.31714
29-0.064777-0.67010.252131
30-0.012914-0.13360.446991
310.0051190.0530.478933
32-0.009753-0.10090.459914
330.0144710.14970.440645
340.0305990.31650.376112
350.0952960.98570.16324
360.0798950.82640.205196
370.0255290.26410.396117
38-0.034078-0.35250.362576
39-0.095106-0.98380.16372
40-0.044698-0.46240.322382
41-0.01433-0.14820.441218
42-0.00917-0.09490.462305
430.0013090.01350.49461
44-0.027273-0.28210.389199
45-0.008331-0.08620.465744
46-0.006984-0.07220.471272
470.0901790.93280.176507
480.0586370.60650.272717


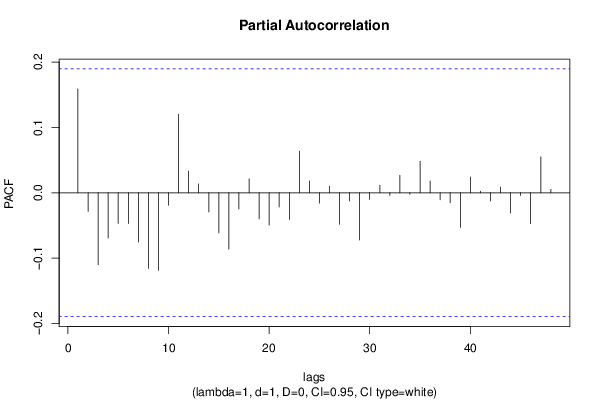
Partial Autocorrelation Function
Time lag kPACF(k)T-STATP-value
10.1587721.64240.051726
2-0.028442-0.29420.384585
3-0.109854-1.13630.129176
4-0.069039-0.71410.238346
5-0.046776-0.48390.314739
6-0.046938-0.48550.314147
7-0.075324-0.77920.218804
8-0.115825-1.19810.116763
9-0.118606-1.22690.111283
10-0.019148-0.19810.421682
110.1200811.24210.108453
120.0331310.34270.366245
130.0133480.13810.44522
14-0.029421-0.30430.380732
15-0.061356-0.63470.2635
16-0.08621-0.89180.187262
17-0.024886-0.25740.398672
180.0212910.22020.413053
19-0.039917-0.41290.340251
20-0.049482-0.51180.304907
21-0.021661-0.22410.411569
22-0.040747-0.42150.337123
230.0636160.65810.255959
240.0181950.18820.425534
25-0.015809-0.16350.435205
260.0099750.10320.459004
27-0.048205-0.49860.309531
28-0.012467-0.1290.448815
29-0.07235-0.74840.227932
30-0.010386-0.10740.457325
310.0116470.12050.452166
32-0.004194-0.04340.48274
330.0269240.27850.390583
34-0.002165-0.02240.491088
350.0483750.50040.308912
360.0181010.18720.425915
37-0.010683-0.11050.456109
38-0.015232-0.15760.43755
39-0.052905-0.54730.29267
400.0241290.24960.401689
410.0023510.02430.49032
42-0.012561-0.12990.448433
430.0086590.08960.464398
44-0.031034-0.3210.374411
45-0.004231-0.04380.482585
46-0.047181-0.4880.31326
470.0549720.56860.285398
480.0052810.05460.478271

\begin{tabular}{lllllllll}
\hline
Partial Autocorrelation Function \tabularnewline
Time lag k & PACF(k) & T-STAT & P-value \tabularnewline
1 & 0.158772 & 1.6424 & 0.051726 \tabularnewline
2 & -0.028442 & -0.2942 & 0.384585 \tabularnewline
3 & -0.109854 & -1.1363 & 0.129176 \tabularnewline
4 & -0.069039 & -0.7141 & 0.238346 \tabularnewline
5 & -0.046776 & -0.4839 & 0.314739 \tabularnewline
6 & -0.046938 & -0.4855 & 0.314147 \tabularnewline
7 & -0.075324 & -0.7792 & 0.218804 \tabularnewline
8 & -0.115825 & -1.1981 & 0.116763 \tabularnewline
9 & -0.118606 & -1.2269 & 0.111283 \tabularnewline
10 & -0.019148 & -0.1981 & 0.421682 \tabularnewline
11 & 0.120081 & 1.2421 & 0.108453 \tabularnewline
12 & 0.033131 & 0.3427 & 0.366245 \tabularnewline
13 & 0.013348 & 0.1381 & 0.44522 \tabularnewline
14 & -0.029421 & -0.3043 & 0.380732 \tabularnewline
15 & -0.061356 & -0.6347 & 0.2635 \tabularnewline
16 & -0.08621 & -0.8918 & 0.187262 \tabularnewline
17 & -0.024886 & -0.2574 & 0.398672 \tabularnewline
18 & 0.021291 & 0.2202 & 0.413053 \tabularnewline
19 & -0.039917 & -0.4129 & 0.340251 \tabularnewline
20 & -0.049482 & -0.5118 & 0.304907 \tabularnewline
21 & -0.021661 & -0.2241 & 0.411569 \tabularnewline
22 & -0.040747 & -0.4215 & 0.337123 \tabularnewline
23 & 0.063616 & 0.6581 & 0.255959 \tabularnewline
24 & 0.018195 & 0.1882 & 0.425534 \tabularnewline
25 & -0.015809 & -0.1635 & 0.435205 \tabularnewline
26 & 0.009975 & 0.1032 & 0.459004 \tabularnewline
27 & -0.048205 & -0.4986 & 0.309531 \tabularnewline
28 & -0.012467 & -0.129 & 0.448815 \tabularnewline
29 & -0.07235 & -0.7484 & 0.227932 \tabularnewline
30 & -0.010386 & -0.1074 & 0.457325 \tabularnewline
31 & 0.011647 & 0.1205 & 0.452166 \tabularnewline
32 & -0.004194 & -0.0434 & 0.48274 \tabularnewline
33 & 0.026924 & 0.2785 & 0.390583 \tabularnewline
34 & -0.002165 & -0.0224 & 0.491088 \tabularnewline
35 & 0.048375 & 0.5004 & 0.308912 \tabularnewline
36 & 0.018101 & 0.1872 & 0.425915 \tabularnewline
37 & -0.010683 & -0.1105 & 0.456109 \tabularnewline
38 & -0.015232 & -0.1576 & 0.43755 \tabularnewline
39 & -0.052905 & -0.5473 & 0.29267 \tabularnewline
40 & 0.024129 & 0.2496 & 0.401689 \tabularnewline
41 & 0.002351 & 0.0243 & 0.49032 \tabularnewline
42 & -0.012561 & -0.1299 & 0.448433 \tabularnewline
43 & 0.008659 & 0.0896 & 0.464398 \tabularnewline
44 & -0.031034 & -0.321 & 0.374411 \tabularnewline
45 & -0.004231 & -0.0438 & 0.482585 \tabularnewline
46 & -0.047181 & -0.488 & 0.31326 \tabularnewline
47 & 0.054972 & 0.5686 & 0.285398 \tabularnewline
48 & 0.005281 & 0.0546 & 0.478271 \tabularnewline
\hline
\end{tabular}
%Source: https://freestatistics.org/blog/index.php?pk=294056&T=2

[TABLE]
[ROW][C]Partial Autocorrelation Function[/C][/ROW]
[ROW][C]Time lag k[/C][C]PACF(k)[/C][C]T-STAT[/C][C]P-value[/C][/ROW]
[ROW][C]1[/C][C]0.158772[/C][C]1.6424[/C][C]0.051726[/C][/ROW]
[ROW][C]2[/C][C]-0.028442[/C][C]-0.2942[/C][C]0.384585[/C][/ROW]
[ROW][C]3[/C][C]-0.109854[/C][C]-1.1363[/C][C]0.129176[/C][/ROW]
[ROW][C]4[/C][C]-0.069039[/C][C]-0.7141[/C][C]0.238346[/C][/ROW]
[ROW][C]5[/C][C]-0.046776[/C][C]-0.4839[/C][C]0.314739[/C][/ROW]
[ROW][C]6[/C][C]-0.046938[/C][C]-0.4855[/C][C]0.314147[/C][/ROW]
[ROW][C]7[/C][C]-0.075324[/C][C]-0.7792[/C][C]0.218804[/C][/ROW]
[ROW][C]8[/C][C]-0.115825[/C][C]-1.1981[/C][C]0.116763[/C][/ROW]
[ROW][C]9[/C][C]-0.118606[/C][C]-1.2269[/C][C]0.111283[/C][/ROW]
[ROW][C]10[/C][C]-0.019148[/C][C]-0.1981[/C][C]0.421682[/C][/ROW]
[ROW][C]11[/C][C]0.120081[/C][C]1.2421[/C][C]0.108453[/C][/ROW]
[ROW][C]12[/C][C]0.033131[/C][C]0.3427[/C][C]0.366245[/C][/ROW]
[ROW][C]13[/C][C]0.013348[/C][C]0.1381[/C][C]0.44522[/C][/ROW]
[ROW][C]14[/C][C]-0.029421[/C][C]-0.3043[/C][C]0.380732[/C][/ROW]
[ROW][C]15[/C][C]-0.061356[/C][C]-0.6347[/C][C]0.2635[/C][/ROW]
[ROW][C]16[/C][C]-0.08621[/C][C]-0.8918[/C][C]0.187262[/C][/ROW]
[ROW][C]17[/C][C]-0.024886[/C][C]-0.2574[/C][C]0.398672[/C][/ROW]
[ROW][C]18[/C][C]0.021291[/C][C]0.2202[/C][C]0.413053[/C][/ROW]
[ROW][C]19[/C][C]-0.039917[/C][C]-0.4129[/C][C]0.340251[/C][/ROW]
[ROW][C]20[/C][C]-0.049482[/C][C]-0.5118[/C][C]0.304907[/C][/ROW]
[ROW][C]21[/C][C]-0.021661[/C][C]-0.2241[/C][C]0.411569[/C][/ROW]
[ROW][C]22[/C][C]-0.040747[/C][C]-0.4215[/C][C]0.337123[/C][/ROW]
[ROW][C]23[/C][C]0.063616[/C][C]0.6581[/C][C]0.255959[/C][/ROW]
[ROW][C]24[/C][C]0.018195[/C][C]0.1882[/C][C]0.425534[/C][/ROW]
[ROW][C]25[/C][C]-0.015809[/C][C]-0.1635[/C][C]0.435205[/C][/ROW]
[ROW][C]26[/C][C]0.009975[/C][C]0.1032[/C][C]0.459004[/C][/ROW]
[ROW][C]27[/C][C]-0.048205[/C][C]-0.4986[/C][C]0.309531[/C][/ROW]
[ROW][C]28[/C][C]-0.012467[/C][C]-0.129[/C][C]0.448815[/C][/ROW]
[ROW][C]29[/C][C]-0.07235[/C][C]-0.7484[/C][C]0.227932[/C][/ROW]
[ROW][C]30[/C][C]-0.010386[/C][C]-0.1074[/C][C]0.457325[/C][/ROW]
[ROW][C]31[/C][C]0.011647[/C][C]0.1205[/C][C]0.452166[/C][/ROW]
[ROW][C]32[/C][C]-0.004194[/C][C]-0.0434[/C][C]0.48274[/C][/ROW]
[ROW][C]33[/C][C]0.026924[/C][C]0.2785[/C][C]0.390583[/C][/ROW]
[ROW][C]34[/C][C]-0.002165[/C][C]-0.0224[/C][C]0.491088[/C][/ROW]
[ROW][C]35[/C][C]0.048375[/C][C]0.5004[/C][C]0.308912[/C][/ROW]
[ROW][C]36[/C][C]0.018101[/C][C]0.1872[/C][C]0.425915[/C][/ROW]
[ROW][C]37[/C][C]-0.010683[/C][C]-0.1105[/C][C]0.456109[/C][/ROW]
[ROW][C]38[/C][C]-0.015232[/C][C]-0.1576[/C][C]0.43755[/C][/ROW]
[ROW][C]39[/C][C]-0.052905[/C][C]-0.5473[/C][C]0.29267[/C][/ROW]
[ROW][C]40[/C][C]0.024129[/C][C]0.2496[/C][C]0.401689[/C][/ROW]
[ROW][C]41[/C][C]0.002351[/C][C]0.0243[/C][C]0.49032[/C][/ROW]
[ROW][C]42[/C][C]-0.012561[/C][C]-0.1299[/C][C]0.448433[/C][/ROW]
[ROW][C]43[/C][C]0.008659[/C][C]0.0896[/C][C]0.464398[/C][/ROW]
[ROW][C]44[/C][C]-0.031034[/C][C]-0.321[/C][C]0.374411[/C][/ROW]
[ROW][C]45[/C][C]-0.004231[/C][C]-0.0438[/C][C]0.482585[/C][/ROW]
[ROW][C]46[/C][C]-0.047181[/C][C]-0.488[/C][C]0.31326[/C][/ROW]
[ROW][C]47[/C][C]0.054972[/C][C]0.5686[/C][C]0.285398[/C][/ROW]
[ROW][C]48[/C][C]0.005281[/C][C]0.0546[/C][C]0.478271[/C][/ROW]
[/TABLE]
Source: https://freestatistics.org/blog/index.php?pk=294056&T=2

Globally Unique Identifier (entire table): ba.freestatistics.org/blog/index.php?pk=294056&T=2

As an alternative you can also use a QR Code:  

The GUIDs for individual cells are displayed in the table below:

Partial Autocorrelation Function
Time lag kPACF(k)T-STATP-value
10.1587721.64240.051726
2-0.028442-0.29420.384585
3-0.109854-1.13630.129176
4-0.069039-0.71410.238346
5-0.046776-0.48390.314739
6-0.046938-0.48550.314147
7-0.075324-0.77920.218804
8-0.115825-1.19810.116763
9-0.118606-1.22690.111283
10-0.019148-0.19810.421682
110.1200811.24210.108453
120.0331310.34270.366245
130.0133480.13810.44522
14-0.029421-0.30430.380732
15-0.061356-0.63470.2635
16-0.08621-0.89180.187262
17-0.024886-0.25740.398672
180.0212910.22020.413053
19-0.039917-0.41290.340251
20-0.049482-0.51180.304907
21-0.021661-0.22410.411569
22-0.040747-0.42150.337123
230.0636160.65810.255959
240.0181950.18820.425534
25-0.015809-0.16350.435205
260.0099750.10320.459004
27-0.048205-0.49860.309531
28-0.012467-0.1290.448815
29-0.07235-0.74840.227932
30-0.010386-0.10740.457325
310.0116470.12050.452166
32-0.004194-0.04340.48274
330.0269240.27850.390583
34-0.002165-0.02240.491088
350.0483750.50040.308912
360.0181010.18720.425915
37-0.010683-0.11050.456109
38-0.015232-0.15760.43755
39-0.052905-0.54730.29267
400.0241290.24960.401689
410.0023510.02430.49032
42-0.012561-0.12990.448433
430.0086590.08960.464398
44-0.031034-0.3210.374411
45-0.004231-0.04380.482585
46-0.047181-0.4880.31326
470.0549720.56860.285398
480.0052810.05460.478271


Parameters (Session):
par1 = 48 ; par2 = 1 ; par3 = 1 ; par4 = 0 ; par5 = 12 ; par6 = White Noise ; par7 = 0.95 ;
Parameters (R input):
par1 = 48 ; par2 = 1 ; par3 = 1 ; par4 = 0 ; par5 = 12 ; par6 = White Noise ; par7 = 0.95 ; par8 = ;
R code (references can be found in the software module):
par8 <- ''
par7 <- '0.95'
par6 <- 'White Noise'
par5 <- '12'
par4 <- '0'
par3 <- '0'
par2 <- '1'
par1 <- '48'
if (par1 == 'Default') {
par1 = 10*log10(length(x))
} else {
par1 <- as.numeric(par1)
}
par2 <- as.numeric(par2)
par3 <- as.numeric(par3)
par4 <- as.numeric(par4)
par5 <- as.numeric(par5)
if (par6 == 'White Noise') par6 <- 'white' else par6 <- 'ma'
par7 <- as.numeric(par7)
if (par8 != '') par8 <- as.numeric(par8)
x <- na.omit(x)
ox <- x
if (par8 == '') {
if (par2 == 0) {
x <- log(x)
} else {
x <- (x ^ par2 - 1) / par2
}
} else {
x <- log(x,base=par8)
}
if (par3 > 0) x <- diff(x,lag=1,difference=par3)
if (par4 > 0) x <- diff(x,lag=par5,difference=par4)
bitmap(file='picts.png')
op <- par(mfrow=c(2,1))
plot(ox,type='l',main='Original Time Series',xlab='time',ylab='value')
if (par8=='') {
mytitle <- paste('Working Time Series (lambda=',par2,', d=',par3,', D=',par4,')',sep='')
mysub <- paste('(lambda=',par2,', d=',par3,', D=',par4,', CI=', par7, ', CI type=',par6,')',sep='')
} else {
mytitle <- paste('Working Time Series (base=',par8,', d=',par3,', D=',par4,')',sep='')
mysub <- paste('(base=',par8,', d=',par3,', D=',par4,', CI=', par7, ', CI type=',par6,')',sep='')
}
plot(x,type='l', main=mytitle,xlab='time',ylab='value')
par(op)
dev.off()
bitmap(file='pic1.png')
racf <- acf(x, par1, main='Autocorrelation', xlab='time lag', ylab='ACF', ci.type=par6, ci=par7, sub=mysub)
dev.off()
bitmap(file='pic2.png')
rpacf <- pacf(x,par1,main='Partial Autocorrelation',xlab='lags',ylab='PACF',sub=mysub)
dev.off()
(myacf <- c(racf$acf))
(mypacf <- c(rpacf$acf))
lengthx <- length(x)
sqrtn <- sqrt(lengthx)
load(file='createtable')
a<-table.start()
a<-table.row.start(a)
a<-table.element(a,'Autocorrelation Function',4,TRUE)
a<-table.row.end(a)
a<-table.row.start(a)
a<-table.element(a,'Time lag k',header=TRUE)
a<-table.element(a,hyperlink('basics.htm','ACF(k)','click here for more information about the Autocorrelation Function'),header=TRUE)
a<-table.element(a,'T-STAT',header=TRUE)
a<-table.element(a,'P-value',header=TRUE)
a<-table.row.end(a)
for (i in 2:(par1+1)) {
a<-table.row.start(a)
a<-table.element(a,i-1,header=TRUE)
a<-table.element(a,round(myacf[i],6))
mytstat <- myacf[i]*sqrtn
a<-table.element(a,round(mytstat,4))
a<-table.element(a,round(1-pt(abs(mytstat),lengthx),6))
a<-table.row.end(a)
}
a<-table.end(a)
table.save(a,file='mytable.tab')
a<-table.start()
a<-table.row.start(a)
a<-table.element(a,'Partial Autocorrelation Function',4,TRUE)
a<-table.row.end(a)
a<-table.row.start(a)
a<-table.element(a,'Time lag k',header=TRUE)
a<-table.element(a,hyperlink('basics.htm','PACF(k)','click here for more information about the Partial Autocorrelation Function'),header=TRUE)
a<-table.element(a,'T-STAT',header=TRUE)
a<-table.element(a,'P-value',header=TRUE)
a<-table.row.end(a)
for (i in 1:par1) {
a<-table.row.start(a)
a<-table.element(a,i,header=TRUE)
a<-table.element(a,round(mypacf[i],6))
mytstat <- mypacf[i]*sqrtn
a<-table.element(a,round(mytstat,4))
a<-table.element(a,round(1-pt(abs(mytstat),lengthx),6))
a<-table.row.end(a)
}
a<-table.end(a)
table.save(a,file='mytable1.tab')