Free Statistics

of Irreproducible Research!

Author's title

Author*Unverified author*
R Software Modulerwasp_autocorrelation.wasp
Title produced by software(Partial) Autocorrelation Function
Date of computationTue, 15 Mar 2016 14:25:05 +0000
Cite this page as followsStatistical Computations at FreeStatistics.org, Office for Research Development and Education, URL https://freestatistics.org/blog/index.php?v=date/2016/Mar/15/t1458052021mylrgb0lebpevra.htm/, Retrieved Tue, 30 Apr 2024 14:53:35 +0000
Statistical Computations at FreeStatistics.org, Office for Research Development and Education, URL https://freestatistics.org/blog/index.php?pk=294075, Retrieved Tue, 30 Apr 2024 14:53:35 +0000
QR Codes:

Original text written by user:
IsPrivate?No (this computation is public)
User-defined keywords
Estimated Impact112
Family? (F = Feedback message, R = changed R code, M = changed R Module, P = changed Parameters, D = changed Data)
-     [Mean Plot] [] [2016-03-15 13:51:24] [a134250e9068373a091df7e7ff2776c7]
- RMPD    [(Partial) Autocorrelation Function] [] [2016-03-15 14:25:05] [dce1b7f6243247e331d0750a8103b593] [Current]
Feedback Forum

Post a new message
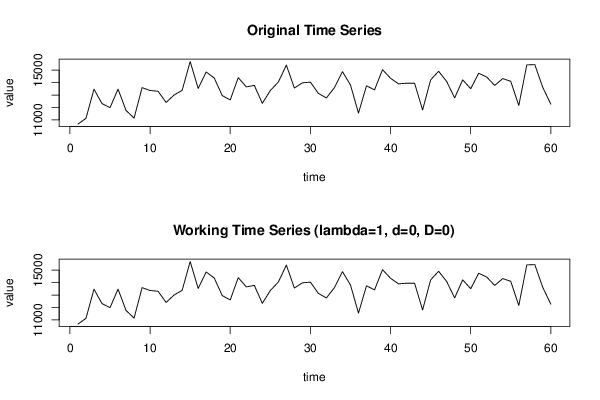
Dataseries X:
10670,5
11129
13474,5
12317,8
11990,1
13478,3
11762,4
11149,1
13597,2
13367,9
13304,2
12407,2
13008,3
13379,5
15696
13529,6
14857
14375,1
12958,4
12612,8
14405,2
13655,8
13783,1
12336,1
13366,7
14042,4
15412
13566,5
13981,5
14042
13131
12771,2
13600,1
14886,9
13813,1
11551
13750,5
13415,4
15040,9
14349,5
13900,2
13956,6
13951
11802,1
14219,1
14914,5
14098,2
12773,6
14225
13513
14754,4
14447,7
13777,8
14328,6
14106,1
12157
15425,1
15448,8
13604,5
12269,3


Summary of computational transaction
Raw Inputview raw input (R code)
Raw Outputview raw output of R engine
Computing time2 seconds
R Server'Herman Ole Andreas Wold' @ wold.wessa.net

\begin{tabular}{lllllllll}
\hline
Summary of computational transaction \tabularnewline
Raw Input & view raw input (R code)  \tabularnewline
Raw Output & view raw output of R engine  \tabularnewline
Computing time & 2 seconds \tabularnewline
R Server & 'Herman Ole Andreas Wold' @ wold.wessa.net \tabularnewline
\hline
\end{tabular}
%Source: https://freestatistics.org/blog/index.php?pk=294075&T=0

[TABLE]
[ROW][C]Summary of computational transaction[/C][/ROW]
[ROW][C]Raw Input[/C][C]view raw input (R code) [/C][/ROW]
[ROW][C]Raw Output[/C][C]view raw output of R engine [/C][/ROW]
[ROW][C]Computing time[/C][C]2 seconds[/C][/ROW]
[ROW][C]R Server[/C][C]'Herman Ole Andreas Wold' @ wold.wessa.net[/C][/ROW]
[/TABLE]
Source: https://freestatistics.org/blog/index.php?pk=294075&T=0

Globally Unique Identifier (entire table): ba.freestatistics.org/blog/index.php?pk=294075&T=0

As an alternative you can also use a QR Code:  

The GUIDs for individual cells are displayed in the table below:

Summary of computational transaction
Raw Inputview raw input (R code)
Raw Outputview raw output of R engine
Computing time2 seconds
R Server'Herman Ole Andreas Wold' @ wold.wessa.net


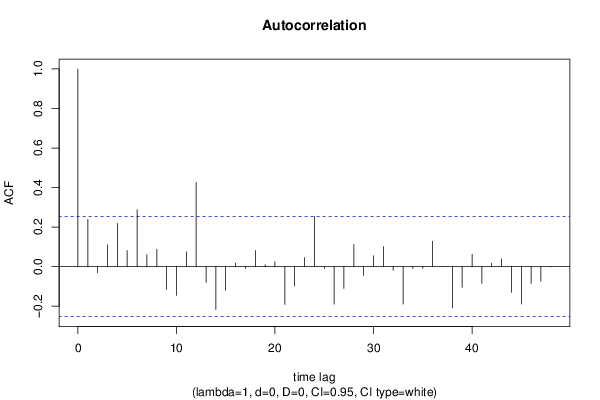
Autocorrelation Function
Time lag kACF(k)T-STATP-value
10.2390921.8520.034474
2-0.030982-0.240.405579
30.1100130.85220.198758
40.2184731.69230.04789
50.0809330.62690.266549
60.2873952.22620.014886
70.0595910.46160.323022
80.0878840.68070.249326
9-0.115276-0.89290.187733
10-0.145346-1.12580.132358
110.0747520.5790.282368
120.4257463.29780.000821
13-0.079951-0.61930.269032
14-0.216875-1.67990.049088
15-0.119781-0.92780.178609
160.0183680.14230.443669
17-0.009743-0.07550.470045
180.0813050.62980.265613
190.0092670.07180.471507
200.0250920.19440.423275
21-0.190896-1.47870.072229
22-0.097306-0.75370.22698
230.0460920.3570.361161
240.2540181.96760.02687
25-0.009643-0.07470.470353
26-0.189764-1.46990.073406
27-0.110168-0.85340.198428
280.1123330.87010.19385
29-0.044763-0.34670.365003
300.0547750.42430.336438
310.1012920.78460.217887
32-0.017947-0.1390.444951
33-0.189551-1.46830.073629
34-0.009038-0.070.472209
35-0.007937-0.06150.475591
360.128650.99650.161499
370.0014120.01090.495655
38-0.208545-1.61540.055737
39-0.104709-0.81110.210265
400.0625140.48420.314991
41-0.084931-0.65790.256568
420.016450.12740.449516
430.0385950.2990.383004
44-0.130336-1.00960.158376
45-0.188783-1.46230.074438
46-0.084932-0.65790.256566
47-0.073986-0.57310.284363
48-0.001426-0.0110.495613

\begin{tabular}{lllllllll}
\hline
Autocorrelation Function \tabularnewline
Time lag k & ACF(k) & T-STAT & P-value \tabularnewline
1 & 0.239092 & 1.852 & 0.034474 \tabularnewline
2 & -0.030982 & -0.24 & 0.405579 \tabularnewline
3 & 0.110013 & 0.8522 & 0.198758 \tabularnewline
4 & 0.218473 & 1.6923 & 0.04789 \tabularnewline
5 & 0.080933 & 0.6269 & 0.266549 \tabularnewline
6 & 0.287395 & 2.2262 & 0.014886 \tabularnewline
7 & 0.059591 & 0.4616 & 0.323022 \tabularnewline
8 & 0.087884 & 0.6807 & 0.249326 \tabularnewline
9 & -0.115276 & -0.8929 & 0.187733 \tabularnewline
10 & -0.145346 & -1.1258 & 0.132358 \tabularnewline
11 & 0.074752 & 0.579 & 0.282368 \tabularnewline
12 & 0.425746 & 3.2978 & 0.000821 \tabularnewline
13 & -0.079951 & -0.6193 & 0.269032 \tabularnewline
14 & -0.216875 & -1.6799 & 0.049088 \tabularnewline
15 & -0.119781 & -0.9278 & 0.178609 \tabularnewline
16 & 0.018368 & 0.1423 & 0.443669 \tabularnewline
17 & -0.009743 & -0.0755 & 0.470045 \tabularnewline
18 & 0.081305 & 0.6298 & 0.265613 \tabularnewline
19 & 0.009267 & 0.0718 & 0.471507 \tabularnewline
20 & 0.025092 & 0.1944 & 0.423275 \tabularnewline
21 & -0.190896 & -1.4787 & 0.072229 \tabularnewline
22 & -0.097306 & -0.7537 & 0.22698 \tabularnewline
23 & 0.046092 & 0.357 & 0.361161 \tabularnewline
24 & 0.254018 & 1.9676 & 0.02687 \tabularnewline
25 & -0.009643 & -0.0747 & 0.470353 \tabularnewline
26 & -0.189764 & -1.4699 & 0.073406 \tabularnewline
27 & -0.110168 & -0.8534 & 0.198428 \tabularnewline
28 & 0.112333 & 0.8701 & 0.19385 \tabularnewline
29 & -0.044763 & -0.3467 & 0.365003 \tabularnewline
30 & 0.054775 & 0.4243 & 0.336438 \tabularnewline
31 & 0.101292 & 0.7846 & 0.217887 \tabularnewline
32 & -0.017947 & -0.139 & 0.444951 \tabularnewline
33 & -0.189551 & -1.4683 & 0.073629 \tabularnewline
34 & -0.009038 & -0.07 & 0.472209 \tabularnewline
35 & -0.007937 & -0.0615 & 0.475591 \tabularnewline
36 & 0.12865 & 0.9965 & 0.161499 \tabularnewline
37 & 0.001412 & 0.0109 & 0.495655 \tabularnewline
38 & -0.208545 & -1.6154 & 0.055737 \tabularnewline
39 & -0.104709 & -0.8111 & 0.210265 \tabularnewline
40 & 0.062514 & 0.4842 & 0.314991 \tabularnewline
41 & -0.084931 & -0.6579 & 0.256568 \tabularnewline
42 & 0.01645 & 0.1274 & 0.449516 \tabularnewline
43 & 0.038595 & 0.299 & 0.383004 \tabularnewline
44 & -0.130336 & -1.0096 & 0.158376 \tabularnewline
45 & -0.188783 & -1.4623 & 0.074438 \tabularnewline
46 & -0.084932 & -0.6579 & 0.256566 \tabularnewline
47 & -0.073986 & -0.5731 & 0.284363 \tabularnewline
48 & -0.001426 & -0.011 & 0.495613 \tabularnewline
\hline
\end{tabular}
%Source: https://freestatistics.org/blog/index.php?pk=294075&T=1

[TABLE]
[ROW][C]Autocorrelation Function[/C][/ROW]
[ROW][C]Time lag k[/C][C]ACF(k)[/C][C]T-STAT[/C][C]P-value[/C][/ROW]
[ROW][C]1[/C][C]0.239092[/C][C]1.852[/C][C]0.034474[/C][/ROW]
[ROW][C]2[/C][C]-0.030982[/C][C]-0.24[/C][C]0.405579[/C][/ROW]
[ROW][C]3[/C][C]0.110013[/C][C]0.8522[/C][C]0.198758[/C][/ROW]
[ROW][C]4[/C][C]0.218473[/C][C]1.6923[/C][C]0.04789[/C][/ROW]
[ROW][C]5[/C][C]0.080933[/C][C]0.6269[/C][C]0.266549[/C][/ROW]
[ROW][C]6[/C][C]0.287395[/C][C]2.2262[/C][C]0.014886[/C][/ROW]
[ROW][C]7[/C][C]0.059591[/C][C]0.4616[/C][C]0.323022[/C][/ROW]
[ROW][C]8[/C][C]0.087884[/C][C]0.6807[/C][C]0.249326[/C][/ROW]
[ROW][C]9[/C][C]-0.115276[/C][C]-0.8929[/C][C]0.187733[/C][/ROW]
[ROW][C]10[/C][C]-0.145346[/C][C]-1.1258[/C][C]0.132358[/C][/ROW]
[ROW][C]11[/C][C]0.074752[/C][C]0.579[/C][C]0.282368[/C][/ROW]
[ROW][C]12[/C][C]0.425746[/C][C]3.2978[/C][C]0.000821[/C][/ROW]
[ROW][C]13[/C][C]-0.079951[/C][C]-0.6193[/C][C]0.269032[/C][/ROW]
[ROW][C]14[/C][C]-0.216875[/C][C]-1.6799[/C][C]0.049088[/C][/ROW]
[ROW][C]15[/C][C]-0.119781[/C][C]-0.9278[/C][C]0.178609[/C][/ROW]
[ROW][C]16[/C][C]0.018368[/C][C]0.1423[/C][C]0.443669[/C][/ROW]
[ROW][C]17[/C][C]-0.009743[/C][C]-0.0755[/C][C]0.470045[/C][/ROW]
[ROW][C]18[/C][C]0.081305[/C][C]0.6298[/C][C]0.265613[/C][/ROW]
[ROW][C]19[/C][C]0.009267[/C][C]0.0718[/C][C]0.471507[/C][/ROW]
[ROW][C]20[/C][C]0.025092[/C][C]0.1944[/C][C]0.423275[/C][/ROW]
[ROW][C]21[/C][C]-0.190896[/C][C]-1.4787[/C][C]0.072229[/C][/ROW]
[ROW][C]22[/C][C]-0.097306[/C][C]-0.7537[/C][C]0.22698[/C][/ROW]
[ROW][C]23[/C][C]0.046092[/C][C]0.357[/C][C]0.361161[/C][/ROW]
[ROW][C]24[/C][C]0.254018[/C][C]1.9676[/C][C]0.02687[/C][/ROW]
[ROW][C]25[/C][C]-0.009643[/C][C]-0.0747[/C][C]0.470353[/C][/ROW]
[ROW][C]26[/C][C]-0.189764[/C][C]-1.4699[/C][C]0.073406[/C][/ROW]
[ROW][C]27[/C][C]-0.110168[/C][C]-0.8534[/C][C]0.198428[/C][/ROW]
[ROW][C]28[/C][C]0.112333[/C][C]0.8701[/C][C]0.19385[/C][/ROW]
[ROW][C]29[/C][C]-0.044763[/C][C]-0.3467[/C][C]0.365003[/C][/ROW]
[ROW][C]30[/C][C]0.054775[/C][C]0.4243[/C][C]0.336438[/C][/ROW]
[ROW][C]31[/C][C]0.101292[/C][C]0.7846[/C][C]0.217887[/C][/ROW]
[ROW][C]32[/C][C]-0.017947[/C][C]-0.139[/C][C]0.444951[/C][/ROW]
[ROW][C]33[/C][C]-0.189551[/C][C]-1.4683[/C][C]0.073629[/C][/ROW]
[ROW][C]34[/C][C]-0.009038[/C][C]-0.07[/C][C]0.472209[/C][/ROW]
[ROW][C]35[/C][C]-0.007937[/C][C]-0.0615[/C][C]0.475591[/C][/ROW]
[ROW][C]36[/C][C]0.12865[/C][C]0.9965[/C][C]0.161499[/C][/ROW]
[ROW][C]37[/C][C]0.001412[/C][C]0.0109[/C][C]0.495655[/C][/ROW]
[ROW][C]38[/C][C]-0.208545[/C][C]-1.6154[/C][C]0.055737[/C][/ROW]
[ROW][C]39[/C][C]-0.104709[/C][C]-0.8111[/C][C]0.210265[/C][/ROW]
[ROW][C]40[/C][C]0.062514[/C][C]0.4842[/C][C]0.314991[/C][/ROW]
[ROW][C]41[/C][C]-0.084931[/C][C]-0.6579[/C][C]0.256568[/C][/ROW]
[ROW][C]42[/C][C]0.01645[/C][C]0.1274[/C][C]0.449516[/C][/ROW]
[ROW][C]43[/C][C]0.038595[/C][C]0.299[/C][C]0.383004[/C][/ROW]
[ROW][C]44[/C][C]-0.130336[/C][C]-1.0096[/C][C]0.158376[/C][/ROW]
[ROW][C]45[/C][C]-0.188783[/C][C]-1.4623[/C][C]0.074438[/C][/ROW]
[ROW][C]46[/C][C]-0.084932[/C][C]-0.6579[/C][C]0.256566[/C][/ROW]
[ROW][C]47[/C][C]-0.073986[/C][C]-0.5731[/C][C]0.284363[/C][/ROW]
[ROW][C]48[/C][C]-0.001426[/C][C]-0.011[/C][C]0.495613[/C][/ROW]
[/TABLE]
Source: https://freestatistics.org/blog/index.php?pk=294075&T=1

Globally Unique Identifier (entire table): ba.freestatistics.org/blog/index.php?pk=294075&T=1

As an alternative you can also use a QR Code:  

The GUIDs for individual cells are displayed in the table below:

Autocorrelation Function
Time lag kACF(k)T-STATP-value
10.2390921.8520.034474
2-0.030982-0.240.405579
30.1100130.85220.198758
40.2184731.69230.04789
50.0809330.62690.266549
60.2873952.22620.014886
70.0595910.46160.323022
80.0878840.68070.249326
9-0.115276-0.89290.187733
10-0.145346-1.12580.132358
110.0747520.5790.282368
120.4257463.29780.000821
13-0.079951-0.61930.269032
14-0.216875-1.67990.049088
15-0.119781-0.92780.178609
160.0183680.14230.443669
17-0.009743-0.07550.470045
180.0813050.62980.265613
190.0092670.07180.471507
200.0250920.19440.423275
21-0.190896-1.47870.072229
22-0.097306-0.75370.22698
230.0460920.3570.361161
240.2540181.96760.02687
25-0.009643-0.07470.470353
26-0.189764-1.46990.073406
27-0.110168-0.85340.198428
280.1123330.87010.19385
29-0.044763-0.34670.365003
300.0547750.42430.336438
310.1012920.78460.217887
32-0.017947-0.1390.444951
33-0.189551-1.46830.073629
34-0.009038-0.070.472209
35-0.007937-0.06150.475591
360.128650.99650.161499
370.0014120.01090.495655
38-0.208545-1.61540.055737
39-0.104709-0.81110.210265
400.0625140.48420.314991
41-0.084931-0.65790.256568
420.016450.12740.449516
430.0385950.2990.383004
44-0.130336-1.00960.158376
45-0.188783-1.46230.074438
46-0.084932-0.65790.256566
47-0.073986-0.57310.284363
48-0.001426-0.0110.495613


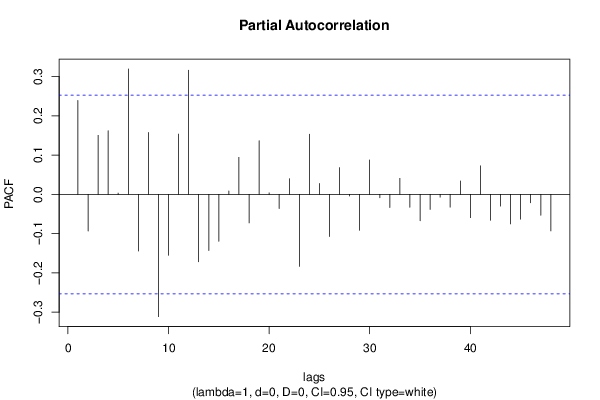
Partial Autocorrelation Function
Time lag kPACF(k)T-STATP-value
10.2390921.8520.034474
2-0.093492-0.72420.235884
30.1502961.16420.124478
40.1621441.2560.106999
50.0031630.02450.490267
60.319382.47390.008106
7-0.144123-1.11640.134357
80.1577721.22210.113225
9-0.311359-2.41180.009476
10-0.15482-1.19920.117577
110.1534641.18870.119616
120.3162512.44970.008617
13-0.171741-1.33030.094227
14-0.142967-1.10740.136267
15-0.119482-0.92550.179206
160.0084220.06520.474102
170.0942810.73030.234026
18-0.07256-0.5620.288089
190.136691.05880.146968
200.0037960.02940.488321
21-0.036003-0.27890.39065
220.0398160.30840.379419
23-0.183377-1.42040.080329
240.1531641.18640.120069
250.0278290.21560.415029
26-0.107091-0.82950.205048
270.0681510.52790.299759
28-0.004047-0.03130.487549
29-0.091592-0.70950.240391
300.0875740.67830.250081
31-0.008824-0.06840.472866
32-0.033628-0.26050.397692
330.0407680.31580.37663
34-0.033008-0.25570.399538
35-0.067283-0.52120.302084
36-0.038228-0.29610.384085
37-0.007055-0.05460.4783
38-0.032494-0.25170.401068
390.0342970.26570.395705
40-0.059256-0.4590.323949
410.0725510.5620.288112
42-0.065794-0.50960.306086
43-0.029848-0.23120.408972
44-0.075191-0.58240.28123
45-0.063041-0.48830.313553
46-0.02116-0.16390.43518
47-0.053131-0.41160.341068
48-0.092991-0.72030.237068

\begin{tabular}{lllllllll}
\hline
Partial Autocorrelation Function \tabularnewline
Time lag k & PACF(k) & T-STAT & P-value \tabularnewline
1 & 0.239092 & 1.852 & 0.034474 \tabularnewline
2 & -0.093492 & -0.7242 & 0.235884 \tabularnewline
3 & 0.150296 & 1.1642 & 0.124478 \tabularnewline
4 & 0.162144 & 1.256 & 0.106999 \tabularnewline
5 & 0.003163 & 0.0245 & 0.490267 \tabularnewline
6 & 0.31938 & 2.4739 & 0.008106 \tabularnewline
7 & -0.144123 & -1.1164 & 0.134357 \tabularnewline
8 & 0.157772 & 1.2221 & 0.113225 \tabularnewline
9 & -0.311359 & -2.4118 & 0.009476 \tabularnewline
10 & -0.15482 & -1.1992 & 0.117577 \tabularnewline
11 & 0.153464 & 1.1887 & 0.119616 \tabularnewline
12 & 0.316251 & 2.4497 & 0.008617 \tabularnewline
13 & -0.171741 & -1.3303 & 0.094227 \tabularnewline
14 & -0.142967 & -1.1074 & 0.136267 \tabularnewline
15 & -0.119482 & -0.9255 & 0.179206 \tabularnewline
16 & 0.008422 & 0.0652 & 0.474102 \tabularnewline
17 & 0.094281 & 0.7303 & 0.234026 \tabularnewline
18 & -0.07256 & -0.562 & 0.288089 \tabularnewline
19 & 0.13669 & 1.0588 & 0.146968 \tabularnewline
20 & 0.003796 & 0.0294 & 0.488321 \tabularnewline
21 & -0.036003 & -0.2789 & 0.39065 \tabularnewline
22 & 0.039816 & 0.3084 & 0.379419 \tabularnewline
23 & -0.183377 & -1.4204 & 0.080329 \tabularnewline
24 & 0.153164 & 1.1864 & 0.120069 \tabularnewline
25 & 0.027829 & 0.2156 & 0.415029 \tabularnewline
26 & -0.107091 & -0.8295 & 0.205048 \tabularnewline
27 & 0.068151 & 0.5279 & 0.299759 \tabularnewline
28 & -0.004047 & -0.0313 & 0.487549 \tabularnewline
29 & -0.091592 & -0.7095 & 0.240391 \tabularnewline
30 & 0.087574 & 0.6783 & 0.250081 \tabularnewline
31 & -0.008824 & -0.0684 & 0.472866 \tabularnewline
32 & -0.033628 & -0.2605 & 0.397692 \tabularnewline
33 & 0.040768 & 0.3158 & 0.37663 \tabularnewline
34 & -0.033008 & -0.2557 & 0.399538 \tabularnewline
35 & -0.067283 & -0.5212 & 0.302084 \tabularnewline
36 & -0.038228 & -0.2961 & 0.384085 \tabularnewline
37 & -0.007055 & -0.0546 & 0.4783 \tabularnewline
38 & -0.032494 & -0.2517 & 0.401068 \tabularnewline
39 & 0.034297 & 0.2657 & 0.395705 \tabularnewline
40 & -0.059256 & -0.459 & 0.323949 \tabularnewline
41 & 0.072551 & 0.562 & 0.288112 \tabularnewline
42 & -0.065794 & -0.5096 & 0.306086 \tabularnewline
43 & -0.029848 & -0.2312 & 0.408972 \tabularnewline
44 & -0.075191 & -0.5824 & 0.28123 \tabularnewline
45 & -0.063041 & -0.4883 & 0.313553 \tabularnewline
46 & -0.02116 & -0.1639 & 0.43518 \tabularnewline
47 & -0.053131 & -0.4116 & 0.341068 \tabularnewline
48 & -0.092991 & -0.7203 & 0.237068 \tabularnewline
\hline
\end{tabular}
%Source: https://freestatistics.org/blog/index.php?pk=294075&T=2

[TABLE]
[ROW][C]Partial Autocorrelation Function[/C][/ROW]
[ROW][C]Time lag k[/C][C]PACF(k)[/C][C]T-STAT[/C][C]P-value[/C][/ROW]
[ROW][C]1[/C][C]0.239092[/C][C]1.852[/C][C]0.034474[/C][/ROW]
[ROW][C]2[/C][C]-0.093492[/C][C]-0.7242[/C][C]0.235884[/C][/ROW]
[ROW][C]3[/C][C]0.150296[/C][C]1.1642[/C][C]0.124478[/C][/ROW]
[ROW][C]4[/C][C]0.162144[/C][C]1.256[/C][C]0.106999[/C][/ROW]
[ROW][C]5[/C][C]0.003163[/C][C]0.0245[/C][C]0.490267[/C][/ROW]
[ROW][C]6[/C][C]0.31938[/C][C]2.4739[/C][C]0.008106[/C][/ROW]
[ROW][C]7[/C][C]-0.144123[/C][C]-1.1164[/C][C]0.134357[/C][/ROW]
[ROW][C]8[/C][C]0.157772[/C][C]1.2221[/C][C]0.113225[/C][/ROW]
[ROW][C]9[/C][C]-0.311359[/C][C]-2.4118[/C][C]0.009476[/C][/ROW]
[ROW][C]10[/C][C]-0.15482[/C][C]-1.1992[/C][C]0.117577[/C][/ROW]
[ROW][C]11[/C][C]0.153464[/C][C]1.1887[/C][C]0.119616[/C][/ROW]
[ROW][C]12[/C][C]0.316251[/C][C]2.4497[/C][C]0.008617[/C][/ROW]
[ROW][C]13[/C][C]-0.171741[/C][C]-1.3303[/C][C]0.094227[/C][/ROW]
[ROW][C]14[/C][C]-0.142967[/C][C]-1.1074[/C][C]0.136267[/C][/ROW]
[ROW][C]15[/C][C]-0.119482[/C][C]-0.9255[/C][C]0.179206[/C][/ROW]
[ROW][C]16[/C][C]0.008422[/C][C]0.0652[/C][C]0.474102[/C][/ROW]
[ROW][C]17[/C][C]0.094281[/C][C]0.7303[/C][C]0.234026[/C][/ROW]
[ROW][C]18[/C][C]-0.07256[/C][C]-0.562[/C][C]0.288089[/C][/ROW]
[ROW][C]19[/C][C]0.13669[/C][C]1.0588[/C][C]0.146968[/C][/ROW]
[ROW][C]20[/C][C]0.003796[/C][C]0.0294[/C][C]0.488321[/C][/ROW]
[ROW][C]21[/C][C]-0.036003[/C][C]-0.2789[/C][C]0.39065[/C][/ROW]
[ROW][C]22[/C][C]0.039816[/C][C]0.3084[/C][C]0.379419[/C][/ROW]
[ROW][C]23[/C][C]-0.183377[/C][C]-1.4204[/C][C]0.080329[/C][/ROW]
[ROW][C]24[/C][C]0.153164[/C][C]1.1864[/C][C]0.120069[/C][/ROW]
[ROW][C]25[/C][C]0.027829[/C][C]0.2156[/C][C]0.415029[/C][/ROW]
[ROW][C]26[/C][C]-0.107091[/C][C]-0.8295[/C][C]0.205048[/C][/ROW]
[ROW][C]27[/C][C]0.068151[/C][C]0.5279[/C][C]0.299759[/C][/ROW]
[ROW][C]28[/C][C]-0.004047[/C][C]-0.0313[/C][C]0.487549[/C][/ROW]
[ROW][C]29[/C][C]-0.091592[/C][C]-0.7095[/C][C]0.240391[/C][/ROW]
[ROW][C]30[/C][C]0.087574[/C][C]0.6783[/C][C]0.250081[/C][/ROW]
[ROW][C]31[/C][C]-0.008824[/C][C]-0.0684[/C][C]0.472866[/C][/ROW]
[ROW][C]32[/C][C]-0.033628[/C][C]-0.2605[/C][C]0.397692[/C][/ROW]
[ROW][C]33[/C][C]0.040768[/C][C]0.3158[/C][C]0.37663[/C][/ROW]
[ROW][C]34[/C][C]-0.033008[/C][C]-0.2557[/C][C]0.399538[/C][/ROW]
[ROW][C]35[/C][C]-0.067283[/C][C]-0.5212[/C][C]0.302084[/C][/ROW]
[ROW][C]36[/C][C]-0.038228[/C][C]-0.2961[/C][C]0.384085[/C][/ROW]
[ROW][C]37[/C][C]-0.007055[/C][C]-0.0546[/C][C]0.4783[/C][/ROW]
[ROW][C]38[/C][C]-0.032494[/C][C]-0.2517[/C][C]0.401068[/C][/ROW]
[ROW][C]39[/C][C]0.034297[/C][C]0.2657[/C][C]0.395705[/C][/ROW]
[ROW][C]40[/C][C]-0.059256[/C][C]-0.459[/C][C]0.323949[/C][/ROW]
[ROW][C]41[/C][C]0.072551[/C][C]0.562[/C][C]0.288112[/C][/ROW]
[ROW][C]42[/C][C]-0.065794[/C][C]-0.5096[/C][C]0.306086[/C][/ROW]
[ROW][C]43[/C][C]-0.029848[/C][C]-0.2312[/C][C]0.408972[/C][/ROW]
[ROW][C]44[/C][C]-0.075191[/C][C]-0.5824[/C][C]0.28123[/C][/ROW]
[ROW][C]45[/C][C]-0.063041[/C][C]-0.4883[/C][C]0.313553[/C][/ROW]
[ROW][C]46[/C][C]-0.02116[/C][C]-0.1639[/C][C]0.43518[/C][/ROW]
[ROW][C]47[/C][C]-0.053131[/C][C]-0.4116[/C][C]0.341068[/C][/ROW]
[ROW][C]48[/C][C]-0.092991[/C][C]-0.7203[/C][C]0.237068[/C][/ROW]
[/TABLE]
Source: https://freestatistics.org/blog/index.php?pk=294075&T=2

Globally Unique Identifier (entire table): ba.freestatistics.org/blog/index.php?pk=294075&T=2

As an alternative you can also use a QR Code:  

The GUIDs for individual cells are displayed in the table below:

Partial Autocorrelation Function
Time lag kPACF(k)T-STATP-value
10.2390921.8520.034474
2-0.093492-0.72420.235884
30.1502961.16420.124478
40.1621441.2560.106999
50.0031630.02450.490267
60.319382.47390.008106
7-0.144123-1.11640.134357
80.1577721.22210.113225
9-0.311359-2.41180.009476
10-0.15482-1.19920.117577
110.1534641.18870.119616
120.3162512.44970.008617
13-0.171741-1.33030.094227
14-0.142967-1.10740.136267
15-0.119482-0.92550.179206
160.0084220.06520.474102
170.0942810.73030.234026
18-0.07256-0.5620.288089
190.136691.05880.146968
200.0037960.02940.488321
21-0.036003-0.27890.39065
220.0398160.30840.379419
23-0.183377-1.42040.080329
240.1531641.18640.120069
250.0278290.21560.415029
26-0.107091-0.82950.205048
270.0681510.52790.299759
28-0.004047-0.03130.487549
29-0.091592-0.70950.240391
300.0875740.67830.250081
31-0.008824-0.06840.472866
32-0.033628-0.26050.397692
330.0407680.31580.37663
34-0.033008-0.25570.399538
35-0.067283-0.52120.302084
36-0.038228-0.29610.384085
37-0.007055-0.05460.4783
38-0.032494-0.25170.401068
390.0342970.26570.395705
40-0.059256-0.4590.323949
410.0725510.5620.288112
42-0.065794-0.50960.306086
43-0.029848-0.23120.408972
44-0.075191-0.58240.28123
45-0.063041-0.48830.313553
46-0.02116-0.16390.43518
47-0.053131-0.41160.341068
48-0.092991-0.72030.237068


Parameters (Session):
par1 = 48 ; par2 = 1 ; par3 = 0 ; par4 = 0 ; par5 = 12 ; par6 = White Noise ; par7 = 0.95 ;
Parameters (R input):
par1 = 48 ; par2 = 1 ; par3 = 0 ; par4 = 0 ; par5 = 12 ; par6 = White Noise ; par7 = 0.95 ; par8 = ;
R code (references can be found in the software module):
if (par1 == 'Default') {
par1 = 10*log10(length(x))
} else {
par1 <- as.numeric(par1)
}
par2 <- as.numeric(par2)
par3 <- as.numeric(par3)
par4 <- as.numeric(par4)
par5 <- as.numeric(par5)
if (par6 == 'White Noise') par6 <- 'white' else par6 <- 'ma'
par7 <- as.numeric(par7)
if (par8 != '') par8 <- as.numeric(par8)
x <- na.omit(x)
ox <- x
if (par8 == '') {
if (par2 == 0) {
x <- log(x)
} else {
x <- (x ^ par2 - 1) / par2
}
} else {
x <- log(x,base=par8)
}
if (par3 > 0) x <- diff(x,lag=1,difference=par3)
if (par4 > 0) x <- diff(x,lag=par5,difference=par4)
bitmap(file='picts.png')
op <- par(mfrow=c(2,1))
plot(ox,type='l',main='Original Time Series',xlab='time',ylab='value')
if (par8=='') {
mytitle <- paste('Working Time Series (lambda=',par2,', d=',par3,', D=',par4,')',sep='')
mysub <- paste('(lambda=',par2,', d=',par3,', D=',par4,', CI=', par7, ', CI type=',par6,')',sep='')
} else {
mytitle <- paste('Working Time Series (base=',par8,', d=',par3,', D=',par4,')',sep='')
mysub <- paste('(base=',par8,', d=',par3,', D=',par4,', CI=', par7, ', CI type=',par6,')',sep='')
}
plot(x,type='l', main=mytitle,xlab='time',ylab='value')
par(op)
dev.off()
bitmap(file='pic1.png')
racf <- acf(x, par1, main='Autocorrelation', xlab='time lag', ylab='ACF', ci.type=par6, ci=par7, sub=mysub)
dev.off()
bitmap(file='pic2.png')
rpacf <- pacf(x,par1,main='Partial Autocorrelation',xlab='lags',ylab='PACF',sub=mysub)
dev.off()
(myacf <- c(racf$acf))
(mypacf <- c(rpacf$acf))
lengthx <- length(x)
sqrtn <- sqrt(lengthx)
load(file='createtable')
a<-table.start()
a<-table.row.start(a)
a<-table.element(a,'Autocorrelation Function',4,TRUE)
a<-table.row.end(a)
a<-table.row.start(a)
a<-table.element(a,'Time lag k',header=TRUE)
a<-table.element(a,hyperlink('basics.htm','ACF(k)','click here for more information about the Autocorrelation Function'),header=TRUE)
a<-table.element(a,'T-STAT',header=TRUE)
a<-table.element(a,'P-value',header=TRUE)
a<-table.row.end(a)
for (i in 2:(par1+1)) {
a<-table.row.start(a)
a<-table.element(a,i-1,header=TRUE)
a<-table.element(a,round(myacf[i],6))
mytstat <- myacf[i]*sqrtn
a<-table.element(a,round(mytstat,4))
a<-table.element(a,round(1-pt(abs(mytstat),lengthx),6))
a<-table.row.end(a)
}
a<-table.end(a)
table.save(a,file='mytable.tab')
a<-table.start()
a<-table.row.start(a)
a<-table.element(a,'Partial Autocorrelation Function',4,TRUE)
a<-table.row.end(a)
a<-table.row.start(a)
a<-table.element(a,'Time lag k',header=TRUE)
a<-table.element(a,hyperlink('basics.htm','PACF(k)','click here for more information about the Partial Autocorrelation Function'),header=TRUE)
a<-table.element(a,'T-STAT',header=TRUE)
a<-table.element(a,'P-value',header=TRUE)
a<-table.row.end(a)
for (i in 1:par1) {
a<-table.row.start(a)
a<-table.element(a,i,header=TRUE)
a<-table.element(a,round(mypacf[i],6))
mytstat <- mypacf[i]*sqrtn
a<-table.element(a,round(mytstat,4))
a<-table.element(a,round(1-pt(abs(mytstat),lengthx),6))
a<-table.row.end(a)
}
a<-table.end(a)
table.save(a,file='mytable1.tab')