Free Statistics

of Irreproducible Research!

Author's title

Author*Unverified author*
R Software Modulerwasp_autocorrelation.wasp
Title produced by software(Partial) Autocorrelation Function
Date of computationTue, 15 Mar 2016 14:31:49 +0000
Cite this page as followsStatistical Computations at FreeStatistics.org, Office for Research Development and Education, URL https://freestatistics.org/blog/index.php?v=date/2016/Mar/15/t1458052372mfyi1o19pm7j18p.htm/, Retrieved Tue, 30 Apr 2024 12:38:06 +0000
Statistical Computations at FreeStatistics.org, Office for Research Development and Education, URL https://freestatistics.org/blog/index.php?pk=294076, Retrieved Tue, 30 Apr 2024 12:38:06 +0000
QR Codes:

Original text written by user:
IsPrivate?No (this computation is public)
User-defined keywords
Estimated Impact111
Family? (F = Feedback message, R = changed R code, M = changed R Module, P = changed Parameters, D = changed Data)
-     [Mean Plot] [] [2016-03-15 13:51:24] [a134250e9068373a091df7e7ff2776c7]
- RMPD    [(Partial) Autocorrelation Function] [] [2016-03-15 14:31:49] [dce1b7f6243247e331d0750a8103b593] [Current]
Feedback Forum

Post a new message
Dataseries X:
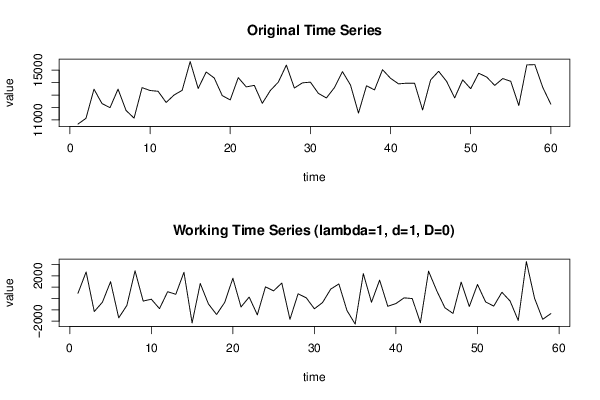
10670.5
11129
13474.5
12317.8
11990.1
13478.3
11762.4
11149.1
13597.2
13367.9
13304.2
12407.2
13008.3
13379.5
15696
13529.6
14857
14375.1
12958.4
12612.8
14405.2
13655.8
13783.1
12336.1
13366.7
14042.4
15412
13566.5
13981.5
14042
13131
12771.2
13600.1
14886.9
13813.1
11551
13750.5
13415.4
15040.9
14349.5
13900.2
13956.6
13951
11802.1
14219.1
14914.5
14098.2
12773.6
14225
13513
14754.4
14447.7
13777.8
14328.6
14106.1
12157
15425.1
15448.8
13604.5
12269.3


Summary of computational transaction
Raw Inputview raw input (R code)
Raw Outputview raw output of R engine
Computing time1 seconds
R Server'George Udny Yule' @ yule.wessa.net

\begin{tabular}{lllllllll}
\hline
Summary of computational transaction \tabularnewline
Raw Input & view raw input (R code)  \tabularnewline
Raw Output & view raw output of R engine  \tabularnewline
Computing time & 1 seconds \tabularnewline
R Server & 'George Udny Yule' @ yule.wessa.net \tabularnewline
\hline
\end{tabular}
%Source: https://freestatistics.org/blog/index.php?pk=294076&T=0

[TABLE]
[ROW][C]Summary of computational transaction[/C][/ROW]
[ROW][C]Raw Input[/C][C]view raw input (R code) [/C][/ROW]
[ROW][C]Raw Output[/C][C]view raw output of R engine [/C][/ROW]
[ROW][C]Computing time[/C][C]1 seconds[/C][/ROW]
[ROW][C]R Server[/C][C]'George Udny Yule' @ yule.wessa.net[/C][/ROW]
[/TABLE]
Source: https://freestatistics.org/blog/index.php?pk=294076&T=0

Globally Unique Identifier (entire table): ba.freestatistics.org/blog/index.php?pk=294076&T=0

As an alternative you can also use a QR Code:  

The GUIDs for individual cells are displayed in the table below:

Summary of computational transaction
Raw Inputview raw input (R code)
Raw Outputview raw output of R engine
Computing time1 seconds
R Server'George Udny Yule' @ yule.wessa.net


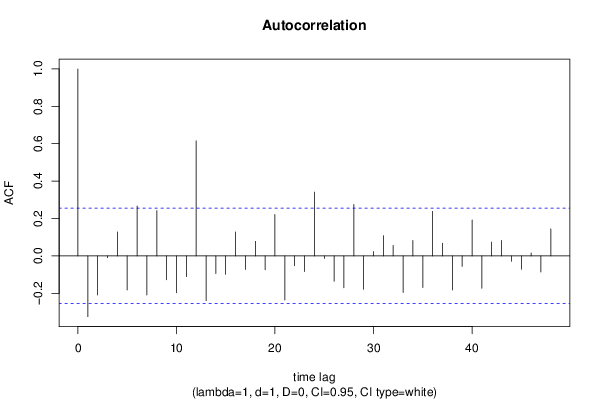
Autocorrelation Function
Time lag kACF(k)T-STATP-value
1-0.324813-2.49490.007708
2-0.20872-1.60320.057115
3-0.009809-0.07530.470097
40.1279220.98260.164912
5-0.182631-1.40280.082956
60.2668782.04990.022412
7-0.208765-1.60360.057076
80.242371.86170.033816
9-0.127594-0.98010.165528
10-0.197073-1.51370.067715
11-0.110933-0.85210.198804
120.6153694.72677e-06
13-0.239158-1.8370.035623
14-0.094043-0.72240.236463
15-0.098431-0.75610.226309
160.1276240.98030.165471
17-0.072869-0.55970.288895
180.0777240.5970.276393
19-0.073975-0.56820.286023
200.2218951.70440.046783
21-0.235622-1.80980.037707
22-0.052228-0.40120.344873
23-0.08302-0.63770.263072
240.3413672.62210.005551
25-0.013847-0.10640.457827
26-0.135814-1.04320.150553
27-0.169953-1.30540.098406
280.2746512.10960.019571
29-0.178558-1.37150.087702
300.0235540.18090.428526
310.1080110.82970.20504
320.0553880.42540.336031
33-0.195497-1.50160.069261
340.0822720.63190.264934
35-0.169234-1.29990.099344
360.2383881.83110.036069
370.0675420.51880.302919
38-0.182159-1.39920.083495
39-0.055931-0.42960.334522
400.1921151.47570.072675
41-0.17329-1.33110.094144
420.0737580.56650.286586
430.0826490.63480.263993
44-0.028792-0.22120.412866
45-0.071551-0.54960.292338
460.0157640.12110.452018
47-0.086017-0.66070.255685
480.1445161.110.135741

\begin{tabular}{lllllllll}
\hline
Autocorrelation Function \tabularnewline
Time lag k & ACF(k) & T-STAT & P-value \tabularnewline
1 & -0.324813 & -2.4949 & 0.007708 \tabularnewline
2 & -0.20872 & -1.6032 & 0.057115 \tabularnewline
3 & -0.009809 & -0.0753 & 0.470097 \tabularnewline
4 & 0.127922 & 0.9826 & 0.164912 \tabularnewline
5 & -0.182631 & -1.4028 & 0.082956 \tabularnewline
6 & 0.266878 & 2.0499 & 0.022412 \tabularnewline
7 & -0.208765 & -1.6036 & 0.057076 \tabularnewline
8 & 0.24237 & 1.8617 & 0.033816 \tabularnewline
9 & -0.127594 & -0.9801 & 0.165528 \tabularnewline
10 & -0.197073 & -1.5137 & 0.067715 \tabularnewline
11 & -0.110933 & -0.8521 & 0.198804 \tabularnewline
12 & 0.615369 & 4.7267 & 7e-06 \tabularnewline
13 & -0.239158 & -1.837 & 0.035623 \tabularnewline
14 & -0.094043 & -0.7224 & 0.236463 \tabularnewline
15 & -0.098431 & -0.7561 & 0.226309 \tabularnewline
16 & 0.127624 & 0.9803 & 0.165471 \tabularnewline
17 & -0.072869 & -0.5597 & 0.288895 \tabularnewline
18 & 0.077724 & 0.597 & 0.276393 \tabularnewline
19 & -0.073975 & -0.5682 & 0.286023 \tabularnewline
20 & 0.221895 & 1.7044 & 0.046783 \tabularnewline
21 & -0.235622 & -1.8098 & 0.037707 \tabularnewline
22 & -0.052228 & -0.4012 & 0.344873 \tabularnewline
23 & -0.08302 & -0.6377 & 0.263072 \tabularnewline
24 & 0.341367 & 2.6221 & 0.005551 \tabularnewline
25 & -0.013847 & -0.1064 & 0.457827 \tabularnewline
26 & -0.135814 & -1.0432 & 0.150553 \tabularnewline
27 & -0.169953 & -1.3054 & 0.098406 \tabularnewline
28 & 0.274651 & 2.1096 & 0.019571 \tabularnewline
29 & -0.178558 & -1.3715 & 0.087702 \tabularnewline
30 & 0.023554 & 0.1809 & 0.428526 \tabularnewline
31 & 0.108011 & 0.8297 & 0.20504 \tabularnewline
32 & 0.055388 & 0.4254 & 0.336031 \tabularnewline
33 & -0.195497 & -1.5016 & 0.069261 \tabularnewline
34 & 0.082272 & 0.6319 & 0.264934 \tabularnewline
35 & -0.169234 & -1.2999 & 0.099344 \tabularnewline
36 & 0.238388 & 1.8311 & 0.036069 \tabularnewline
37 & 0.067542 & 0.5188 & 0.302919 \tabularnewline
38 & -0.182159 & -1.3992 & 0.083495 \tabularnewline
39 & -0.055931 & -0.4296 & 0.334522 \tabularnewline
40 & 0.192115 & 1.4757 & 0.072675 \tabularnewline
41 & -0.17329 & -1.3311 & 0.094144 \tabularnewline
42 & 0.073758 & 0.5665 & 0.286586 \tabularnewline
43 & 0.082649 & 0.6348 & 0.263993 \tabularnewline
44 & -0.028792 & -0.2212 & 0.412866 \tabularnewline
45 & -0.071551 & -0.5496 & 0.292338 \tabularnewline
46 & 0.015764 & 0.1211 & 0.452018 \tabularnewline
47 & -0.086017 & -0.6607 & 0.255685 \tabularnewline
48 & 0.144516 & 1.11 & 0.135741 \tabularnewline
\hline
\end{tabular}
%Source: https://freestatistics.org/blog/index.php?pk=294076&T=1

[TABLE]
[ROW][C]Autocorrelation Function[/C][/ROW]
[ROW][C]Time lag k[/C][C]ACF(k)[/C][C]T-STAT[/C][C]P-value[/C][/ROW]
[ROW][C]1[/C][C]-0.324813[/C][C]-2.4949[/C][C]0.007708[/C][/ROW]
[ROW][C]2[/C][C]-0.20872[/C][C]-1.6032[/C][C]0.057115[/C][/ROW]
[ROW][C]3[/C][C]-0.009809[/C][C]-0.0753[/C][C]0.470097[/C][/ROW]
[ROW][C]4[/C][C]0.127922[/C][C]0.9826[/C][C]0.164912[/C][/ROW]
[ROW][C]5[/C][C]-0.182631[/C][C]-1.4028[/C][C]0.082956[/C][/ROW]
[ROW][C]6[/C][C]0.266878[/C][C]2.0499[/C][C]0.022412[/C][/ROW]
[ROW][C]7[/C][C]-0.208765[/C][C]-1.6036[/C][C]0.057076[/C][/ROW]
[ROW][C]8[/C][C]0.24237[/C][C]1.8617[/C][C]0.033816[/C][/ROW]
[ROW][C]9[/C][C]-0.127594[/C][C]-0.9801[/C][C]0.165528[/C][/ROW]
[ROW][C]10[/C][C]-0.197073[/C][C]-1.5137[/C][C]0.067715[/C][/ROW]
[ROW][C]11[/C][C]-0.110933[/C][C]-0.8521[/C][C]0.198804[/C][/ROW]
[ROW][C]12[/C][C]0.615369[/C][C]4.7267[/C][C]7e-06[/C][/ROW]
[ROW][C]13[/C][C]-0.239158[/C][C]-1.837[/C][C]0.035623[/C][/ROW]
[ROW][C]14[/C][C]-0.094043[/C][C]-0.7224[/C][C]0.236463[/C][/ROW]
[ROW][C]15[/C][C]-0.098431[/C][C]-0.7561[/C][C]0.226309[/C][/ROW]
[ROW][C]16[/C][C]0.127624[/C][C]0.9803[/C][C]0.165471[/C][/ROW]
[ROW][C]17[/C][C]-0.072869[/C][C]-0.5597[/C][C]0.288895[/C][/ROW]
[ROW][C]18[/C][C]0.077724[/C][C]0.597[/C][C]0.276393[/C][/ROW]
[ROW][C]19[/C][C]-0.073975[/C][C]-0.5682[/C][C]0.286023[/C][/ROW]
[ROW][C]20[/C][C]0.221895[/C][C]1.7044[/C][C]0.046783[/C][/ROW]
[ROW][C]21[/C][C]-0.235622[/C][C]-1.8098[/C][C]0.037707[/C][/ROW]
[ROW][C]22[/C][C]-0.052228[/C][C]-0.4012[/C][C]0.344873[/C][/ROW]
[ROW][C]23[/C][C]-0.08302[/C][C]-0.6377[/C][C]0.263072[/C][/ROW]
[ROW][C]24[/C][C]0.341367[/C][C]2.6221[/C][C]0.005551[/C][/ROW]
[ROW][C]25[/C][C]-0.013847[/C][C]-0.1064[/C][C]0.457827[/C][/ROW]
[ROW][C]26[/C][C]-0.135814[/C][C]-1.0432[/C][C]0.150553[/C][/ROW]
[ROW][C]27[/C][C]-0.169953[/C][C]-1.3054[/C][C]0.098406[/C][/ROW]
[ROW][C]28[/C][C]0.274651[/C][C]2.1096[/C][C]0.019571[/C][/ROW]
[ROW][C]29[/C][C]-0.178558[/C][C]-1.3715[/C][C]0.087702[/C][/ROW]
[ROW][C]30[/C][C]0.023554[/C][C]0.1809[/C][C]0.428526[/C][/ROW]
[ROW][C]31[/C][C]0.108011[/C][C]0.8297[/C][C]0.20504[/C][/ROW]
[ROW][C]32[/C][C]0.055388[/C][C]0.4254[/C][C]0.336031[/C][/ROW]
[ROW][C]33[/C][C]-0.195497[/C][C]-1.5016[/C][C]0.069261[/C][/ROW]
[ROW][C]34[/C][C]0.082272[/C][C]0.6319[/C][C]0.264934[/C][/ROW]
[ROW][C]35[/C][C]-0.169234[/C][C]-1.2999[/C][C]0.099344[/C][/ROW]
[ROW][C]36[/C][C]0.238388[/C][C]1.8311[/C][C]0.036069[/C][/ROW]
[ROW][C]37[/C][C]0.067542[/C][C]0.5188[/C][C]0.302919[/C][/ROW]
[ROW][C]38[/C][C]-0.182159[/C][C]-1.3992[/C][C]0.083495[/C][/ROW]
[ROW][C]39[/C][C]-0.055931[/C][C]-0.4296[/C][C]0.334522[/C][/ROW]
[ROW][C]40[/C][C]0.192115[/C][C]1.4757[/C][C]0.072675[/C][/ROW]
[ROW][C]41[/C][C]-0.17329[/C][C]-1.3311[/C][C]0.094144[/C][/ROW]
[ROW][C]42[/C][C]0.073758[/C][C]0.5665[/C][C]0.286586[/C][/ROW]
[ROW][C]43[/C][C]0.082649[/C][C]0.6348[/C][C]0.263993[/C][/ROW]
[ROW][C]44[/C][C]-0.028792[/C][C]-0.2212[/C][C]0.412866[/C][/ROW]
[ROW][C]45[/C][C]-0.071551[/C][C]-0.5496[/C][C]0.292338[/C][/ROW]
[ROW][C]46[/C][C]0.015764[/C][C]0.1211[/C][C]0.452018[/C][/ROW]
[ROW][C]47[/C][C]-0.086017[/C][C]-0.6607[/C][C]0.255685[/C][/ROW]
[ROW][C]48[/C][C]0.144516[/C][C]1.11[/C][C]0.135741[/C][/ROW]
[/TABLE]
Source: https://freestatistics.org/blog/index.php?pk=294076&T=1

Globally Unique Identifier (entire table): ba.freestatistics.org/blog/index.php?pk=294076&T=1

As an alternative you can also use a QR Code:  

The GUIDs for individual cells are displayed in the table below:

Autocorrelation Function
Time lag kACF(k)T-STATP-value
1-0.324813-2.49490.007708
2-0.20872-1.60320.057115
3-0.009809-0.07530.470097
40.1279220.98260.164912
5-0.182631-1.40280.082956
60.2668782.04990.022412
7-0.208765-1.60360.057076
80.242371.86170.033816
9-0.127594-0.98010.165528
10-0.197073-1.51370.067715
11-0.110933-0.85210.198804
120.6153694.72677e-06
13-0.239158-1.8370.035623
14-0.094043-0.72240.236463
15-0.098431-0.75610.226309
160.1276240.98030.165471
17-0.072869-0.55970.288895
180.0777240.5970.276393
19-0.073975-0.56820.286023
200.2218951.70440.046783
21-0.235622-1.80980.037707
22-0.052228-0.40120.344873
23-0.08302-0.63770.263072
240.3413672.62210.005551
25-0.013847-0.10640.457827
26-0.135814-1.04320.150553
27-0.169953-1.30540.098406
280.2746512.10960.019571
29-0.178558-1.37150.087702
300.0235540.18090.428526
310.1080110.82970.20504
320.0553880.42540.336031
33-0.195497-1.50160.069261
340.0822720.63190.264934
35-0.169234-1.29990.099344
360.2383881.83110.036069
370.0675420.51880.302919
38-0.182159-1.39920.083495
39-0.055931-0.42960.334522
400.1921151.47570.072675
41-0.17329-1.33110.094144
420.0737580.56650.286586
430.0826490.63480.263993
44-0.028792-0.22120.412866
45-0.071551-0.54960.292338
460.0157640.12110.452018
47-0.086017-0.66070.255685
480.1445161.110.135741


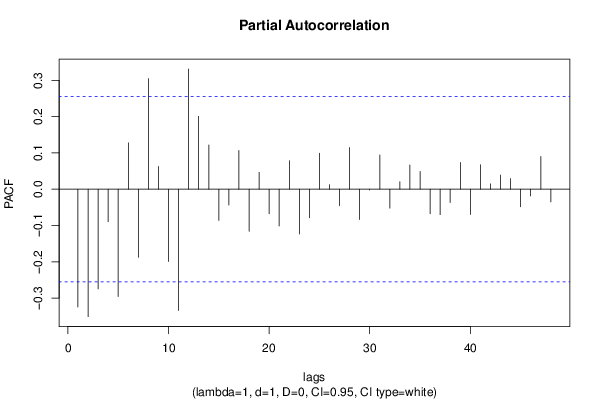
Partial Autocorrelation Function
Time lag kPACF(k)T-STATP-value
1-0.324813-2.49490.007708
2-0.351286-2.69830.004538
3-0.274861-2.11120.019499
4-0.089822-0.68990.24647
5-0.295681-2.27120.0134
60.127580.980.165553
7-0.187532-1.44050.077511
80.3046752.34030.011336
90.0625810.48070.316256
10-0.199167-1.52980.065702
11-0.334311-2.56790.006392
120.3312262.54420.006796
130.2010621.54440.063921
140.1216130.93410.177023
15-0.085956-0.66020.255834
16-0.043707-0.33570.369136
170.106770.82010.207725
18-0.115778-0.88930.188725
190.0462720.35540.36177
20-0.067965-0.5220.301796
21-0.10163-0.78060.219068
220.0780990.59990.275439
23-0.123677-0.950.172998
24-0.0789-0.6060.273404
250.0989140.75980.225208
260.0125140.09610.461875
27-0.045902-0.35260.36283
280.114960.8830.190404
29-0.083847-0.6440.261023
30-0.002243-0.01720.493158
310.0942820.72420.235904
32-0.052245-0.40130.344825
330.0205850.15810.437453
340.0667880.5130.304929
350.0488060.37490.354544
36-0.067774-0.52060.302303
37-0.070137-0.53870.296049
38-0.036968-0.2840.388719
390.0736090.56540.286973
40-0.069717-0.53550.297156
410.0673580.51740.30341
420.0146070.11220.455524
430.0387090.29730.38363
440.0289950.22270.412262
45-0.048426-0.3720.355626
46-0.018489-0.1420.443776
470.0899670.6910.246123
48-0.035-0.26880.394496

\begin{tabular}{lllllllll}
\hline
Partial Autocorrelation Function \tabularnewline
Time lag k & PACF(k) & T-STAT & P-value \tabularnewline
1 & -0.324813 & -2.4949 & 0.007708 \tabularnewline
2 & -0.351286 & -2.6983 & 0.004538 \tabularnewline
3 & -0.274861 & -2.1112 & 0.019499 \tabularnewline
4 & -0.089822 & -0.6899 & 0.24647 \tabularnewline
5 & -0.295681 & -2.2712 & 0.0134 \tabularnewline
6 & 0.12758 & 0.98 & 0.165553 \tabularnewline
7 & -0.187532 & -1.4405 & 0.077511 \tabularnewline
8 & 0.304675 & 2.3403 & 0.011336 \tabularnewline
9 & 0.062581 & 0.4807 & 0.316256 \tabularnewline
10 & -0.199167 & -1.5298 & 0.065702 \tabularnewline
11 & -0.334311 & -2.5679 & 0.006392 \tabularnewline
12 & 0.331226 & 2.5442 & 0.006796 \tabularnewline
13 & 0.201062 & 1.5444 & 0.063921 \tabularnewline
14 & 0.121613 & 0.9341 & 0.177023 \tabularnewline
15 & -0.085956 & -0.6602 & 0.255834 \tabularnewline
16 & -0.043707 & -0.3357 & 0.369136 \tabularnewline
17 & 0.10677 & 0.8201 & 0.207725 \tabularnewline
18 & -0.115778 & -0.8893 & 0.188725 \tabularnewline
19 & 0.046272 & 0.3554 & 0.36177 \tabularnewline
20 & -0.067965 & -0.522 & 0.301796 \tabularnewline
21 & -0.10163 & -0.7806 & 0.219068 \tabularnewline
22 & 0.078099 & 0.5999 & 0.275439 \tabularnewline
23 & -0.123677 & -0.95 & 0.172998 \tabularnewline
24 & -0.0789 & -0.606 & 0.273404 \tabularnewline
25 & 0.098914 & 0.7598 & 0.225208 \tabularnewline
26 & 0.012514 & 0.0961 & 0.461875 \tabularnewline
27 & -0.045902 & -0.3526 & 0.36283 \tabularnewline
28 & 0.11496 & 0.883 & 0.190404 \tabularnewline
29 & -0.083847 & -0.644 & 0.261023 \tabularnewline
30 & -0.002243 & -0.0172 & 0.493158 \tabularnewline
31 & 0.094282 & 0.7242 & 0.235904 \tabularnewline
32 & -0.052245 & -0.4013 & 0.344825 \tabularnewline
33 & 0.020585 & 0.1581 & 0.437453 \tabularnewline
34 & 0.066788 & 0.513 & 0.304929 \tabularnewline
35 & 0.048806 & 0.3749 & 0.354544 \tabularnewline
36 & -0.067774 & -0.5206 & 0.302303 \tabularnewline
37 & -0.070137 & -0.5387 & 0.296049 \tabularnewline
38 & -0.036968 & -0.284 & 0.388719 \tabularnewline
39 & 0.073609 & 0.5654 & 0.286973 \tabularnewline
40 & -0.069717 & -0.5355 & 0.297156 \tabularnewline
41 & 0.067358 & 0.5174 & 0.30341 \tabularnewline
42 & 0.014607 & 0.1122 & 0.455524 \tabularnewline
43 & 0.038709 & 0.2973 & 0.38363 \tabularnewline
44 & 0.028995 & 0.2227 & 0.412262 \tabularnewline
45 & -0.048426 & -0.372 & 0.355626 \tabularnewline
46 & -0.018489 & -0.142 & 0.443776 \tabularnewline
47 & 0.089967 & 0.691 & 0.246123 \tabularnewline
48 & -0.035 & -0.2688 & 0.394496 \tabularnewline
\hline
\end{tabular}
%Source: https://freestatistics.org/blog/index.php?pk=294076&T=2

[TABLE]
[ROW][C]Partial Autocorrelation Function[/C][/ROW]
[ROW][C]Time lag k[/C][C]PACF(k)[/C][C]T-STAT[/C][C]P-value[/C][/ROW]
[ROW][C]1[/C][C]-0.324813[/C][C]-2.4949[/C][C]0.007708[/C][/ROW]
[ROW][C]2[/C][C]-0.351286[/C][C]-2.6983[/C][C]0.004538[/C][/ROW]
[ROW][C]3[/C][C]-0.274861[/C][C]-2.1112[/C][C]0.019499[/C][/ROW]
[ROW][C]4[/C][C]-0.089822[/C][C]-0.6899[/C][C]0.24647[/C][/ROW]
[ROW][C]5[/C][C]-0.295681[/C][C]-2.2712[/C][C]0.0134[/C][/ROW]
[ROW][C]6[/C][C]0.12758[/C][C]0.98[/C][C]0.165553[/C][/ROW]
[ROW][C]7[/C][C]-0.187532[/C][C]-1.4405[/C][C]0.077511[/C][/ROW]
[ROW][C]8[/C][C]0.304675[/C][C]2.3403[/C][C]0.011336[/C][/ROW]
[ROW][C]9[/C][C]0.062581[/C][C]0.4807[/C][C]0.316256[/C][/ROW]
[ROW][C]10[/C][C]-0.199167[/C][C]-1.5298[/C][C]0.065702[/C][/ROW]
[ROW][C]11[/C][C]-0.334311[/C][C]-2.5679[/C][C]0.006392[/C][/ROW]
[ROW][C]12[/C][C]0.331226[/C][C]2.5442[/C][C]0.006796[/C][/ROW]
[ROW][C]13[/C][C]0.201062[/C][C]1.5444[/C][C]0.063921[/C][/ROW]
[ROW][C]14[/C][C]0.121613[/C][C]0.9341[/C][C]0.177023[/C][/ROW]
[ROW][C]15[/C][C]-0.085956[/C][C]-0.6602[/C][C]0.255834[/C][/ROW]
[ROW][C]16[/C][C]-0.043707[/C][C]-0.3357[/C][C]0.369136[/C][/ROW]
[ROW][C]17[/C][C]0.10677[/C][C]0.8201[/C][C]0.207725[/C][/ROW]
[ROW][C]18[/C][C]-0.115778[/C][C]-0.8893[/C][C]0.188725[/C][/ROW]
[ROW][C]19[/C][C]0.046272[/C][C]0.3554[/C][C]0.36177[/C][/ROW]
[ROW][C]20[/C][C]-0.067965[/C][C]-0.522[/C][C]0.301796[/C][/ROW]
[ROW][C]21[/C][C]-0.10163[/C][C]-0.7806[/C][C]0.219068[/C][/ROW]
[ROW][C]22[/C][C]0.078099[/C][C]0.5999[/C][C]0.275439[/C][/ROW]
[ROW][C]23[/C][C]-0.123677[/C][C]-0.95[/C][C]0.172998[/C][/ROW]
[ROW][C]24[/C][C]-0.0789[/C][C]-0.606[/C][C]0.273404[/C][/ROW]
[ROW][C]25[/C][C]0.098914[/C][C]0.7598[/C][C]0.225208[/C][/ROW]
[ROW][C]26[/C][C]0.012514[/C][C]0.0961[/C][C]0.461875[/C][/ROW]
[ROW][C]27[/C][C]-0.045902[/C][C]-0.3526[/C][C]0.36283[/C][/ROW]
[ROW][C]28[/C][C]0.11496[/C][C]0.883[/C][C]0.190404[/C][/ROW]
[ROW][C]29[/C][C]-0.083847[/C][C]-0.644[/C][C]0.261023[/C][/ROW]
[ROW][C]30[/C][C]-0.002243[/C][C]-0.0172[/C][C]0.493158[/C][/ROW]
[ROW][C]31[/C][C]0.094282[/C][C]0.7242[/C][C]0.235904[/C][/ROW]
[ROW][C]32[/C][C]-0.052245[/C][C]-0.4013[/C][C]0.344825[/C][/ROW]
[ROW][C]33[/C][C]0.020585[/C][C]0.1581[/C][C]0.437453[/C][/ROW]
[ROW][C]34[/C][C]0.066788[/C][C]0.513[/C][C]0.304929[/C][/ROW]
[ROW][C]35[/C][C]0.048806[/C][C]0.3749[/C][C]0.354544[/C][/ROW]
[ROW][C]36[/C][C]-0.067774[/C][C]-0.5206[/C][C]0.302303[/C][/ROW]
[ROW][C]37[/C][C]-0.070137[/C][C]-0.5387[/C][C]0.296049[/C][/ROW]
[ROW][C]38[/C][C]-0.036968[/C][C]-0.284[/C][C]0.388719[/C][/ROW]
[ROW][C]39[/C][C]0.073609[/C][C]0.5654[/C][C]0.286973[/C][/ROW]
[ROW][C]40[/C][C]-0.069717[/C][C]-0.5355[/C][C]0.297156[/C][/ROW]
[ROW][C]41[/C][C]0.067358[/C][C]0.5174[/C][C]0.30341[/C][/ROW]
[ROW][C]42[/C][C]0.014607[/C][C]0.1122[/C][C]0.455524[/C][/ROW]
[ROW][C]43[/C][C]0.038709[/C][C]0.2973[/C][C]0.38363[/C][/ROW]
[ROW][C]44[/C][C]0.028995[/C][C]0.2227[/C][C]0.412262[/C][/ROW]
[ROW][C]45[/C][C]-0.048426[/C][C]-0.372[/C][C]0.355626[/C][/ROW]
[ROW][C]46[/C][C]-0.018489[/C][C]-0.142[/C][C]0.443776[/C][/ROW]
[ROW][C]47[/C][C]0.089967[/C][C]0.691[/C][C]0.246123[/C][/ROW]
[ROW][C]48[/C][C]-0.035[/C][C]-0.2688[/C][C]0.394496[/C][/ROW]
[/TABLE]
Source: https://freestatistics.org/blog/index.php?pk=294076&T=2

Globally Unique Identifier (entire table): ba.freestatistics.org/blog/index.php?pk=294076&T=2

As an alternative you can also use a QR Code:  

The GUIDs for individual cells are displayed in the table below:

Partial Autocorrelation Function
Time lag kPACF(k)T-STATP-value
1-0.324813-2.49490.007708
2-0.351286-2.69830.004538
3-0.274861-2.11120.019499
4-0.089822-0.68990.24647
5-0.295681-2.27120.0134
60.127580.980.165553
7-0.187532-1.44050.077511
80.3046752.34030.011336
90.0625810.48070.316256
10-0.199167-1.52980.065702
11-0.334311-2.56790.006392
120.3312262.54420.006796
130.2010621.54440.063921
140.1216130.93410.177023
15-0.085956-0.66020.255834
16-0.043707-0.33570.369136
170.106770.82010.207725
18-0.115778-0.88930.188725
190.0462720.35540.36177
20-0.067965-0.5220.301796
21-0.10163-0.78060.219068
220.0780990.59990.275439
23-0.123677-0.950.172998
24-0.0789-0.6060.273404
250.0989140.75980.225208
260.0125140.09610.461875
27-0.045902-0.35260.36283
280.114960.8830.190404
29-0.083847-0.6440.261023
30-0.002243-0.01720.493158
310.0942820.72420.235904
32-0.052245-0.40130.344825
330.0205850.15810.437453
340.0667880.5130.304929
350.0488060.37490.354544
36-0.067774-0.52060.302303
37-0.070137-0.53870.296049
38-0.036968-0.2840.388719
390.0736090.56540.286973
40-0.069717-0.53550.297156
410.0673580.51740.30341
420.0146070.11220.455524
430.0387090.29730.38363
440.0289950.22270.412262
45-0.048426-0.3720.355626
46-0.018489-0.1420.443776
470.0899670.6910.246123
48-0.035-0.26880.394496


Parameters (Session):
par1 = 48 ; par2 = 1 ; par3 = 1 ; par4 = 0 ; par5 = 12 ; par6 = White Noise ; par7 = 0.95 ;
Parameters (R input):
par1 = 48 ; par2 = 1 ; par3 = 1 ; par4 = 0 ; par5 = 12 ; par6 = White Noise ; par7 = 0.95 ; par8 = ;
R code (references can be found in the software module):
par8 <- ''
par7 <- '0.95'
par6 <- 'White Noise'
par5 <- '12'
par4 <- '0'
par3 <- '0'
par2 <- '1'
par1 <- '48'
if (par1 == 'Default') {
par1 = 10*log10(length(x))
} else {
par1 <- as.numeric(par1)
}
par2 <- as.numeric(par2)
par3 <- as.numeric(par3)
par4 <- as.numeric(par4)
par5 <- as.numeric(par5)
if (par6 == 'White Noise') par6 <- 'white' else par6 <- 'ma'
par7 <- as.numeric(par7)
if (par8 != '') par8 <- as.numeric(par8)
x <- na.omit(x)
ox <- x
if (par8 == '') {
if (par2 == 0) {
x <- log(x)
} else {
x <- (x ^ par2 - 1) / par2
}
} else {
x <- log(x,base=par8)
}
if (par3 > 0) x <- diff(x,lag=1,difference=par3)
if (par4 > 0) x <- diff(x,lag=par5,difference=par4)
bitmap(file='picts.png')
op <- par(mfrow=c(2,1))
plot(ox,type='l',main='Original Time Series',xlab='time',ylab='value')
if (par8=='') {
mytitle <- paste('Working Time Series (lambda=',par2,', d=',par3,', D=',par4,')',sep='')
mysub <- paste('(lambda=',par2,', d=',par3,', D=',par4,', CI=', par7, ', CI type=',par6,')',sep='')
} else {
mytitle <- paste('Working Time Series (base=',par8,', d=',par3,', D=',par4,')',sep='')
mysub <- paste('(base=',par8,', d=',par3,', D=',par4,', CI=', par7, ', CI type=',par6,')',sep='')
}
plot(x,type='l', main=mytitle,xlab='time',ylab='value')
par(op)
dev.off()
bitmap(file='pic1.png')
racf <- acf(x, par1, main='Autocorrelation', xlab='time lag', ylab='ACF', ci.type=par6, ci=par7, sub=mysub)
dev.off()
bitmap(file='pic2.png')
rpacf <- pacf(x,par1,main='Partial Autocorrelation',xlab='lags',ylab='PACF',sub=mysub)
dev.off()
(myacf <- c(racf$acf))
(mypacf <- c(rpacf$acf))
lengthx <- length(x)
sqrtn <- sqrt(lengthx)
load(file='createtable')
a<-table.start()
a<-table.row.start(a)
a<-table.element(a,'Autocorrelation Function',4,TRUE)
a<-table.row.end(a)
a<-table.row.start(a)
a<-table.element(a,'Time lag k',header=TRUE)
a<-table.element(a,hyperlink('basics.htm','ACF(k)','click here for more information about the Autocorrelation Function'),header=TRUE)
a<-table.element(a,'T-STAT',header=TRUE)
a<-table.element(a,'P-value',header=TRUE)
a<-table.row.end(a)
for (i in 2:(par1+1)) {
a<-table.row.start(a)
a<-table.element(a,i-1,header=TRUE)
a<-table.element(a,round(myacf[i],6))
mytstat <- myacf[i]*sqrtn
a<-table.element(a,round(mytstat,4))
a<-table.element(a,round(1-pt(abs(mytstat),lengthx),6))
a<-table.row.end(a)
}
a<-table.end(a)
table.save(a,file='mytable.tab')
a<-table.start()
a<-table.row.start(a)
a<-table.element(a,'Partial Autocorrelation Function',4,TRUE)
a<-table.row.end(a)
a<-table.row.start(a)
a<-table.element(a,'Time lag k',header=TRUE)
a<-table.element(a,hyperlink('basics.htm','PACF(k)','click here for more information about the Partial Autocorrelation Function'),header=TRUE)
a<-table.element(a,'T-STAT',header=TRUE)
a<-table.element(a,'P-value',header=TRUE)
a<-table.row.end(a)
for (i in 1:par1) {
a<-table.row.start(a)
a<-table.element(a,i,header=TRUE)
a<-table.element(a,round(mypacf[i],6))
mytstat <- mypacf[i]*sqrtn
a<-table.element(a,round(mytstat,4))
a<-table.element(a,round(1-pt(abs(mytstat),lengthx),6))
a<-table.row.end(a)
}
a<-table.end(a)
table.save(a,file='mytable1.tab')