Free Statistics

of Irreproducible Research!

Author's title

Author*Unverified author*
R Software Modulerwasp_autocorrelation.wasp
Title produced by software(Partial) Autocorrelation Function
Date of computationTue, 15 Mar 2016 16:33:09 +0000
Cite this page as followsStatistical Computations at FreeStatistics.org, Office for Research Development and Education, URL https://freestatistics.org/blog/index.php?v=date/2016/Mar/15/t1458059675zoxn0zuhw5nggvi.htm/, Retrieved Tue, 30 Apr 2024 15:25:11 +0000
Statistical Computations at FreeStatistics.org, Office for Research Development and Education, URL https://freestatistics.org/blog/index.php?pk=294079, Retrieved Tue, 30 Apr 2024 15:25:11 +0000
QR Codes:

Original text written by user:
IsPrivate?No (this computation is public)
User-defined keywords
Estimated Impact98
Family? (F = Feedback message, R = changed R code, M = changed R Module, P = changed Parameters, D = changed Data)
-       [(Partial) Autocorrelation Function] [] [2016-03-15 16:33:09] [f8975010d6e80ebfdd11eb899305ce74] [Current]
Feedback Forum

Post a new message
Dataseries X:
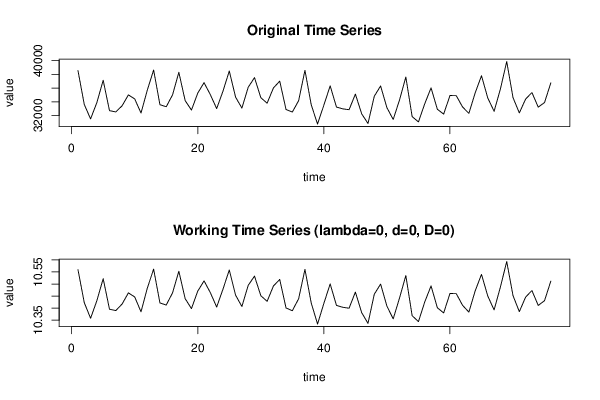
38552
33618
31499
33892
37134
32710
32520
33419
35003
34417
32359
35703
38632
33577
33277
35001
38296
34179
32791
35261
36789
35036
33004
35548
38485
34675
33081
36114
37524
34600
33795
36017
37009
32877
32505
34162
38591
33550
30753
33508
36327
33230
32971
32844
35124
32243
30840
34815
36308
33138
31425
34265
37612
31846
31065
33712
36031
32909
32204
34914
34888
33242
32316
35295
37800
34540
32614
35859
39866
34609
32375
34395
35348
33221
33892
36762


Summary of computational transaction
Raw Inputview raw input (R code)
Raw Outputview raw output of R engine
Computing time2 seconds
R Server'Sir Ronald Aylmer Fisher' @ fisher.wessa.net
R Framework error message
Warning: there are blank lines in the 'Data' field.
Please, use NA for missing data - blank lines are simply
 deleted and are NOT treated as missing values.

\begin{tabular}{lllllllll}
\hline
Summary of computational transaction \tabularnewline
Raw Input & view raw input (R code)  \tabularnewline
Raw Output & view raw output of R engine  \tabularnewline
Computing time & 2 seconds \tabularnewline
R Server & 'Sir Ronald Aylmer Fisher' @ fisher.wessa.net \tabularnewline
R Framework error message & 
Warning: there are blank lines in the 'Data' field.
Please, use NA for missing data - blank lines are simply
 deleted and are NOT treated as missing values.
\tabularnewline \hline \end{tabular} %Source: https://freestatistics.org/blog/index.php?pk=294079&T=0

[TABLE]
[ROW][C]Summary of computational transaction[/C][/ROW]
[ROW][C]Raw Input[/C][C]view raw input (R code) [/C][/ROW]
[ROW][C]Raw Output[/C][C]view raw output of R engine [/C][/ROW]
[ROW][C]Computing time[/C][C]2 seconds[/C][/ROW]
[ROW][C]R Server[/C][C]'Sir Ronald Aylmer Fisher' @ fisher.wessa.net[/C][/ROW]
[ROW][C]R Framework error message[/C][C]
Warning: there are blank lines in the 'Data' field.
Please, use NA for missing data - blank lines are simply
 deleted and are NOT treated as missing values.
[/C][/ROW] [/TABLE] Source: https://freestatistics.org/blog/index.php?pk=294079&T=0

Globally Unique Identifier (entire table): ba.freestatistics.org/blog/index.php?pk=294079&T=0

As an alternative you can also use a QR Code:  

The GUIDs for individual cells are displayed in the table below:

Summary of computational transaction
Raw Inputview raw input (R code)
Raw Outputview raw output of R engine
Computing time2 seconds
R Server'Sir Ronald Aylmer Fisher' @ fisher.wessa.net
R Framework error message
Warning: there are blank lines in the 'Data' field.
Please, use NA for missing data - blank lines are simply
 deleted and are NOT treated as missing values.


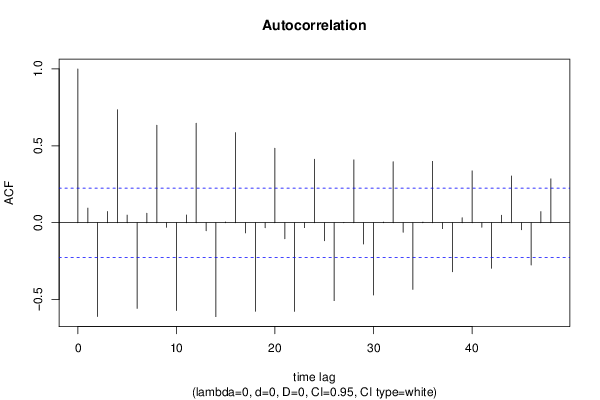
Autocorrelation Function
Time lag kACF(k)T-STATP-value
10.0947880.82630.205598
2-0.610621-5.32330
30.0729230.63570.263432
40.7352046.40940
50.0493150.42990.334235
6-0.557272-4.85823e-06
70.0611210.53280.29785
80.6336915.52440
9-0.029552-0.25760.398696
10-0.571324-4.98072e-06
110.0496390.43270.333212
120.6469745.64020
13-0.052769-0.460.323403
14-0.611165-5.3280
150.0050970.04440.482336
160.5858295.10711e-06
17-0.066353-0.57850.282334
18-0.576526-5.0262e-06
19-0.033009-0.28780.387154
200.4840534.21993.3e-05
21-0.104401-0.91010.182811
22-0.577146-5.03142e-06
23-0.032012-0.27910.390474
240.4131323.60160.000281
25-0.117332-1.02290.154805
26-0.506956-4.41951.6e-05
270.0018230.01590.493679
280.4086433.56250.000319
29-0.139034-1.21210.11462
30-0.470189-4.0995.1e-05
310.0039510.03440.486307
320.3965823.45730.000448
33-0.062742-0.5470.293001
34-0.433986-3.78340.000153
350.0039550.03450.486292
360.3989923.47830.000419
37-0.038689-0.33730.368417
38-0.319272-2.78330.003392
390.0321630.28040.389969
400.3369572.93750.002189
41-0.02954-0.25750.398735
42-0.295939-2.57990.005905
430.0488610.4260.335669
440.3041572.65160.004873
45-0.046323-0.40380.343734
46-0.274768-2.39540.009533
470.0720030.62770.266038
480.2851572.48590.007559

\begin{tabular}{lllllllll}
\hline
Autocorrelation Function \tabularnewline
Time lag k & ACF(k) & T-STAT & P-value \tabularnewline
1 & 0.094788 & 0.8263 & 0.205598 \tabularnewline
2 & -0.610621 & -5.3233 & 0 \tabularnewline
3 & 0.072923 & 0.6357 & 0.263432 \tabularnewline
4 & 0.735204 & 6.4094 & 0 \tabularnewline
5 & 0.049315 & 0.4299 & 0.334235 \tabularnewline
6 & -0.557272 & -4.8582 & 3e-06 \tabularnewline
7 & 0.061121 & 0.5328 & 0.29785 \tabularnewline
8 & 0.633691 & 5.5244 & 0 \tabularnewline
9 & -0.029552 & -0.2576 & 0.398696 \tabularnewline
10 & -0.571324 & -4.9807 & 2e-06 \tabularnewline
11 & 0.049639 & 0.4327 & 0.333212 \tabularnewline
12 & 0.646974 & 5.6402 & 0 \tabularnewline
13 & -0.052769 & -0.46 & 0.323403 \tabularnewline
14 & -0.611165 & -5.328 & 0 \tabularnewline
15 & 0.005097 & 0.0444 & 0.482336 \tabularnewline
16 & 0.585829 & 5.1071 & 1e-06 \tabularnewline
17 & -0.066353 & -0.5785 & 0.282334 \tabularnewline
18 & -0.576526 & -5.026 & 2e-06 \tabularnewline
19 & -0.033009 & -0.2878 & 0.387154 \tabularnewline
20 & 0.484053 & 4.2199 & 3.3e-05 \tabularnewline
21 & -0.104401 & -0.9101 & 0.182811 \tabularnewline
22 & -0.577146 & -5.0314 & 2e-06 \tabularnewline
23 & -0.032012 & -0.2791 & 0.390474 \tabularnewline
24 & 0.413132 & 3.6016 & 0.000281 \tabularnewline
25 & -0.117332 & -1.0229 & 0.154805 \tabularnewline
26 & -0.506956 & -4.4195 & 1.6e-05 \tabularnewline
27 & 0.001823 & 0.0159 & 0.493679 \tabularnewline
28 & 0.408643 & 3.5625 & 0.000319 \tabularnewline
29 & -0.139034 & -1.2121 & 0.11462 \tabularnewline
30 & -0.470189 & -4.099 & 5.1e-05 \tabularnewline
31 & 0.003951 & 0.0344 & 0.486307 \tabularnewline
32 & 0.396582 & 3.4573 & 0.000448 \tabularnewline
33 & -0.062742 & -0.547 & 0.293001 \tabularnewline
34 & -0.433986 & -3.7834 & 0.000153 \tabularnewline
35 & 0.003955 & 0.0345 & 0.486292 \tabularnewline
36 & 0.398992 & 3.4783 & 0.000419 \tabularnewline
37 & -0.038689 & -0.3373 & 0.368417 \tabularnewline
38 & -0.319272 & -2.7833 & 0.003392 \tabularnewline
39 & 0.032163 & 0.2804 & 0.389969 \tabularnewline
40 & 0.336957 & 2.9375 & 0.002189 \tabularnewline
41 & -0.02954 & -0.2575 & 0.398735 \tabularnewline
42 & -0.295939 & -2.5799 & 0.005905 \tabularnewline
43 & 0.048861 & 0.426 & 0.335669 \tabularnewline
44 & 0.304157 & 2.6516 & 0.004873 \tabularnewline
45 & -0.046323 & -0.4038 & 0.343734 \tabularnewline
46 & -0.274768 & -2.3954 & 0.009533 \tabularnewline
47 & 0.072003 & 0.6277 & 0.266038 \tabularnewline
48 & 0.285157 & 2.4859 & 0.007559 \tabularnewline
\hline
\end{tabular}
%Source: https://freestatistics.org/blog/index.php?pk=294079&T=1

[TABLE]
[ROW][C]Autocorrelation Function[/C][/ROW]
[ROW][C]Time lag k[/C][C]ACF(k)[/C][C]T-STAT[/C][C]P-value[/C][/ROW]
[ROW][C]1[/C][C]0.094788[/C][C]0.8263[/C][C]0.205598[/C][/ROW]
[ROW][C]2[/C][C]-0.610621[/C][C]-5.3233[/C][C]0[/C][/ROW]
[ROW][C]3[/C][C]0.072923[/C][C]0.6357[/C][C]0.263432[/C][/ROW]
[ROW][C]4[/C][C]0.735204[/C][C]6.4094[/C][C]0[/C][/ROW]
[ROW][C]5[/C][C]0.049315[/C][C]0.4299[/C][C]0.334235[/C][/ROW]
[ROW][C]6[/C][C]-0.557272[/C][C]-4.8582[/C][C]3e-06[/C][/ROW]
[ROW][C]7[/C][C]0.061121[/C][C]0.5328[/C][C]0.29785[/C][/ROW]
[ROW][C]8[/C][C]0.633691[/C][C]5.5244[/C][C]0[/C][/ROW]
[ROW][C]9[/C][C]-0.029552[/C][C]-0.2576[/C][C]0.398696[/C][/ROW]
[ROW][C]10[/C][C]-0.571324[/C][C]-4.9807[/C][C]2e-06[/C][/ROW]
[ROW][C]11[/C][C]0.049639[/C][C]0.4327[/C][C]0.333212[/C][/ROW]
[ROW][C]12[/C][C]0.646974[/C][C]5.6402[/C][C]0[/C][/ROW]
[ROW][C]13[/C][C]-0.052769[/C][C]-0.46[/C][C]0.323403[/C][/ROW]
[ROW][C]14[/C][C]-0.611165[/C][C]-5.328[/C][C]0[/C][/ROW]
[ROW][C]15[/C][C]0.005097[/C][C]0.0444[/C][C]0.482336[/C][/ROW]
[ROW][C]16[/C][C]0.585829[/C][C]5.1071[/C][C]1e-06[/C][/ROW]
[ROW][C]17[/C][C]-0.066353[/C][C]-0.5785[/C][C]0.282334[/C][/ROW]
[ROW][C]18[/C][C]-0.576526[/C][C]-5.026[/C][C]2e-06[/C][/ROW]
[ROW][C]19[/C][C]-0.033009[/C][C]-0.2878[/C][C]0.387154[/C][/ROW]
[ROW][C]20[/C][C]0.484053[/C][C]4.2199[/C][C]3.3e-05[/C][/ROW]
[ROW][C]21[/C][C]-0.104401[/C][C]-0.9101[/C][C]0.182811[/C][/ROW]
[ROW][C]22[/C][C]-0.577146[/C][C]-5.0314[/C][C]2e-06[/C][/ROW]
[ROW][C]23[/C][C]-0.032012[/C][C]-0.2791[/C][C]0.390474[/C][/ROW]
[ROW][C]24[/C][C]0.413132[/C][C]3.6016[/C][C]0.000281[/C][/ROW]
[ROW][C]25[/C][C]-0.117332[/C][C]-1.0229[/C][C]0.154805[/C][/ROW]
[ROW][C]26[/C][C]-0.506956[/C][C]-4.4195[/C][C]1.6e-05[/C][/ROW]
[ROW][C]27[/C][C]0.001823[/C][C]0.0159[/C][C]0.493679[/C][/ROW]
[ROW][C]28[/C][C]0.408643[/C][C]3.5625[/C][C]0.000319[/C][/ROW]
[ROW][C]29[/C][C]-0.139034[/C][C]-1.2121[/C][C]0.11462[/C][/ROW]
[ROW][C]30[/C][C]-0.470189[/C][C]-4.099[/C][C]5.1e-05[/C][/ROW]
[ROW][C]31[/C][C]0.003951[/C][C]0.0344[/C][C]0.486307[/C][/ROW]
[ROW][C]32[/C][C]0.396582[/C][C]3.4573[/C][C]0.000448[/C][/ROW]
[ROW][C]33[/C][C]-0.062742[/C][C]-0.547[/C][C]0.293001[/C][/ROW]
[ROW][C]34[/C][C]-0.433986[/C][C]-3.7834[/C][C]0.000153[/C][/ROW]
[ROW][C]35[/C][C]0.003955[/C][C]0.0345[/C][C]0.486292[/C][/ROW]
[ROW][C]36[/C][C]0.398992[/C][C]3.4783[/C][C]0.000419[/C][/ROW]
[ROW][C]37[/C][C]-0.038689[/C][C]-0.3373[/C][C]0.368417[/C][/ROW]
[ROW][C]38[/C][C]-0.319272[/C][C]-2.7833[/C][C]0.003392[/C][/ROW]
[ROW][C]39[/C][C]0.032163[/C][C]0.2804[/C][C]0.389969[/C][/ROW]
[ROW][C]40[/C][C]0.336957[/C][C]2.9375[/C][C]0.002189[/C][/ROW]
[ROW][C]41[/C][C]-0.02954[/C][C]-0.2575[/C][C]0.398735[/C][/ROW]
[ROW][C]42[/C][C]-0.295939[/C][C]-2.5799[/C][C]0.005905[/C][/ROW]
[ROW][C]43[/C][C]0.048861[/C][C]0.426[/C][C]0.335669[/C][/ROW]
[ROW][C]44[/C][C]0.304157[/C][C]2.6516[/C][C]0.004873[/C][/ROW]
[ROW][C]45[/C][C]-0.046323[/C][C]-0.4038[/C][C]0.343734[/C][/ROW]
[ROW][C]46[/C][C]-0.274768[/C][C]-2.3954[/C][C]0.009533[/C][/ROW]
[ROW][C]47[/C][C]0.072003[/C][C]0.6277[/C][C]0.266038[/C][/ROW]
[ROW][C]48[/C][C]0.285157[/C][C]2.4859[/C][C]0.007559[/C][/ROW]
[/TABLE]
Source: https://freestatistics.org/blog/index.php?pk=294079&T=1

Globally Unique Identifier (entire table): ba.freestatistics.org/blog/index.php?pk=294079&T=1

As an alternative you can also use a QR Code:  

The GUIDs for individual cells are displayed in the table below:

Autocorrelation Function
Time lag kACF(k)T-STATP-value
10.0947880.82630.205598
2-0.610621-5.32330
30.0729230.63570.263432
40.7352046.40940
50.0493150.42990.334235
6-0.557272-4.85823e-06
70.0611210.53280.29785
80.6336915.52440
9-0.029552-0.25760.398696
10-0.571324-4.98072e-06
110.0496390.43270.333212
120.6469745.64020
13-0.052769-0.460.323403
14-0.611165-5.3280
150.0050970.04440.482336
160.5858295.10711e-06
17-0.066353-0.57850.282334
18-0.576526-5.0262e-06
19-0.033009-0.28780.387154
200.4840534.21993.3e-05
21-0.104401-0.91010.182811
22-0.577146-5.03142e-06
23-0.032012-0.27910.390474
240.4131323.60160.000281
25-0.117332-1.02290.154805
26-0.506956-4.41951.6e-05
270.0018230.01590.493679
280.4086433.56250.000319
29-0.139034-1.21210.11462
30-0.470189-4.0995.1e-05
310.0039510.03440.486307
320.3965823.45730.000448
33-0.062742-0.5470.293001
34-0.433986-3.78340.000153
350.0039550.03450.486292
360.3989923.47830.000419
37-0.038689-0.33730.368417
38-0.319272-2.78330.003392
390.0321630.28040.389969
400.3369572.93750.002189
41-0.02954-0.25750.398735
42-0.295939-2.57990.005905
430.0488610.4260.335669
440.3041572.65160.004873
45-0.046323-0.40380.343734
46-0.274768-2.39540.009533
470.0720030.62770.266038
480.2851572.48590.007559


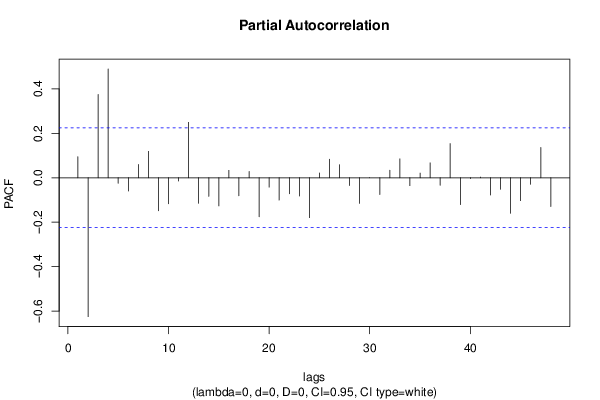
Partial Autocorrelation Function
Time lag kPACF(k)T-STATP-value
10.0947880.82630.205598
2-0.625223-5.45060
30.3748263.26770.000815
40.4901894.27342.8e-05
5-0.024379-0.21250.41613
6-0.059474-0.51850.302814
70.0597960.52130.301841
80.1191221.03850.151169
9-0.14841-1.29380.099824
10-0.117165-1.02140.155148
11-0.01407-0.12270.45135
120.2495182.17530.016361
13-0.114638-0.99940.160388
14-0.083502-0.7280.234438
15-0.126506-1.10290.136785
160.0334880.29190.385565
17-0.081002-0.70620.241124
180.028680.250.40162
19-0.175202-1.52740.065409
20-0.042175-0.36770.35707
21-0.100392-0.87520.192112
22-0.071975-0.62750.266118
23-0.081813-0.71320.238945
24-0.179297-1.56310.061095
250.0218620.19060.424677
260.0833010.72620.234972
270.0589870.51420.30429
28-0.034522-0.3010.382134
29-0.115068-1.00310.159489
30-0.000424-0.00370.498529
31-0.075244-0.6560.256914
320.0341870.2980.383244
330.0854480.74490.22931
34-0.035302-0.30780.379556
350.0212970.18570.426602
360.0671940.58580.279877
37-0.033397-0.29110.385867
380.1539221.34190.091818
39-0.120664-1.05190.148083
40-0.003554-0.0310.487681
410.0030340.02640.489485
42-0.077096-0.67210.251777
43-0.051324-0.44740.327919
44-0.15961-1.39140.084075
45-0.10272-0.89550.186675
46-0.029026-0.2530.400461
470.1364291.18940.119
48-0.128963-1.12430.132219

\begin{tabular}{lllllllll}
\hline
Partial Autocorrelation Function \tabularnewline
Time lag k & PACF(k) & T-STAT & P-value \tabularnewline
1 & 0.094788 & 0.8263 & 0.205598 \tabularnewline
2 & -0.625223 & -5.4506 & 0 \tabularnewline
3 & 0.374826 & 3.2677 & 0.000815 \tabularnewline
4 & 0.490189 & 4.2734 & 2.8e-05 \tabularnewline
5 & -0.024379 & -0.2125 & 0.41613 \tabularnewline
6 & -0.059474 & -0.5185 & 0.302814 \tabularnewline
7 & 0.059796 & 0.5213 & 0.301841 \tabularnewline
8 & 0.119122 & 1.0385 & 0.151169 \tabularnewline
9 & -0.14841 & -1.2938 & 0.099824 \tabularnewline
10 & -0.117165 & -1.0214 & 0.155148 \tabularnewline
11 & -0.01407 & -0.1227 & 0.45135 \tabularnewline
12 & 0.249518 & 2.1753 & 0.016361 \tabularnewline
13 & -0.114638 & -0.9994 & 0.160388 \tabularnewline
14 & -0.083502 & -0.728 & 0.234438 \tabularnewline
15 & -0.126506 & -1.1029 & 0.136785 \tabularnewline
16 & 0.033488 & 0.2919 & 0.385565 \tabularnewline
17 & -0.081002 & -0.7062 & 0.241124 \tabularnewline
18 & 0.02868 & 0.25 & 0.40162 \tabularnewline
19 & -0.175202 & -1.5274 & 0.065409 \tabularnewline
20 & -0.042175 & -0.3677 & 0.35707 \tabularnewline
21 & -0.100392 & -0.8752 & 0.192112 \tabularnewline
22 & -0.071975 & -0.6275 & 0.266118 \tabularnewline
23 & -0.081813 & -0.7132 & 0.238945 \tabularnewline
24 & -0.179297 & -1.5631 & 0.061095 \tabularnewline
25 & 0.021862 & 0.1906 & 0.424677 \tabularnewline
26 & 0.083301 & 0.7262 & 0.234972 \tabularnewline
27 & 0.058987 & 0.5142 & 0.30429 \tabularnewline
28 & -0.034522 & -0.301 & 0.382134 \tabularnewline
29 & -0.115068 & -1.0031 & 0.159489 \tabularnewline
30 & -0.000424 & -0.0037 & 0.498529 \tabularnewline
31 & -0.075244 & -0.656 & 0.256914 \tabularnewline
32 & 0.034187 & 0.298 & 0.383244 \tabularnewline
33 & 0.085448 & 0.7449 & 0.22931 \tabularnewline
34 & -0.035302 & -0.3078 & 0.379556 \tabularnewline
35 & 0.021297 & 0.1857 & 0.426602 \tabularnewline
36 & 0.067194 & 0.5858 & 0.279877 \tabularnewline
37 & -0.033397 & -0.2911 & 0.385867 \tabularnewline
38 & 0.153922 & 1.3419 & 0.091818 \tabularnewline
39 & -0.120664 & -1.0519 & 0.148083 \tabularnewline
40 & -0.003554 & -0.031 & 0.487681 \tabularnewline
41 & 0.003034 & 0.0264 & 0.489485 \tabularnewline
42 & -0.077096 & -0.6721 & 0.251777 \tabularnewline
43 & -0.051324 & -0.4474 & 0.327919 \tabularnewline
44 & -0.15961 & -1.3914 & 0.084075 \tabularnewline
45 & -0.10272 & -0.8955 & 0.186675 \tabularnewline
46 & -0.029026 & -0.253 & 0.400461 \tabularnewline
47 & 0.136429 & 1.1894 & 0.119 \tabularnewline
48 & -0.128963 & -1.1243 & 0.132219 \tabularnewline
\hline
\end{tabular}
%Source: https://freestatistics.org/blog/index.php?pk=294079&T=2

[TABLE]
[ROW][C]Partial Autocorrelation Function[/C][/ROW]
[ROW][C]Time lag k[/C][C]PACF(k)[/C][C]T-STAT[/C][C]P-value[/C][/ROW]
[ROW][C]1[/C][C]0.094788[/C][C]0.8263[/C][C]0.205598[/C][/ROW]
[ROW][C]2[/C][C]-0.625223[/C][C]-5.4506[/C][C]0[/C][/ROW]
[ROW][C]3[/C][C]0.374826[/C][C]3.2677[/C][C]0.000815[/C][/ROW]
[ROW][C]4[/C][C]0.490189[/C][C]4.2734[/C][C]2.8e-05[/C][/ROW]
[ROW][C]5[/C][C]-0.024379[/C][C]-0.2125[/C][C]0.41613[/C][/ROW]
[ROW][C]6[/C][C]-0.059474[/C][C]-0.5185[/C][C]0.302814[/C][/ROW]
[ROW][C]7[/C][C]0.059796[/C][C]0.5213[/C][C]0.301841[/C][/ROW]
[ROW][C]8[/C][C]0.119122[/C][C]1.0385[/C][C]0.151169[/C][/ROW]
[ROW][C]9[/C][C]-0.14841[/C][C]-1.2938[/C][C]0.099824[/C][/ROW]
[ROW][C]10[/C][C]-0.117165[/C][C]-1.0214[/C][C]0.155148[/C][/ROW]
[ROW][C]11[/C][C]-0.01407[/C][C]-0.1227[/C][C]0.45135[/C][/ROW]
[ROW][C]12[/C][C]0.249518[/C][C]2.1753[/C][C]0.016361[/C][/ROW]
[ROW][C]13[/C][C]-0.114638[/C][C]-0.9994[/C][C]0.160388[/C][/ROW]
[ROW][C]14[/C][C]-0.083502[/C][C]-0.728[/C][C]0.234438[/C][/ROW]
[ROW][C]15[/C][C]-0.126506[/C][C]-1.1029[/C][C]0.136785[/C][/ROW]
[ROW][C]16[/C][C]0.033488[/C][C]0.2919[/C][C]0.385565[/C][/ROW]
[ROW][C]17[/C][C]-0.081002[/C][C]-0.7062[/C][C]0.241124[/C][/ROW]
[ROW][C]18[/C][C]0.02868[/C][C]0.25[/C][C]0.40162[/C][/ROW]
[ROW][C]19[/C][C]-0.175202[/C][C]-1.5274[/C][C]0.065409[/C][/ROW]
[ROW][C]20[/C][C]-0.042175[/C][C]-0.3677[/C][C]0.35707[/C][/ROW]
[ROW][C]21[/C][C]-0.100392[/C][C]-0.8752[/C][C]0.192112[/C][/ROW]
[ROW][C]22[/C][C]-0.071975[/C][C]-0.6275[/C][C]0.266118[/C][/ROW]
[ROW][C]23[/C][C]-0.081813[/C][C]-0.7132[/C][C]0.238945[/C][/ROW]
[ROW][C]24[/C][C]-0.179297[/C][C]-1.5631[/C][C]0.061095[/C][/ROW]
[ROW][C]25[/C][C]0.021862[/C][C]0.1906[/C][C]0.424677[/C][/ROW]
[ROW][C]26[/C][C]0.083301[/C][C]0.7262[/C][C]0.234972[/C][/ROW]
[ROW][C]27[/C][C]0.058987[/C][C]0.5142[/C][C]0.30429[/C][/ROW]
[ROW][C]28[/C][C]-0.034522[/C][C]-0.301[/C][C]0.382134[/C][/ROW]
[ROW][C]29[/C][C]-0.115068[/C][C]-1.0031[/C][C]0.159489[/C][/ROW]
[ROW][C]30[/C][C]-0.000424[/C][C]-0.0037[/C][C]0.498529[/C][/ROW]
[ROW][C]31[/C][C]-0.075244[/C][C]-0.656[/C][C]0.256914[/C][/ROW]
[ROW][C]32[/C][C]0.034187[/C][C]0.298[/C][C]0.383244[/C][/ROW]
[ROW][C]33[/C][C]0.085448[/C][C]0.7449[/C][C]0.22931[/C][/ROW]
[ROW][C]34[/C][C]-0.035302[/C][C]-0.3078[/C][C]0.379556[/C][/ROW]
[ROW][C]35[/C][C]0.021297[/C][C]0.1857[/C][C]0.426602[/C][/ROW]
[ROW][C]36[/C][C]0.067194[/C][C]0.5858[/C][C]0.279877[/C][/ROW]
[ROW][C]37[/C][C]-0.033397[/C][C]-0.2911[/C][C]0.385867[/C][/ROW]
[ROW][C]38[/C][C]0.153922[/C][C]1.3419[/C][C]0.091818[/C][/ROW]
[ROW][C]39[/C][C]-0.120664[/C][C]-1.0519[/C][C]0.148083[/C][/ROW]
[ROW][C]40[/C][C]-0.003554[/C][C]-0.031[/C][C]0.487681[/C][/ROW]
[ROW][C]41[/C][C]0.003034[/C][C]0.0264[/C][C]0.489485[/C][/ROW]
[ROW][C]42[/C][C]-0.077096[/C][C]-0.6721[/C][C]0.251777[/C][/ROW]
[ROW][C]43[/C][C]-0.051324[/C][C]-0.4474[/C][C]0.327919[/C][/ROW]
[ROW][C]44[/C][C]-0.15961[/C][C]-1.3914[/C][C]0.084075[/C][/ROW]
[ROW][C]45[/C][C]-0.10272[/C][C]-0.8955[/C][C]0.186675[/C][/ROW]
[ROW][C]46[/C][C]-0.029026[/C][C]-0.253[/C][C]0.400461[/C][/ROW]
[ROW][C]47[/C][C]0.136429[/C][C]1.1894[/C][C]0.119[/C][/ROW]
[ROW][C]48[/C][C]-0.128963[/C][C]-1.1243[/C][C]0.132219[/C][/ROW]
[/TABLE]
Source: https://freestatistics.org/blog/index.php?pk=294079&T=2

Globally Unique Identifier (entire table): ba.freestatistics.org/blog/index.php?pk=294079&T=2

As an alternative you can also use a QR Code:  

The GUIDs for individual cells are displayed in the table below:

Partial Autocorrelation Function
Time lag kPACF(k)T-STATP-value
10.0947880.82630.205598
2-0.625223-5.45060
30.3748263.26770.000815
40.4901894.27342.8e-05
5-0.024379-0.21250.41613
6-0.059474-0.51850.302814
70.0597960.52130.301841
80.1191221.03850.151169
9-0.14841-1.29380.099824
10-0.117165-1.02140.155148
11-0.01407-0.12270.45135
120.2495182.17530.016361
13-0.114638-0.99940.160388
14-0.083502-0.7280.234438
15-0.126506-1.10290.136785
160.0334880.29190.385565
17-0.081002-0.70620.241124
180.028680.250.40162
19-0.175202-1.52740.065409
20-0.042175-0.36770.35707
21-0.100392-0.87520.192112
22-0.071975-0.62750.266118
23-0.081813-0.71320.238945
24-0.179297-1.56310.061095
250.0218620.19060.424677
260.0833010.72620.234972
270.0589870.51420.30429
28-0.034522-0.3010.382134
29-0.115068-1.00310.159489
30-0.000424-0.00370.498529
31-0.075244-0.6560.256914
320.0341870.2980.383244
330.0854480.74490.22931
34-0.035302-0.30780.379556
350.0212970.18570.426602
360.0671940.58580.279877
37-0.033397-0.29110.385867
380.1539221.34190.091818
39-0.120664-1.05190.148083
40-0.003554-0.0310.487681
410.0030340.02640.489485
42-0.077096-0.67210.251777
43-0.051324-0.44740.327919
44-0.15961-1.39140.084075
45-0.10272-0.89550.186675
46-0.029026-0.2530.400461
470.1364291.18940.119
48-0.128963-1.12430.132219


Parameters (Session):
par1 = 48 ; par2 = 0.0 ; par3 = 0 ; par4 = 0 ; par5 = 12 ; par6 = White Noise ; par7 = 0.95 ;
Parameters (R input):
par1 = 48 ; par2 = 0.0 ; par3 = 0 ; par4 = 0 ; par5 = 12 ; par6 = White Noise ; par7 = 0.95 ; par8 = ;
R code (references can be found in the software module):
par8 <- ''
par7 <- '0.95'
par6 <- 'White Noise'
par5 <- '12'
par4 <- '0'
par3 <- '1'
par2 <- '1'
par1 <- '48'
if (par1 == 'Default') {
par1 = 10*log10(length(x))
} else {
par1 <- as.numeric(par1)
}
par2 <- as.numeric(par2)
par3 <- as.numeric(par3)
par4 <- as.numeric(par4)
par5 <- as.numeric(par5)
if (par6 == 'White Noise') par6 <- 'white' else par6 <- 'ma'
par7 <- as.numeric(par7)
if (par8 != '') par8 <- as.numeric(par8)
x <- na.omit(x)
ox <- x
if (par8 == '') {
if (par2 == 0) {
x <- log(x)
} else {
x <- (x ^ par2 - 1) / par2
}
} else {
x <- log(x,base=par8)
}
if (par3 > 0) x <- diff(x,lag=1,difference=par3)
if (par4 > 0) x <- diff(x,lag=par5,difference=par4)
bitmap(file='picts.png')
op <- par(mfrow=c(2,1))
plot(ox,type='l',main='Original Time Series',xlab='time',ylab='value')
if (par8=='') {
mytitle <- paste('Working Time Series (lambda=',par2,', d=',par3,', D=',par4,')',sep='')
mysub <- paste('(lambda=',par2,', d=',par3,', D=',par4,', CI=', par7, ', CI type=',par6,')',sep='')
} else {
mytitle <- paste('Working Time Series (base=',par8,', d=',par3,', D=',par4,')',sep='')
mysub <- paste('(base=',par8,', d=',par3,', D=',par4,', CI=', par7, ', CI type=',par6,')',sep='')
}
plot(x,type='l', main=mytitle,xlab='time',ylab='value')
par(op)
dev.off()
bitmap(file='pic1.png')
racf <- acf(x, par1, main='Autocorrelation', xlab='time lag', ylab='ACF', ci.type=par6, ci=par7, sub=mysub)
dev.off()
bitmap(file='pic2.png')
rpacf <- pacf(x,par1,main='Partial Autocorrelation',xlab='lags',ylab='PACF',sub=mysub)
dev.off()
(myacf <- c(racf$acf))
(mypacf <- c(rpacf$acf))
lengthx <- length(x)
sqrtn <- sqrt(lengthx)
load(file='createtable')
a<-table.start()
a<-table.row.start(a)
a<-table.element(a,'Autocorrelation Function',4,TRUE)
a<-table.row.end(a)
a<-table.row.start(a)
a<-table.element(a,'Time lag k',header=TRUE)
a<-table.element(a,hyperlink('basics.htm','ACF(k)','click here for more information about the Autocorrelation Function'),header=TRUE)
a<-table.element(a,'T-STAT',header=TRUE)
a<-table.element(a,'P-value',header=TRUE)
a<-table.row.end(a)
for (i in 2:(par1+1)) {
a<-table.row.start(a)
a<-table.element(a,i-1,header=TRUE)
a<-table.element(a,round(myacf[i],6))
mytstat <- myacf[i]*sqrtn
a<-table.element(a,round(mytstat,4))
a<-table.element(a,round(1-pt(abs(mytstat),lengthx),6))
a<-table.row.end(a)
}
a<-table.end(a)
table.save(a,file='mytable.tab')
a<-table.start()
a<-table.row.start(a)
a<-table.element(a,'Partial Autocorrelation Function',4,TRUE)
a<-table.row.end(a)
a<-table.row.start(a)
a<-table.element(a,'Time lag k',header=TRUE)
a<-table.element(a,hyperlink('basics.htm','PACF(k)','click here for more information about the Partial Autocorrelation Function'),header=TRUE)
a<-table.element(a,'T-STAT',header=TRUE)
a<-table.element(a,'P-value',header=TRUE)
a<-table.row.end(a)
for (i in 1:par1) {
a<-table.row.start(a)
a<-table.element(a,i,header=TRUE)
a<-table.element(a,round(mypacf[i],6))
mytstat <- mypacf[i]*sqrtn
a<-table.element(a,round(mytstat,4))
a<-table.element(a,round(1-pt(abs(mytstat),lengthx),6))
a<-table.row.end(a)
}
a<-table.end(a)
table.save(a,file='mytable1.tab')