Free Statistics

of Irreproducible Research!

Author's title

Author*Unverified author*
R Software Modulerwasp_autocorrelation.wasp
Title produced by software(Partial) Autocorrelation Function
Date of computationTue, 15 Mar 2016 21:22:50 +0000
Cite this page as followsStatistical Computations at FreeStatistics.org, Office for Research Development and Education, URL https://freestatistics.org/blog/index.php?v=date/2016/Mar/15/t1458077130q6z00gerrc1oxa7.htm/, Retrieved Tue, 30 Apr 2024 20:41:59 +0000
Statistical Computations at FreeStatistics.org, Office for Research Development and Education, URL https://freestatistics.org/blog/index.php?pk=294105, Retrieved Tue, 30 Apr 2024 20:41:59 +0000
QR Codes:

Original text written by user:
IsPrivate?No (this computation is public)
User-defined keywords
Estimated Impact133
Family? (F = Feedback message, R = changed R code, M = changed R Module, P = changed Parameters, D = changed Data)
-       [(Partial) Autocorrelation Function] [Non-seasonal diff...] [2016-03-15 21:22:50] [45930f35caeb32be6f319da4f3b0c690] [Current]
Feedback Forum

Post a new message
Dataseries X:
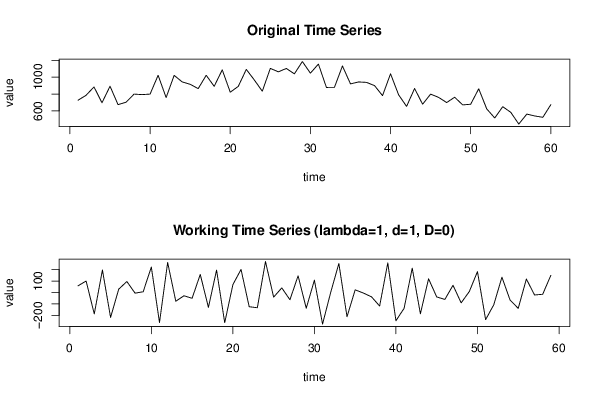
726
784
884
696
893
674
703
799
793
799
1022
758
1021
944
915
864
1022
891
1087
822
890
1092
967
833
1104
1063
1103
1039
1185
1047
1155
878
879
1133
920
943
938
900
781
1040
792
653
866
679
799
760
699
762
671
679
862
624
516
650
583
444
562
540
524
674


Summary of computational transaction
Raw Inputview raw input (R code)
Raw Outputview raw output of R engine
Computing time1 seconds
R Server'George Udny Yule' @ yule.wessa.net

\begin{tabular}{lllllllll}
\hline
Summary of computational transaction \tabularnewline
Raw Input & view raw input (R code)  \tabularnewline
Raw Output & view raw output of R engine  \tabularnewline
Computing time & 1 seconds \tabularnewline
R Server & 'George Udny Yule' @ yule.wessa.net \tabularnewline
\hline
\end{tabular}
%Source: https://freestatistics.org/blog/index.php?pk=294105&T=0

[TABLE]
[ROW][C]Summary of computational transaction[/C][/ROW]
[ROW][C]Raw Input[/C][C]view raw input (R code) [/C][/ROW]
[ROW][C]Raw Output[/C][C]view raw output of R engine [/C][/ROW]
[ROW][C]Computing time[/C][C]1 seconds[/C][/ROW]
[ROW][C]R Server[/C][C]'George Udny Yule' @ yule.wessa.net[/C][/ROW]
[/TABLE]
Source: https://freestatistics.org/blog/index.php?pk=294105&T=0

Globally Unique Identifier (entire table): ba.freestatistics.org/blog/index.php?pk=294105&T=0

As an alternative you can also use a QR Code:  

The GUIDs for individual cells are displayed in the table below:

Summary of computational transaction
Raw Inputview raw input (R code)
Raw Outputview raw output of R engine
Computing time1 seconds
R Server'George Udny Yule' @ yule.wessa.net


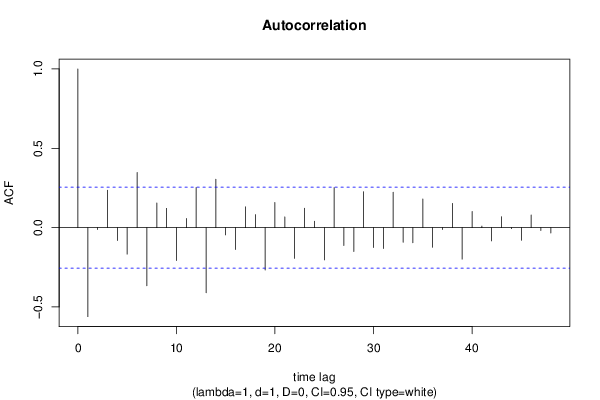
Autocorrelation Function
Time lag kACF(k)T-STATP-value
1-0.560988-4.3093.2e-05
2-0.012323-0.09470.462454
30.2351641.80630.037984
4-0.080787-0.62050.268647
5-0.167198-1.28430.102034
60.3477722.67130.004875
7-0.366365-2.81410.003318
80.1555771.1950.118432
90.1215490.93360.177148
10-0.206833-1.58870.058735
110.0573980.44090.330456
120.252531.93970.028599
13-0.410912-3.15630.001258
140.3054352.34610.011176
15-0.045598-0.35020.363702
16-0.137483-1.0560.14763
170.1311081.00710.15901
180.0821920.63130.265132
19-0.266562-2.04750.022535
200.1583831.21660.114307
210.0676460.51960.302644
22-0.193871-1.48910.070887
230.121790.93550.176675
240.0404260.31050.378631
25-0.203234-1.56110.061928
260.252051.9360.02883
27-0.112363-0.86310.195796
28-0.15023-1.15390.126589
290.226381.73890.043638
30-0.125453-0.96360.169585
31-0.131044-1.00660.159127
320.2233531.71560.045741
33-0.091718-0.70450.241947
34-0.094928-0.72920.234397
350.1806871.38790.085196
36-0.12405-0.95280.172277
37-0.011823-0.09080.463973
380.1527091.1730.122759
39-0.198606-1.52550.066236
400.1022590.78550.217661
410.009730.07470.470339
42-0.083411-0.64070.262102
430.0687470.52810.29972
44-0.006411-0.04920.480446
45-0.080052-0.61490.270494
460.0793180.60930.272347
47-0.017899-0.13750.445559
48-0.034352-0.26390.396403

\begin{tabular}{lllllllll}
\hline
Autocorrelation Function \tabularnewline
Time lag k & ACF(k) & T-STAT & P-value \tabularnewline
1 & -0.560988 & -4.309 & 3.2e-05 \tabularnewline
2 & -0.012323 & -0.0947 & 0.462454 \tabularnewline
3 & 0.235164 & 1.8063 & 0.037984 \tabularnewline
4 & -0.080787 & -0.6205 & 0.268647 \tabularnewline
5 & -0.167198 & -1.2843 & 0.102034 \tabularnewline
6 & 0.347772 & 2.6713 & 0.004875 \tabularnewline
7 & -0.366365 & -2.8141 & 0.003318 \tabularnewline
8 & 0.155577 & 1.195 & 0.118432 \tabularnewline
9 & 0.121549 & 0.9336 & 0.177148 \tabularnewline
10 & -0.206833 & -1.5887 & 0.058735 \tabularnewline
11 & 0.057398 & 0.4409 & 0.330456 \tabularnewline
12 & 0.25253 & 1.9397 & 0.028599 \tabularnewline
13 & -0.410912 & -3.1563 & 0.001258 \tabularnewline
14 & 0.305435 & 2.3461 & 0.011176 \tabularnewline
15 & -0.045598 & -0.3502 & 0.363702 \tabularnewline
16 & -0.137483 & -1.056 & 0.14763 \tabularnewline
17 & 0.131108 & 1.0071 & 0.15901 \tabularnewline
18 & 0.082192 & 0.6313 & 0.265132 \tabularnewline
19 & -0.266562 & -2.0475 & 0.022535 \tabularnewline
20 & 0.158383 & 1.2166 & 0.114307 \tabularnewline
21 & 0.067646 & 0.5196 & 0.302644 \tabularnewline
22 & -0.193871 & -1.4891 & 0.070887 \tabularnewline
23 & 0.12179 & 0.9355 & 0.176675 \tabularnewline
24 & 0.040426 & 0.3105 & 0.378631 \tabularnewline
25 & -0.203234 & -1.5611 & 0.061928 \tabularnewline
26 & 0.25205 & 1.936 & 0.02883 \tabularnewline
27 & -0.112363 & -0.8631 & 0.195796 \tabularnewline
28 & -0.15023 & -1.1539 & 0.126589 \tabularnewline
29 & 0.22638 & 1.7389 & 0.043638 \tabularnewline
30 & -0.125453 & -0.9636 & 0.169585 \tabularnewline
31 & -0.131044 & -1.0066 & 0.159127 \tabularnewline
32 & 0.223353 & 1.7156 & 0.045741 \tabularnewline
33 & -0.091718 & -0.7045 & 0.241947 \tabularnewline
34 & -0.094928 & -0.7292 & 0.234397 \tabularnewline
35 & 0.180687 & 1.3879 & 0.085196 \tabularnewline
36 & -0.12405 & -0.9528 & 0.172277 \tabularnewline
37 & -0.011823 & -0.0908 & 0.463973 \tabularnewline
38 & 0.152709 & 1.173 & 0.122759 \tabularnewline
39 & -0.198606 & -1.5255 & 0.066236 \tabularnewline
40 & 0.102259 & 0.7855 & 0.217661 \tabularnewline
41 & 0.00973 & 0.0747 & 0.470339 \tabularnewline
42 & -0.083411 & -0.6407 & 0.262102 \tabularnewline
43 & 0.068747 & 0.5281 & 0.29972 \tabularnewline
44 & -0.006411 & -0.0492 & 0.480446 \tabularnewline
45 & -0.080052 & -0.6149 & 0.270494 \tabularnewline
46 & 0.079318 & 0.6093 & 0.272347 \tabularnewline
47 & -0.017899 & -0.1375 & 0.445559 \tabularnewline
48 & -0.034352 & -0.2639 & 0.396403 \tabularnewline
\hline
\end{tabular}
%Source: https://freestatistics.org/blog/index.php?pk=294105&T=1

[TABLE]
[ROW][C]Autocorrelation Function[/C][/ROW]
[ROW][C]Time lag k[/C][C]ACF(k)[/C][C]T-STAT[/C][C]P-value[/C][/ROW]
[ROW][C]1[/C][C]-0.560988[/C][C]-4.309[/C][C]3.2e-05[/C][/ROW]
[ROW][C]2[/C][C]-0.012323[/C][C]-0.0947[/C][C]0.462454[/C][/ROW]
[ROW][C]3[/C][C]0.235164[/C][C]1.8063[/C][C]0.037984[/C][/ROW]
[ROW][C]4[/C][C]-0.080787[/C][C]-0.6205[/C][C]0.268647[/C][/ROW]
[ROW][C]5[/C][C]-0.167198[/C][C]-1.2843[/C][C]0.102034[/C][/ROW]
[ROW][C]6[/C][C]0.347772[/C][C]2.6713[/C][C]0.004875[/C][/ROW]
[ROW][C]7[/C][C]-0.366365[/C][C]-2.8141[/C][C]0.003318[/C][/ROW]
[ROW][C]8[/C][C]0.155577[/C][C]1.195[/C][C]0.118432[/C][/ROW]
[ROW][C]9[/C][C]0.121549[/C][C]0.9336[/C][C]0.177148[/C][/ROW]
[ROW][C]10[/C][C]-0.206833[/C][C]-1.5887[/C][C]0.058735[/C][/ROW]
[ROW][C]11[/C][C]0.057398[/C][C]0.4409[/C][C]0.330456[/C][/ROW]
[ROW][C]12[/C][C]0.25253[/C][C]1.9397[/C][C]0.028599[/C][/ROW]
[ROW][C]13[/C][C]-0.410912[/C][C]-3.1563[/C][C]0.001258[/C][/ROW]
[ROW][C]14[/C][C]0.305435[/C][C]2.3461[/C][C]0.011176[/C][/ROW]
[ROW][C]15[/C][C]-0.045598[/C][C]-0.3502[/C][C]0.363702[/C][/ROW]
[ROW][C]16[/C][C]-0.137483[/C][C]-1.056[/C][C]0.14763[/C][/ROW]
[ROW][C]17[/C][C]0.131108[/C][C]1.0071[/C][C]0.15901[/C][/ROW]
[ROW][C]18[/C][C]0.082192[/C][C]0.6313[/C][C]0.265132[/C][/ROW]
[ROW][C]19[/C][C]-0.266562[/C][C]-2.0475[/C][C]0.022535[/C][/ROW]
[ROW][C]20[/C][C]0.158383[/C][C]1.2166[/C][C]0.114307[/C][/ROW]
[ROW][C]21[/C][C]0.067646[/C][C]0.5196[/C][C]0.302644[/C][/ROW]
[ROW][C]22[/C][C]-0.193871[/C][C]-1.4891[/C][C]0.070887[/C][/ROW]
[ROW][C]23[/C][C]0.12179[/C][C]0.9355[/C][C]0.176675[/C][/ROW]
[ROW][C]24[/C][C]0.040426[/C][C]0.3105[/C][C]0.378631[/C][/ROW]
[ROW][C]25[/C][C]-0.203234[/C][C]-1.5611[/C][C]0.061928[/C][/ROW]
[ROW][C]26[/C][C]0.25205[/C][C]1.936[/C][C]0.02883[/C][/ROW]
[ROW][C]27[/C][C]-0.112363[/C][C]-0.8631[/C][C]0.195796[/C][/ROW]
[ROW][C]28[/C][C]-0.15023[/C][C]-1.1539[/C][C]0.126589[/C][/ROW]
[ROW][C]29[/C][C]0.22638[/C][C]1.7389[/C][C]0.043638[/C][/ROW]
[ROW][C]30[/C][C]-0.125453[/C][C]-0.9636[/C][C]0.169585[/C][/ROW]
[ROW][C]31[/C][C]-0.131044[/C][C]-1.0066[/C][C]0.159127[/C][/ROW]
[ROW][C]32[/C][C]0.223353[/C][C]1.7156[/C][C]0.045741[/C][/ROW]
[ROW][C]33[/C][C]-0.091718[/C][C]-0.7045[/C][C]0.241947[/C][/ROW]
[ROW][C]34[/C][C]-0.094928[/C][C]-0.7292[/C][C]0.234397[/C][/ROW]
[ROW][C]35[/C][C]0.180687[/C][C]1.3879[/C][C]0.085196[/C][/ROW]
[ROW][C]36[/C][C]-0.12405[/C][C]-0.9528[/C][C]0.172277[/C][/ROW]
[ROW][C]37[/C][C]-0.011823[/C][C]-0.0908[/C][C]0.463973[/C][/ROW]
[ROW][C]38[/C][C]0.152709[/C][C]1.173[/C][C]0.122759[/C][/ROW]
[ROW][C]39[/C][C]-0.198606[/C][C]-1.5255[/C][C]0.066236[/C][/ROW]
[ROW][C]40[/C][C]0.102259[/C][C]0.7855[/C][C]0.217661[/C][/ROW]
[ROW][C]41[/C][C]0.00973[/C][C]0.0747[/C][C]0.470339[/C][/ROW]
[ROW][C]42[/C][C]-0.083411[/C][C]-0.6407[/C][C]0.262102[/C][/ROW]
[ROW][C]43[/C][C]0.068747[/C][C]0.5281[/C][C]0.29972[/C][/ROW]
[ROW][C]44[/C][C]-0.006411[/C][C]-0.0492[/C][C]0.480446[/C][/ROW]
[ROW][C]45[/C][C]-0.080052[/C][C]-0.6149[/C][C]0.270494[/C][/ROW]
[ROW][C]46[/C][C]0.079318[/C][C]0.6093[/C][C]0.272347[/C][/ROW]
[ROW][C]47[/C][C]-0.017899[/C][C]-0.1375[/C][C]0.445559[/C][/ROW]
[ROW][C]48[/C][C]-0.034352[/C][C]-0.2639[/C][C]0.396403[/C][/ROW]
[/TABLE]
Source: https://freestatistics.org/blog/index.php?pk=294105&T=1

Globally Unique Identifier (entire table): ba.freestatistics.org/blog/index.php?pk=294105&T=1

As an alternative you can also use a QR Code:  

The GUIDs for individual cells are displayed in the table below:

Autocorrelation Function
Time lag kACF(k)T-STATP-value
1-0.560988-4.3093.2e-05
2-0.012323-0.09470.462454
30.2351641.80630.037984
4-0.080787-0.62050.268647
5-0.167198-1.28430.102034
60.3477722.67130.004875
7-0.366365-2.81410.003318
80.1555771.1950.118432
90.1215490.93360.177148
10-0.206833-1.58870.058735
110.0573980.44090.330456
120.252531.93970.028599
13-0.410912-3.15630.001258
140.3054352.34610.011176
15-0.045598-0.35020.363702
16-0.137483-1.0560.14763
170.1311081.00710.15901
180.0821920.63130.265132
19-0.266562-2.04750.022535
200.1583831.21660.114307
210.0676460.51960.302644
22-0.193871-1.48910.070887
230.121790.93550.176675
240.0404260.31050.378631
25-0.203234-1.56110.061928
260.252051.9360.02883
27-0.112363-0.86310.195796
28-0.15023-1.15390.126589
290.226381.73890.043638
30-0.125453-0.96360.169585
31-0.131044-1.00660.159127
320.2233531.71560.045741
33-0.091718-0.70450.241947
34-0.094928-0.72920.234397
350.1806871.38790.085196
36-0.12405-0.95280.172277
37-0.011823-0.09080.463973
380.1527091.1730.122759
39-0.198606-1.52550.066236
400.1022590.78550.217661
410.009730.07470.470339
42-0.083411-0.64070.262102
430.0687470.52810.29972
44-0.006411-0.04920.480446
45-0.080052-0.61490.270494
460.0793180.60930.272347
47-0.017899-0.13750.445559
48-0.034352-0.26390.396403


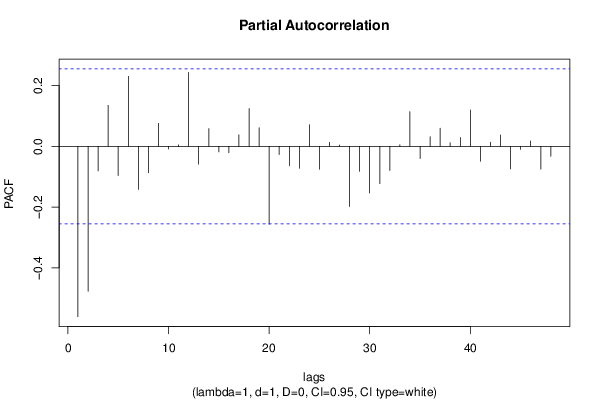
Partial Autocorrelation Function
Time lag kPACF(k)T-STATP-value
1-0.560988-4.3093.2e-05
2-0.477213-3.66550.000265
3-0.080795-0.62060.268627
40.1352841.03910.151491
5-0.095666-0.73480.232678
60.2307541.77250.040741
7-0.141757-1.08890.140322
8-0.086911-0.66760.253504
90.0758340.58250.281228
10-0.00874-0.06710.473352
110.0051450.03950.484305
120.2437071.87190.033087
13-0.058496-0.44930.327425
140.0586590.45060.326977
15-0.018221-0.140.444586
16-0.020721-0.15920.437044
170.0379010.29110.385989
180.1243720.95530.171656
190.0615060.47240.319178
20-0.256411-1.96950.026797
21-0.026905-0.20670.418493
22-0.063807-0.49010.312936
23-0.072202-0.55460.290633
240.0713770.54830.292793
25-0.075298-0.57840.282607
260.0133680.10270.459281
270.0043560.03350.486709
28-0.198292-1.52310.066537
29-0.081785-0.62820.266149
30-0.153713-1.18070.121231
31-0.122646-0.94210.175
32-0.079626-0.61160.27157
330.0056060.04310.482898
340.1144730.87930.191407
35-0.040126-0.30820.379502
360.0319930.24570.403368
370.0598850.460.323609
380.0122290.09390.462741
390.0293230.22520.411286
400.1201650.9230.179883
41-0.048964-0.37610.354097
420.0137820.10590.458027
430.03770.28960.386578
44-0.074074-0.5690.285767
45-0.0099-0.0760.469821
460.0176650.13570.446266
47-0.074974-0.57590.283441
48-0.032734-0.25140.401175

\begin{tabular}{lllllllll}
\hline
Partial Autocorrelation Function \tabularnewline
Time lag k & PACF(k) & T-STAT & P-value \tabularnewline
1 & -0.560988 & -4.309 & 3.2e-05 \tabularnewline
2 & -0.477213 & -3.6655 & 0.000265 \tabularnewline
3 & -0.080795 & -0.6206 & 0.268627 \tabularnewline
4 & 0.135284 & 1.0391 & 0.151491 \tabularnewline
5 & -0.095666 & -0.7348 & 0.232678 \tabularnewline
6 & 0.230754 & 1.7725 & 0.040741 \tabularnewline
7 & -0.141757 & -1.0889 & 0.140322 \tabularnewline
8 & -0.086911 & -0.6676 & 0.253504 \tabularnewline
9 & 0.075834 & 0.5825 & 0.281228 \tabularnewline
10 & -0.00874 & -0.0671 & 0.473352 \tabularnewline
11 & 0.005145 & 0.0395 & 0.484305 \tabularnewline
12 & 0.243707 & 1.8719 & 0.033087 \tabularnewline
13 & -0.058496 & -0.4493 & 0.327425 \tabularnewline
14 & 0.058659 & 0.4506 & 0.326977 \tabularnewline
15 & -0.018221 & -0.14 & 0.444586 \tabularnewline
16 & -0.020721 & -0.1592 & 0.437044 \tabularnewline
17 & 0.037901 & 0.2911 & 0.385989 \tabularnewline
18 & 0.124372 & 0.9553 & 0.171656 \tabularnewline
19 & 0.061506 & 0.4724 & 0.319178 \tabularnewline
20 & -0.256411 & -1.9695 & 0.026797 \tabularnewline
21 & -0.026905 & -0.2067 & 0.418493 \tabularnewline
22 & -0.063807 & -0.4901 & 0.312936 \tabularnewline
23 & -0.072202 & -0.5546 & 0.290633 \tabularnewline
24 & 0.071377 & 0.5483 & 0.292793 \tabularnewline
25 & -0.075298 & -0.5784 & 0.282607 \tabularnewline
26 & 0.013368 & 0.1027 & 0.459281 \tabularnewline
27 & 0.004356 & 0.0335 & 0.486709 \tabularnewline
28 & -0.198292 & -1.5231 & 0.066537 \tabularnewline
29 & -0.081785 & -0.6282 & 0.266149 \tabularnewline
30 & -0.153713 & -1.1807 & 0.121231 \tabularnewline
31 & -0.122646 & -0.9421 & 0.175 \tabularnewline
32 & -0.079626 & -0.6116 & 0.27157 \tabularnewline
33 & 0.005606 & 0.0431 & 0.482898 \tabularnewline
34 & 0.114473 & 0.8793 & 0.191407 \tabularnewline
35 & -0.040126 & -0.3082 & 0.379502 \tabularnewline
36 & 0.031993 & 0.2457 & 0.403368 \tabularnewline
37 & 0.059885 & 0.46 & 0.323609 \tabularnewline
38 & 0.012229 & 0.0939 & 0.462741 \tabularnewline
39 & 0.029323 & 0.2252 & 0.411286 \tabularnewline
40 & 0.120165 & 0.923 & 0.179883 \tabularnewline
41 & -0.048964 & -0.3761 & 0.354097 \tabularnewline
42 & 0.013782 & 0.1059 & 0.458027 \tabularnewline
43 & 0.0377 & 0.2896 & 0.386578 \tabularnewline
44 & -0.074074 & -0.569 & 0.285767 \tabularnewline
45 & -0.0099 & -0.076 & 0.469821 \tabularnewline
46 & 0.017665 & 0.1357 & 0.446266 \tabularnewline
47 & -0.074974 & -0.5759 & 0.283441 \tabularnewline
48 & -0.032734 & -0.2514 & 0.401175 \tabularnewline
\hline
\end{tabular}
%Source: https://freestatistics.org/blog/index.php?pk=294105&T=2

[TABLE]
[ROW][C]Partial Autocorrelation Function[/C][/ROW]
[ROW][C]Time lag k[/C][C]PACF(k)[/C][C]T-STAT[/C][C]P-value[/C][/ROW]
[ROW][C]1[/C][C]-0.560988[/C][C]-4.309[/C][C]3.2e-05[/C][/ROW]
[ROW][C]2[/C][C]-0.477213[/C][C]-3.6655[/C][C]0.000265[/C][/ROW]
[ROW][C]3[/C][C]-0.080795[/C][C]-0.6206[/C][C]0.268627[/C][/ROW]
[ROW][C]4[/C][C]0.135284[/C][C]1.0391[/C][C]0.151491[/C][/ROW]
[ROW][C]5[/C][C]-0.095666[/C][C]-0.7348[/C][C]0.232678[/C][/ROW]
[ROW][C]6[/C][C]0.230754[/C][C]1.7725[/C][C]0.040741[/C][/ROW]
[ROW][C]7[/C][C]-0.141757[/C][C]-1.0889[/C][C]0.140322[/C][/ROW]
[ROW][C]8[/C][C]-0.086911[/C][C]-0.6676[/C][C]0.253504[/C][/ROW]
[ROW][C]9[/C][C]0.075834[/C][C]0.5825[/C][C]0.281228[/C][/ROW]
[ROW][C]10[/C][C]-0.00874[/C][C]-0.0671[/C][C]0.473352[/C][/ROW]
[ROW][C]11[/C][C]0.005145[/C][C]0.0395[/C][C]0.484305[/C][/ROW]
[ROW][C]12[/C][C]0.243707[/C][C]1.8719[/C][C]0.033087[/C][/ROW]
[ROW][C]13[/C][C]-0.058496[/C][C]-0.4493[/C][C]0.327425[/C][/ROW]
[ROW][C]14[/C][C]0.058659[/C][C]0.4506[/C][C]0.326977[/C][/ROW]
[ROW][C]15[/C][C]-0.018221[/C][C]-0.14[/C][C]0.444586[/C][/ROW]
[ROW][C]16[/C][C]-0.020721[/C][C]-0.1592[/C][C]0.437044[/C][/ROW]
[ROW][C]17[/C][C]0.037901[/C][C]0.2911[/C][C]0.385989[/C][/ROW]
[ROW][C]18[/C][C]0.124372[/C][C]0.9553[/C][C]0.171656[/C][/ROW]
[ROW][C]19[/C][C]0.061506[/C][C]0.4724[/C][C]0.319178[/C][/ROW]
[ROW][C]20[/C][C]-0.256411[/C][C]-1.9695[/C][C]0.026797[/C][/ROW]
[ROW][C]21[/C][C]-0.026905[/C][C]-0.2067[/C][C]0.418493[/C][/ROW]
[ROW][C]22[/C][C]-0.063807[/C][C]-0.4901[/C][C]0.312936[/C][/ROW]
[ROW][C]23[/C][C]-0.072202[/C][C]-0.5546[/C][C]0.290633[/C][/ROW]
[ROW][C]24[/C][C]0.071377[/C][C]0.5483[/C][C]0.292793[/C][/ROW]
[ROW][C]25[/C][C]-0.075298[/C][C]-0.5784[/C][C]0.282607[/C][/ROW]
[ROW][C]26[/C][C]0.013368[/C][C]0.1027[/C][C]0.459281[/C][/ROW]
[ROW][C]27[/C][C]0.004356[/C][C]0.0335[/C][C]0.486709[/C][/ROW]
[ROW][C]28[/C][C]-0.198292[/C][C]-1.5231[/C][C]0.066537[/C][/ROW]
[ROW][C]29[/C][C]-0.081785[/C][C]-0.6282[/C][C]0.266149[/C][/ROW]
[ROW][C]30[/C][C]-0.153713[/C][C]-1.1807[/C][C]0.121231[/C][/ROW]
[ROW][C]31[/C][C]-0.122646[/C][C]-0.9421[/C][C]0.175[/C][/ROW]
[ROW][C]32[/C][C]-0.079626[/C][C]-0.6116[/C][C]0.27157[/C][/ROW]
[ROW][C]33[/C][C]0.005606[/C][C]0.0431[/C][C]0.482898[/C][/ROW]
[ROW][C]34[/C][C]0.114473[/C][C]0.8793[/C][C]0.191407[/C][/ROW]
[ROW][C]35[/C][C]-0.040126[/C][C]-0.3082[/C][C]0.379502[/C][/ROW]
[ROW][C]36[/C][C]0.031993[/C][C]0.2457[/C][C]0.403368[/C][/ROW]
[ROW][C]37[/C][C]0.059885[/C][C]0.46[/C][C]0.323609[/C][/ROW]
[ROW][C]38[/C][C]0.012229[/C][C]0.0939[/C][C]0.462741[/C][/ROW]
[ROW][C]39[/C][C]0.029323[/C][C]0.2252[/C][C]0.411286[/C][/ROW]
[ROW][C]40[/C][C]0.120165[/C][C]0.923[/C][C]0.179883[/C][/ROW]
[ROW][C]41[/C][C]-0.048964[/C][C]-0.3761[/C][C]0.354097[/C][/ROW]
[ROW][C]42[/C][C]0.013782[/C][C]0.1059[/C][C]0.458027[/C][/ROW]
[ROW][C]43[/C][C]0.0377[/C][C]0.2896[/C][C]0.386578[/C][/ROW]
[ROW][C]44[/C][C]-0.074074[/C][C]-0.569[/C][C]0.285767[/C][/ROW]
[ROW][C]45[/C][C]-0.0099[/C][C]-0.076[/C][C]0.469821[/C][/ROW]
[ROW][C]46[/C][C]0.017665[/C][C]0.1357[/C][C]0.446266[/C][/ROW]
[ROW][C]47[/C][C]-0.074974[/C][C]-0.5759[/C][C]0.283441[/C][/ROW]
[ROW][C]48[/C][C]-0.032734[/C][C]-0.2514[/C][C]0.401175[/C][/ROW]
[/TABLE]
Source: https://freestatistics.org/blog/index.php?pk=294105&T=2

Globally Unique Identifier (entire table): ba.freestatistics.org/blog/index.php?pk=294105&T=2

As an alternative you can also use a QR Code:  

The GUIDs for individual cells are displayed in the table below:

Partial Autocorrelation Function
Time lag kPACF(k)T-STATP-value
1-0.560988-4.3093.2e-05
2-0.477213-3.66550.000265
3-0.080795-0.62060.268627
40.1352841.03910.151491
5-0.095666-0.73480.232678
60.2307541.77250.040741
7-0.141757-1.08890.140322
8-0.086911-0.66760.253504
90.0758340.58250.281228
10-0.00874-0.06710.473352
110.0051450.03950.484305
120.2437071.87190.033087
13-0.058496-0.44930.327425
140.0586590.45060.326977
15-0.018221-0.140.444586
16-0.020721-0.15920.437044
170.0379010.29110.385989
180.1243720.95530.171656
190.0615060.47240.319178
20-0.256411-1.96950.026797
21-0.026905-0.20670.418493
22-0.063807-0.49010.312936
23-0.072202-0.55460.290633
240.0713770.54830.292793
25-0.075298-0.57840.282607
260.0133680.10270.459281
270.0043560.03350.486709
28-0.198292-1.52310.066537
29-0.081785-0.62820.266149
30-0.153713-1.18070.121231
31-0.122646-0.94210.175
32-0.079626-0.61160.27157
330.0056060.04310.482898
340.1144730.87930.191407
35-0.040126-0.30820.379502
360.0319930.24570.403368
370.0598850.460.323609
380.0122290.09390.462741
390.0293230.22520.411286
400.1201650.9230.179883
41-0.048964-0.37610.354097
420.0137820.10590.458027
430.03770.28960.386578
44-0.074074-0.5690.285767
45-0.0099-0.0760.469821
460.0176650.13570.446266
47-0.074974-0.57590.283441
48-0.032734-0.25140.401175


Parameters (Session):
par1 = 48 ; par2 = 1 ; par3 = 1 ; par4 = 0 ; par5 = 12 ; par6 = White Noise ; par7 = 0.95 ;
Parameters (R input):
par1 = 48 ; par2 = 1 ; par3 = 1 ; par4 = 0 ; par5 = 12 ; par6 = White Noise ; par7 = 0.95 ; par8 = ;
R code (references can be found in the software module):
if (par1 == 'Default') {
par1 = 10*log10(length(x))
} else {
par1 <- as.numeric(par1)
}
par2 <- as.numeric(par2)
par3 <- as.numeric(par3)
par4 <- as.numeric(par4)
par5 <- as.numeric(par5)
if (par6 == 'White Noise') par6 <- 'white' else par6 <- 'ma'
par7 <- as.numeric(par7)
if (par8 != '') par8 <- as.numeric(par8)
x <- na.omit(x)
ox <- x
if (par8 == '') {
if (par2 == 0) {
x <- log(x)
} else {
x <- (x ^ par2 - 1) / par2
}
} else {
x <- log(x,base=par8)
}
if (par3 > 0) x <- diff(x,lag=1,difference=par3)
if (par4 > 0) x <- diff(x,lag=par5,difference=par4)
bitmap(file='picts.png')
op <- par(mfrow=c(2,1))
plot(ox,type='l',main='Original Time Series',xlab='time',ylab='value')
if (par8=='') {
mytitle <- paste('Working Time Series (lambda=',par2,', d=',par3,', D=',par4,')',sep='')
mysub <- paste('(lambda=',par2,', d=',par3,', D=',par4,', CI=', par7, ', CI type=',par6,')',sep='')
} else {
mytitle <- paste('Working Time Series (base=',par8,', d=',par3,', D=',par4,')',sep='')
mysub <- paste('(base=',par8,', d=',par3,', D=',par4,', CI=', par7, ', CI type=',par6,')',sep='')
}
plot(x,type='l', main=mytitle,xlab='time',ylab='value')
par(op)
dev.off()
bitmap(file='pic1.png')
racf <- acf(x, par1, main='Autocorrelation', xlab='time lag', ylab='ACF', ci.type=par6, ci=par7, sub=mysub)
dev.off()
bitmap(file='pic2.png')
rpacf <- pacf(x,par1,main='Partial Autocorrelation',xlab='lags',ylab='PACF',sub=mysub)
dev.off()
(myacf <- c(racf$acf))
(mypacf <- c(rpacf$acf))
lengthx <- length(x)
sqrtn <- sqrt(lengthx)
load(file='createtable')
a<-table.start()
a<-table.row.start(a)
a<-table.element(a,'Autocorrelation Function',4,TRUE)
a<-table.row.end(a)
a<-table.row.start(a)
a<-table.element(a,'Time lag k',header=TRUE)
a<-table.element(a,hyperlink('basics.htm','ACF(k)','click here for more information about the Autocorrelation Function'),header=TRUE)
a<-table.element(a,'T-STAT',header=TRUE)
a<-table.element(a,'P-value',header=TRUE)
a<-table.row.end(a)
for (i in 2:(par1+1)) {
a<-table.row.start(a)
a<-table.element(a,i-1,header=TRUE)
a<-table.element(a,round(myacf[i],6))
mytstat <- myacf[i]*sqrtn
a<-table.element(a,round(mytstat,4))
a<-table.element(a,round(1-pt(abs(mytstat),lengthx),6))
a<-table.row.end(a)
}
a<-table.end(a)
table.save(a,file='mytable.tab')
a<-table.start()
a<-table.row.start(a)
a<-table.element(a,'Partial Autocorrelation Function',4,TRUE)
a<-table.row.end(a)
a<-table.row.start(a)
a<-table.element(a,'Time lag k',header=TRUE)
a<-table.element(a,hyperlink('basics.htm','PACF(k)','click here for more information about the Partial Autocorrelation Function'),header=TRUE)
a<-table.element(a,'T-STAT',header=TRUE)
a<-table.element(a,'P-value',header=TRUE)
a<-table.row.end(a)
for (i in 1:par1) {
a<-table.row.start(a)
a<-table.element(a,i,header=TRUE)
a<-table.element(a,round(mypacf[i],6))
mytstat <- mypacf[i]*sqrtn
a<-table.element(a,round(mytstat,4))
a<-table.element(a,round(1-pt(abs(mytstat),lengthx),6))
a<-table.row.end(a)
}
a<-table.end(a)
table.save(a,file='mytable1.tab')