Free Statistics

of Irreproducible Research!

Author's title

Author*Unverified author*
R Software Modulerwasp_autocorrelation.wasp
Title produced by software(Partial) Autocorrelation Function
Date of computationTue, 15 Mar 2016 21:40:58 +0000
Cite this page as followsStatistical Computations at FreeStatistics.org, Office for Research Development and Education, URL https://freestatistics.org/blog/index.php?v=date/2016/Mar/15/t1458078114tbiszw7dfk9mxyk.htm/, Retrieved Tue, 30 Apr 2024 09:10:56 +0000
Statistical Computations at FreeStatistics.org, Office for Research Development and Education, URL https://freestatistics.org/blog/index.php?pk=294113, Retrieved Tue, 30 Apr 2024 09:10:56 +0000
QR Codes:

Original text written by user:
IsPrivate?No (this computation is public)
User-defined keywords
Estimated Impact84
Family? (F = Feedback message, R = changed R code, M = changed R Module, P = changed Parameters, D = changed Data)
-       [(Partial) Autocorrelation Function] [] [2016-03-15 21:40:58] [ac7ea8eb5659db737c8f3ddefda617c5] [Current]
- R PD    [(Partial) Autocorrelation Function] [] [2016-05-27 11:14:51] [1a32794f6d0828a41bce1c25d1e3e5ae]
Feedback Forum

Post a new message
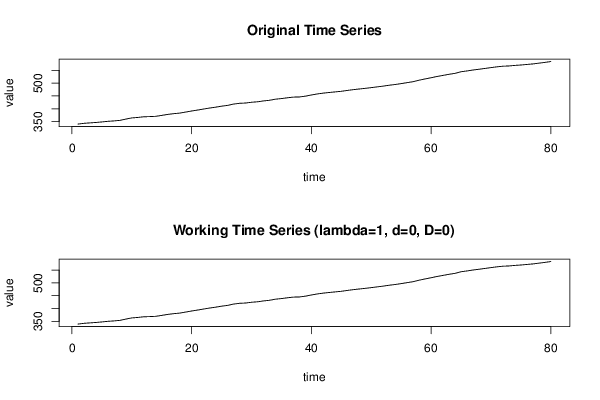
Dataseries X:
340,4
343,2
345
346,6
348,7
351,1
352,7
354,8
359,8
364,4
366,2
368,8
369,6
370,6
374,2
378,1
381
383,2
387,3
391,4
395,1
399,1
403
406,3
410,2
413,3
418,4
421,4
422,5
425,5
427,3
430,7
433,2
437,5
439,9
443
445,6
446,2
449,3
453,9
458
461,2
463,7
466
468,3
471,7
474,7
477,3
479,8
482,6
485,6
488,5
492
494,8
498,3
502,1
505,8
511,7
516,6
521,3
526,1
530,4
534,7
538,4
544,6
547,7
551,4
554,3
557,5
560,7
563,8
566,2
567,2
569,3
570,9
573
575,1
578,1
581
584,4


Summary of computational transaction
Raw Inputview raw input (R code)
Raw Outputview raw output of R engine
Computing time1 seconds
R Server'Sir Ronald Aylmer Fisher' @ fisher.wessa.net

\begin{tabular}{lllllllll}
\hline
Summary of computational transaction \tabularnewline
Raw Input & view raw input (R code)  \tabularnewline
Raw Output & view raw output of R engine  \tabularnewline
Computing time & 1 seconds \tabularnewline
R Server & 'Sir Ronald Aylmer Fisher' @ fisher.wessa.net \tabularnewline
\hline
\end{tabular}
%Source: https://freestatistics.org/blog/index.php?pk=294113&T=0

[TABLE]
[ROW][C]Summary of computational transaction[/C][/ROW]
[ROW][C]Raw Input[/C][C]view raw input (R code) [/C][/ROW]
[ROW][C]Raw Output[/C][C]view raw output of R engine [/C][/ROW]
[ROW][C]Computing time[/C][C]1 seconds[/C][/ROW]
[ROW][C]R Server[/C][C]'Sir Ronald Aylmer Fisher' @ fisher.wessa.net[/C][/ROW]
[/TABLE]
Source: https://freestatistics.org/blog/index.php?pk=294113&T=0

Globally Unique Identifier (entire table): ba.freestatistics.org/blog/index.php?pk=294113&T=0

As an alternative you can also use a QR Code:  

The GUIDs for individual cells are displayed in the table below:

Summary of computational transaction
Raw Inputview raw input (R code)
Raw Outputview raw output of R engine
Computing time1 seconds
R Server'Sir Ronald Aylmer Fisher' @ fisher.wessa.net


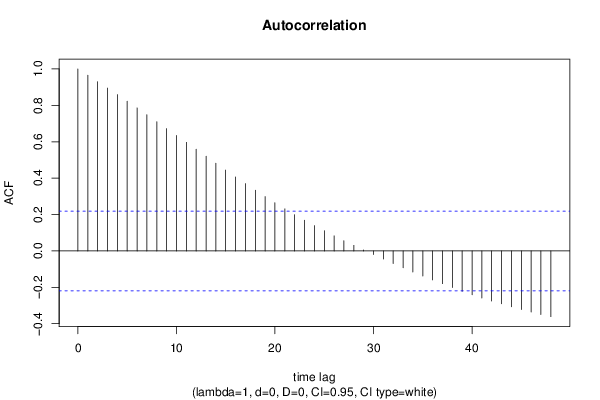
Autocorrelation Function
Time lag kACF(k)T-STATP-value
10.9651198.63230
20.9301748.31970
30.8948028.00340
40.8590137.68320
50.82277.35850
60.7859517.02980
70.7484056.69390
80.7103396.35350
90.6723056.01330
100.6346125.67610
110.5967275.33730
120.5589294.99922e-06
130.5207384.65766e-06
140.4821354.31242.3e-05
150.4440843.9727.7e-05
160.4065123.6360.000244
170.3700833.31017e-04
180.3338972.98650.001872
190.2986562.67130.004576
200.2644092.36490.010227
210.2312452.06830.020921
220.1992391.7820.039268
230.1684641.50680.067901
240.1390861.2440.108562
250.1106260.98950.162709
260.0829180.74160.230239
270.0564820.50520.307408
280.03060.27370.392511
290.0049670.04440.482338
30-0.020054-0.17940.429052
31-0.044778-0.40050.344924
32-0.068846-0.61580.269895
33-0.092533-0.82760.205169
34-0.1153-1.03130.15276
35-0.137525-1.23010.111139
36-0.1589-1.42120.079565
37-0.179851-1.60860.055817
38-0.200937-1.79720.038036
39-0.22142-1.98040.025546
40-0.240646-2.15240.01719
41-0.258462-2.31180.011682
42-0.274924-2.4590.008045
43-0.290635-2.59950.005557
44-0.306364-2.74020.003785
45-0.321519-2.87580.002582
46-0.335619-3.00190.001789
47-0.348958-3.12120.001253
48-0.361055-3.22949e-04

\begin{tabular}{lllllllll}
\hline
Autocorrelation Function \tabularnewline
Time lag k & ACF(k) & T-STAT & P-value \tabularnewline
1 & 0.965119 & 8.6323 & 0 \tabularnewline
2 & 0.930174 & 8.3197 & 0 \tabularnewline
3 & 0.894802 & 8.0034 & 0 \tabularnewline
4 & 0.859013 & 7.6832 & 0 \tabularnewline
5 & 0.8227 & 7.3585 & 0 \tabularnewline
6 & 0.785951 & 7.0298 & 0 \tabularnewline
7 & 0.748405 & 6.6939 & 0 \tabularnewline
8 & 0.710339 & 6.3535 & 0 \tabularnewline
9 & 0.672305 & 6.0133 & 0 \tabularnewline
10 & 0.634612 & 5.6761 & 0 \tabularnewline
11 & 0.596727 & 5.3373 & 0 \tabularnewline
12 & 0.558929 & 4.9992 & 2e-06 \tabularnewline
13 & 0.520738 & 4.6576 & 6e-06 \tabularnewline
14 & 0.482135 & 4.3124 & 2.3e-05 \tabularnewline
15 & 0.444084 & 3.972 & 7.7e-05 \tabularnewline
16 & 0.406512 & 3.636 & 0.000244 \tabularnewline
17 & 0.370083 & 3.3101 & 7e-04 \tabularnewline
18 & 0.333897 & 2.9865 & 0.001872 \tabularnewline
19 & 0.298656 & 2.6713 & 0.004576 \tabularnewline
20 & 0.264409 & 2.3649 & 0.010227 \tabularnewline
21 & 0.231245 & 2.0683 & 0.020921 \tabularnewline
22 & 0.199239 & 1.782 & 0.039268 \tabularnewline
23 & 0.168464 & 1.5068 & 0.067901 \tabularnewline
24 & 0.139086 & 1.244 & 0.108562 \tabularnewline
25 & 0.110626 & 0.9895 & 0.162709 \tabularnewline
26 & 0.082918 & 0.7416 & 0.230239 \tabularnewline
27 & 0.056482 & 0.5052 & 0.307408 \tabularnewline
28 & 0.0306 & 0.2737 & 0.392511 \tabularnewline
29 & 0.004967 & 0.0444 & 0.482338 \tabularnewline
30 & -0.020054 & -0.1794 & 0.429052 \tabularnewline
31 & -0.044778 & -0.4005 & 0.344924 \tabularnewline
32 & -0.068846 & -0.6158 & 0.269895 \tabularnewline
33 & -0.092533 & -0.8276 & 0.205169 \tabularnewline
34 & -0.1153 & -1.0313 & 0.15276 \tabularnewline
35 & -0.137525 & -1.2301 & 0.111139 \tabularnewline
36 & -0.1589 & -1.4212 & 0.079565 \tabularnewline
37 & -0.179851 & -1.6086 & 0.055817 \tabularnewline
38 & -0.200937 & -1.7972 & 0.038036 \tabularnewline
39 & -0.22142 & -1.9804 & 0.025546 \tabularnewline
40 & -0.240646 & -2.1524 & 0.01719 \tabularnewline
41 & -0.258462 & -2.3118 & 0.011682 \tabularnewline
42 & -0.274924 & -2.459 & 0.008045 \tabularnewline
43 & -0.290635 & -2.5995 & 0.005557 \tabularnewline
44 & -0.306364 & -2.7402 & 0.003785 \tabularnewline
45 & -0.321519 & -2.8758 & 0.002582 \tabularnewline
46 & -0.335619 & -3.0019 & 0.001789 \tabularnewline
47 & -0.348958 & -3.1212 & 0.001253 \tabularnewline
48 & -0.361055 & -3.2294 & 9e-04 \tabularnewline
\hline
\end{tabular}
%Source: https://freestatistics.org/blog/index.php?pk=294113&T=1

[TABLE]
[ROW][C]Autocorrelation Function[/C][/ROW]
[ROW][C]Time lag k[/C][C]ACF(k)[/C][C]T-STAT[/C][C]P-value[/C][/ROW]
[ROW][C]1[/C][C]0.965119[/C][C]8.6323[/C][C]0[/C][/ROW]
[ROW][C]2[/C][C]0.930174[/C][C]8.3197[/C][C]0[/C][/ROW]
[ROW][C]3[/C][C]0.894802[/C][C]8.0034[/C][C]0[/C][/ROW]
[ROW][C]4[/C][C]0.859013[/C][C]7.6832[/C][C]0[/C][/ROW]
[ROW][C]5[/C][C]0.8227[/C][C]7.3585[/C][C]0[/C][/ROW]
[ROW][C]6[/C][C]0.785951[/C][C]7.0298[/C][C]0[/C][/ROW]
[ROW][C]7[/C][C]0.748405[/C][C]6.6939[/C][C]0[/C][/ROW]
[ROW][C]8[/C][C]0.710339[/C][C]6.3535[/C][C]0[/C][/ROW]
[ROW][C]9[/C][C]0.672305[/C][C]6.0133[/C][C]0[/C][/ROW]
[ROW][C]10[/C][C]0.634612[/C][C]5.6761[/C][C]0[/C][/ROW]
[ROW][C]11[/C][C]0.596727[/C][C]5.3373[/C][C]0[/C][/ROW]
[ROW][C]12[/C][C]0.558929[/C][C]4.9992[/C][C]2e-06[/C][/ROW]
[ROW][C]13[/C][C]0.520738[/C][C]4.6576[/C][C]6e-06[/C][/ROW]
[ROW][C]14[/C][C]0.482135[/C][C]4.3124[/C][C]2.3e-05[/C][/ROW]
[ROW][C]15[/C][C]0.444084[/C][C]3.972[/C][C]7.7e-05[/C][/ROW]
[ROW][C]16[/C][C]0.406512[/C][C]3.636[/C][C]0.000244[/C][/ROW]
[ROW][C]17[/C][C]0.370083[/C][C]3.3101[/C][C]7e-04[/C][/ROW]
[ROW][C]18[/C][C]0.333897[/C][C]2.9865[/C][C]0.001872[/C][/ROW]
[ROW][C]19[/C][C]0.298656[/C][C]2.6713[/C][C]0.004576[/C][/ROW]
[ROW][C]20[/C][C]0.264409[/C][C]2.3649[/C][C]0.010227[/C][/ROW]
[ROW][C]21[/C][C]0.231245[/C][C]2.0683[/C][C]0.020921[/C][/ROW]
[ROW][C]22[/C][C]0.199239[/C][C]1.782[/C][C]0.039268[/C][/ROW]
[ROW][C]23[/C][C]0.168464[/C][C]1.5068[/C][C]0.067901[/C][/ROW]
[ROW][C]24[/C][C]0.139086[/C][C]1.244[/C][C]0.108562[/C][/ROW]
[ROW][C]25[/C][C]0.110626[/C][C]0.9895[/C][C]0.162709[/C][/ROW]
[ROW][C]26[/C][C]0.082918[/C][C]0.7416[/C][C]0.230239[/C][/ROW]
[ROW][C]27[/C][C]0.056482[/C][C]0.5052[/C][C]0.307408[/C][/ROW]
[ROW][C]28[/C][C]0.0306[/C][C]0.2737[/C][C]0.392511[/C][/ROW]
[ROW][C]29[/C][C]0.004967[/C][C]0.0444[/C][C]0.482338[/C][/ROW]
[ROW][C]30[/C][C]-0.020054[/C][C]-0.1794[/C][C]0.429052[/C][/ROW]
[ROW][C]31[/C][C]-0.044778[/C][C]-0.4005[/C][C]0.344924[/C][/ROW]
[ROW][C]32[/C][C]-0.068846[/C][C]-0.6158[/C][C]0.269895[/C][/ROW]
[ROW][C]33[/C][C]-0.092533[/C][C]-0.8276[/C][C]0.205169[/C][/ROW]
[ROW][C]34[/C][C]-0.1153[/C][C]-1.0313[/C][C]0.15276[/C][/ROW]
[ROW][C]35[/C][C]-0.137525[/C][C]-1.2301[/C][C]0.111139[/C][/ROW]
[ROW][C]36[/C][C]-0.1589[/C][C]-1.4212[/C][C]0.079565[/C][/ROW]
[ROW][C]37[/C][C]-0.179851[/C][C]-1.6086[/C][C]0.055817[/C][/ROW]
[ROW][C]38[/C][C]-0.200937[/C][C]-1.7972[/C][C]0.038036[/C][/ROW]
[ROW][C]39[/C][C]-0.22142[/C][C]-1.9804[/C][C]0.025546[/C][/ROW]
[ROW][C]40[/C][C]-0.240646[/C][C]-2.1524[/C][C]0.01719[/C][/ROW]
[ROW][C]41[/C][C]-0.258462[/C][C]-2.3118[/C][C]0.011682[/C][/ROW]
[ROW][C]42[/C][C]-0.274924[/C][C]-2.459[/C][C]0.008045[/C][/ROW]
[ROW][C]43[/C][C]-0.290635[/C][C]-2.5995[/C][C]0.005557[/C][/ROW]
[ROW][C]44[/C][C]-0.306364[/C][C]-2.7402[/C][C]0.003785[/C][/ROW]
[ROW][C]45[/C][C]-0.321519[/C][C]-2.8758[/C][C]0.002582[/C][/ROW]
[ROW][C]46[/C][C]-0.335619[/C][C]-3.0019[/C][C]0.001789[/C][/ROW]
[ROW][C]47[/C][C]-0.348958[/C][C]-3.1212[/C][C]0.001253[/C][/ROW]
[ROW][C]48[/C][C]-0.361055[/C][C]-3.2294[/C][C]9e-04[/C][/ROW]
[/TABLE]
Source: https://freestatistics.org/blog/index.php?pk=294113&T=1

Globally Unique Identifier (entire table): ba.freestatistics.org/blog/index.php?pk=294113&T=1

As an alternative you can also use a QR Code:  

The GUIDs for individual cells are displayed in the table below:

Autocorrelation Function
Time lag kACF(k)T-STATP-value
10.9651198.63230
20.9301748.31970
30.8948028.00340
40.8590137.68320
50.82277.35850
60.7859517.02980
70.7484056.69390
80.7103396.35350
90.6723056.01330
100.6346125.67610
110.5967275.33730
120.5589294.99922e-06
130.5207384.65766e-06
140.4821354.31242.3e-05
150.4440843.9727.7e-05
160.4065123.6360.000244
170.3700833.31017e-04
180.3338972.98650.001872
190.2986562.67130.004576
200.2644092.36490.010227
210.2312452.06830.020921
220.1992391.7820.039268
230.1684641.50680.067901
240.1390861.2440.108562
250.1106260.98950.162709
260.0829180.74160.230239
270.0564820.50520.307408
280.03060.27370.392511
290.0049670.04440.482338
30-0.020054-0.17940.429052
31-0.044778-0.40050.344924
32-0.068846-0.61580.269895
33-0.092533-0.82760.205169
34-0.1153-1.03130.15276
35-0.137525-1.23010.111139
36-0.1589-1.42120.079565
37-0.179851-1.60860.055817
38-0.200937-1.79720.038036
39-0.22142-1.98040.025546
40-0.240646-2.15240.01719
41-0.258462-2.31180.011682
42-0.274924-2.4590.008045
43-0.290635-2.59950.005557
44-0.306364-2.74020.003785
45-0.321519-2.87580.002582
46-0.335619-3.00190.001789
47-0.348958-3.12120.001253
48-0.361055-3.22949e-04


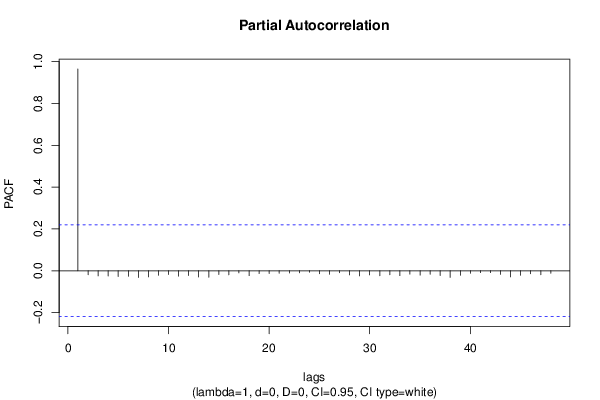
Partial Autocorrelation Function
Time lag kPACF(k)T-STATP-value
10.9651198.63230
2-0.018693-0.16720.433818
3-0.024316-0.21750.41419
4-0.024771-0.22160.412612
5-0.026845-0.24010.405431
6-0.026235-0.23470.407538
7-0.032119-0.28730.387321
8-0.028954-0.2590.39816
9-0.021586-0.19310.423697
10-0.017479-0.15630.438082
11-0.02561-0.22910.409702
12-0.022291-0.19940.421237
13-0.029839-0.26690.395123
14-0.031089-0.27810.390837
15-0.017912-0.16020.436561
16-0.01929-0.17250.431727
17-0.009857-0.08820.464982
18-0.022971-0.20550.418869
19-0.013317-0.11910.452743
20-0.012665-0.11330.455046
21-0.011692-0.10460.458487
22-0.010792-0.09650.461673
23-0.009716-0.08690.465482
24-0.006968-0.06230.47523
25-0.013779-0.12320.45111
26-0.016321-0.1460.442151
27-0.009115-0.08150.467614
28-0.019352-0.17310.431509
29-0.024347-0.21780.414083
30-0.019372-0.17330.431438
31-0.02391-0.21390.415601
32-0.019092-0.17080.432422
33-0.023176-0.20730.418156
34-0.015751-0.14090.444159
35-0.020786-0.18590.42649
36-0.016566-0.14820.441289
37-0.022829-0.20420.419363
38-0.031263-0.27960.390245
39-0.021167-0.18930.425159
40-0.011616-0.10390.458757
41-0.008586-0.07680.469489
42-0.008878-0.07940.468452
43-0.017222-0.1540.438984
44-0.028969-0.25910.398108
45-0.021132-0.1890.42528
46-0.014417-0.1290.448859
47-0.018952-0.16950.432911
48-0.011517-0.1030.459107

\begin{tabular}{lllllllll}
\hline
Partial Autocorrelation Function \tabularnewline
Time lag k & PACF(k) & T-STAT & P-value \tabularnewline
1 & 0.965119 & 8.6323 & 0 \tabularnewline
2 & -0.018693 & -0.1672 & 0.433818 \tabularnewline
3 & -0.024316 & -0.2175 & 0.41419 \tabularnewline
4 & -0.024771 & -0.2216 & 0.412612 \tabularnewline
5 & -0.026845 & -0.2401 & 0.405431 \tabularnewline
6 & -0.026235 & -0.2347 & 0.407538 \tabularnewline
7 & -0.032119 & -0.2873 & 0.387321 \tabularnewline
8 & -0.028954 & -0.259 & 0.39816 \tabularnewline
9 & -0.021586 & -0.1931 & 0.423697 \tabularnewline
10 & -0.017479 & -0.1563 & 0.438082 \tabularnewline
11 & -0.02561 & -0.2291 & 0.409702 \tabularnewline
12 & -0.022291 & -0.1994 & 0.421237 \tabularnewline
13 & -0.029839 & -0.2669 & 0.395123 \tabularnewline
14 & -0.031089 & -0.2781 & 0.390837 \tabularnewline
15 & -0.017912 & -0.1602 & 0.436561 \tabularnewline
16 & -0.01929 & -0.1725 & 0.431727 \tabularnewline
17 & -0.009857 & -0.0882 & 0.464982 \tabularnewline
18 & -0.022971 & -0.2055 & 0.418869 \tabularnewline
19 & -0.013317 & -0.1191 & 0.452743 \tabularnewline
20 & -0.012665 & -0.1133 & 0.455046 \tabularnewline
21 & -0.011692 & -0.1046 & 0.458487 \tabularnewline
22 & -0.010792 & -0.0965 & 0.461673 \tabularnewline
23 & -0.009716 & -0.0869 & 0.465482 \tabularnewline
24 & -0.006968 & -0.0623 & 0.47523 \tabularnewline
25 & -0.013779 & -0.1232 & 0.45111 \tabularnewline
26 & -0.016321 & -0.146 & 0.442151 \tabularnewline
27 & -0.009115 & -0.0815 & 0.467614 \tabularnewline
28 & -0.019352 & -0.1731 & 0.431509 \tabularnewline
29 & -0.024347 & -0.2178 & 0.414083 \tabularnewline
30 & -0.019372 & -0.1733 & 0.431438 \tabularnewline
31 & -0.02391 & -0.2139 & 0.415601 \tabularnewline
32 & -0.019092 & -0.1708 & 0.432422 \tabularnewline
33 & -0.023176 & -0.2073 & 0.418156 \tabularnewline
34 & -0.015751 & -0.1409 & 0.444159 \tabularnewline
35 & -0.020786 & -0.1859 & 0.42649 \tabularnewline
36 & -0.016566 & -0.1482 & 0.441289 \tabularnewline
37 & -0.022829 & -0.2042 & 0.419363 \tabularnewline
38 & -0.031263 & -0.2796 & 0.390245 \tabularnewline
39 & -0.021167 & -0.1893 & 0.425159 \tabularnewline
40 & -0.011616 & -0.1039 & 0.458757 \tabularnewline
41 & -0.008586 & -0.0768 & 0.469489 \tabularnewline
42 & -0.008878 & -0.0794 & 0.468452 \tabularnewline
43 & -0.017222 & -0.154 & 0.438984 \tabularnewline
44 & -0.028969 & -0.2591 & 0.398108 \tabularnewline
45 & -0.021132 & -0.189 & 0.42528 \tabularnewline
46 & -0.014417 & -0.129 & 0.448859 \tabularnewline
47 & -0.018952 & -0.1695 & 0.432911 \tabularnewline
48 & -0.011517 & -0.103 & 0.459107 \tabularnewline
\hline
\end{tabular}
%Source: https://freestatistics.org/blog/index.php?pk=294113&T=2

[TABLE]
[ROW][C]Partial Autocorrelation Function[/C][/ROW]
[ROW][C]Time lag k[/C][C]PACF(k)[/C][C]T-STAT[/C][C]P-value[/C][/ROW]
[ROW][C]1[/C][C]0.965119[/C][C]8.6323[/C][C]0[/C][/ROW]
[ROW][C]2[/C][C]-0.018693[/C][C]-0.1672[/C][C]0.433818[/C][/ROW]
[ROW][C]3[/C][C]-0.024316[/C][C]-0.2175[/C][C]0.41419[/C][/ROW]
[ROW][C]4[/C][C]-0.024771[/C][C]-0.2216[/C][C]0.412612[/C][/ROW]
[ROW][C]5[/C][C]-0.026845[/C][C]-0.2401[/C][C]0.405431[/C][/ROW]
[ROW][C]6[/C][C]-0.026235[/C][C]-0.2347[/C][C]0.407538[/C][/ROW]
[ROW][C]7[/C][C]-0.032119[/C][C]-0.2873[/C][C]0.387321[/C][/ROW]
[ROW][C]8[/C][C]-0.028954[/C][C]-0.259[/C][C]0.39816[/C][/ROW]
[ROW][C]9[/C][C]-0.021586[/C][C]-0.1931[/C][C]0.423697[/C][/ROW]
[ROW][C]10[/C][C]-0.017479[/C][C]-0.1563[/C][C]0.438082[/C][/ROW]
[ROW][C]11[/C][C]-0.02561[/C][C]-0.2291[/C][C]0.409702[/C][/ROW]
[ROW][C]12[/C][C]-0.022291[/C][C]-0.1994[/C][C]0.421237[/C][/ROW]
[ROW][C]13[/C][C]-0.029839[/C][C]-0.2669[/C][C]0.395123[/C][/ROW]
[ROW][C]14[/C][C]-0.031089[/C][C]-0.2781[/C][C]0.390837[/C][/ROW]
[ROW][C]15[/C][C]-0.017912[/C][C]-0.1602[/C][C]0.436561[/C][/ROW]
[ROW][C]16[/C][C]-0.01929[/C][C]-0.1725[/C][C]0.431727[/C][/ROW]
[ROW][C]17[/C][C]-0.009857[/C][C]-0.0882[/C][C]0.464982[/C][/ROW]
[ROW][C]18[/C][C]-0.022971[/C][C]-0.2055[/C][C]0.418869[/C][/ROW]
[ROW][C]19[/C][C]-0.013317[/C][C]-0.1191[/C][C]0.452743[/C][/ROW]
[ROW][C]20[/C][C]-0.012665[/C][C]-0.1133[/C][C]0.455046[/C][/ROW]
[ROW][C]21[/C][C]-0.011692[/C][C]-0.1046[/C][C]0.458487[/C][/ROW]
[ROW][C]22[/C][C]-0.010792[/C][C]-0.0965[/C][C]0.461673[/C][/ROW]
[ROW][C]23[/C][C]-0.009716[/C][C]-0.0869[/C][C]0.465482[/C][/ROW]
[ROW][C]24[/C][C]-0.006968[/C][C]-0.0623[/C][C]0.47523[/C][/ROW]
[ROW][C]25[/C][C]-0.013779[/C][C]-0.1232[/C][C]0.45111[/C][/ROW]
[ROW][C]26[/C][C]-0.016321[/C][C]-0.146[/C][C]0.442151[/C][/ROW]
[ROW][C]27[/C][C]-0.009115[/C][C]-0.0815[/C][C]0.467614[/C][/ROW]
[ROW][C]28[/C][C]-0.019352[/C][C]-0.1731[/C][C]0.431509[/C][/ROW]
[ROW][C]29[/C][C]-0.024347[/C][C]-0.2178[/C][C]0.414083[/C][/ROW]
[ROW][C]30[/C][C]-0.019372[/C][C]-0.1733[/C][C]0.431438[/C][/ROW]
[ROW][C]31[/C][C]-0.02391[/C][C]-0.2139[/C][C]0.415601[/C][/ROW]
[ROW][C]32[/C][C]-0.019092[/C][C]-0.1708[/C][C]0.432422[/C][/ROW]
[ROW][C]33[/C][C]-0.023176[/C][C]-0.2073[/C][C]0.418156[/C][/ROW]
[ROW][C]34[/C][C]-0.015751[/C][C]-0.1409[/C][C]0.444159[/C][/ROW]
[ROW][C]35[/C][C]-0.020786[/C][C]-0.1859[/C][C]0.42649[/C][/ROW]
[ROW][C]36[/C][C]-0.016566[/C][C]-0.1482[/C][C]0.441289[/C][/ROW]
[ROW][C]37[/C][C]-0.022829[/C][C]-0.2042[/C][C]0.419363[/C][/ROW]
[ROW][C]38[/C][C]-0.031263[/C][C]-0.2796[/C][C]0.390245[/C][/ROW]
[ROW][C]39[/C][C]-0.021167[/C][C]-0.1893[/C][C]0.425159[/C][/ROW]
[ROW][C]40[/C][C]-0.011616[/C][C]-0.1039[/C][C]0.458757[/C][/ROW]
[ROW][C]41[/C][C]-0.008586[/C][C]-0.0768[/C][C]0.469489[/C][/ROW]
[ROW][C]42[/C][C]-0.008878[/C][C]-0.0794[/C][C]0.468452[/C][/ROW]
[ROW][C]43[/C][C]-0.017222[/C][C]-0.154[/C][C]0.438984[/C][/ROW]
[ROW][C]44[/C][C]-0.028969[/C][C]-0.2591[/C][C]0.398108[/C][/ROW]
[ROW][C]45[/C][C]-0.021132[/C][C]-0.189[/C][C]0.42528[/C][/ROW]
[ROW][C]46[/C][C]-0.014417[/C][C]-0.129[/C][C]0.448859[/C][/ROW]
[ROW][C]47[/C][C]-0.018952[/C][C]-0.1695[/C][C]0.432911[/C][/ROW]
[ROW][C]48[/C][C]-0.011517[/C][C]-0.103[/C][C]0.459107[/C][/ROW]
[/TABLE]
Source: https://freestatistics.org/blog/index.php?pk=294113&T=2

Globally Unique Identifier (entire table): ba.freestatistics.org/blog/index.php?pk=294113&T=2

As an alternative you can also use a QR Code:  

The GUIDs for individual cells are displayed in the table below:

Partial Autocorrelation Function
Time lag kPACF(k)T-STATP-value
10.9651198.63230
2-0.018693-0.16720.433818
3-0.024316-0.21750.41419
4-0.024771-0.22160.412612
5-0.026845-0.24010.405431
6-0.026235-0.23470.407538
7-0.032119-0.28730.387321
8-0.028954-0.2590.39816
9-0.021586-0.19310.423697
10-0.017479-0.15630.438082
11-0.02561-0.22910.409702
12-0.022291-0.19940.421237
13-0.029839-0.26690.395123
14-0.031089-0.27810.390837
15-0.017912-0.16020.436561
16-0.01929-0.17250.431727
17-0.009857-0.08820.464982
18-0.022971-0.20550.418869
19-0.013317-0.11910.452743
20-0.012665-0.11330.455046
21-0.011692-0.10460.458487
22-0.010792-0.09650.461673
23-0.009716-0.08690.465482
24-0.006968-0.06230.47523
25-0.013779-0.12320.45111
26-0.016321-0.1460.442151
27-0.009115-0.08150.467614
28-0.019352-0.17310.431509
29-0.024347-0.21780.414083
30-0.019372-0.17330.431438
31-0.02391-0.21390.415601
32-0.019092-0.17080.432422
33-0.023176-0.20730.418156
34-0.015751-0.14090.444159
35-0.020786-0.18590.42649
36-0.016566-0.14820.441289
37-0.022829-0.20420.419363
38-0.031263-0.27960.390245
39-0.021167-0.18930.425159
40-0.011616-0.10390.458757
41-0.008586-0.07680.469489
42-0.008878-0.07940.468452
43-0.017222-0.1540.438984
44-0.028969-0.25910.398108
45-0.021132-0.1890.42528
46-0.014417-0.1290.448859
47-0.018952-0.16950.432911
48-0.011517-0.1030.459107


Parameters (Session):
par1 = 48 ; par2 = 1 ; par3 = 0 ; par4 = 0 ; par5 = 12 ; par6 = White Noise ; par7 = 0.95 ;
Parameters (R input):
par1 = 48 ; par2 = 1 ; par3 = 0 ; par4 = 0 ; par5 = 12 ; par6 = White Noise ; par7 = 0.95 ; par8 = ;
R code (references can be found in the software module):
if (par1 == 'Default') {
par1 = 10*log10(length(x))
} else {
par1 <- as.numeric(par1)
}
par2 <- as.numeric(par2)
par3 <- as.numeric(par3)
par4 <- as.numeric(par4)
par5 <- as.numeric(par5)
if (par6 == 'White Noise') par6 <- 'white' else par6 <- 'ma'
par7 <- as.numeric(par7)
if (par8 != '') par8 <- as.numeric(par8)
x <- na.omit(x)
ox <- x
if (par8 == '') {
if (par2 == 0) {
x <- log(x)
} else {
x <- (x ^ par2 - 1) / par2
}
} else {
x <- log(x,base=par8)
}
if (par3 > 0) x <- diff(x,lag=1,difference=par3)
if (par4 > 0) x <- diff(x,lag=par5,difference=par4)
bitmap(file='picts.png')
op <- par(mfrow=c(2,1))
plot(ox,type='l',main='Original Time Series',xlab='time',ylab='value')
if (par8=='') {
mytitle <- paste('Working Time Series (lambda=',par2,', d=',par3,', D=',par4,')',sep='')
mysub <- paste('(lambda=',par2,', d=',par3,', D=',par4,', CI=', par7, ', CI type=',par6,')',sep='')
} else {
mytitle <- paste('Working Time Series (base=',par8,', d=',par3,', D=',par4,')',sep='')
mysub <- paste('(base=',par8,', d=',par3,', D=',par4,', CI=', par7, ', CI type=',par6,')',sep='')
}
plot(x,type='l', main=mytitle,xlab='time',ylab='value')
par(op)
dev.off()
bitmap(file='pic1.png')
racf <- acf(x, par1, main='Autocorrelation', xlab='time lag', ylab='ACF', ci.type=par6, ci=par7, sub=mysub)
dev.off()
bitmap(file='pic2.png')
rpacf <- pacf(x,par1,main='Partial Autocorrelation',xlab='lags',ylab='PACF',sub=mysub)
dev.off()
(myacf <- c(racf$acf))
(mypacf <- c(rpacf$acf))
lengthx <- length(x)
sqrtn <- sqrt(lengthx)
load(file='createtable')
a<-table.start()
a<-table.row.start(a)
a<-table.element(a,'Autocorrelation Function',4,TRUE)
a<-table.row.end(a)
a<-table.row.start(a)
a<-table.element(a,'Time lag k',header=TRUE)
a<-table.element(a,hyperlink('basics.htm','ACF(k)','click here for more information about the Autocorrelation Function'),header=TRUE)
a<-table.element(a,'T-STAT',header=TRUE)
a<-table.element(a,'P-value',header=TRUE)
a<-table.row.end(a)
for (i in 2:(par1+1)) {
a<-table.row.start(a)
a<-table.element(a,i-1,header=TRUE)
a<-table.element(a,round(myacf[i],6))
mytstat <- myacf[i]*sqrtn
a<-table.element(a,round(mytstat,4))
a<-table.element(a,round(1-pt(abs(mytstat),lengthx),6))
a<-table.row.end(a)
}
a<-table.end(a)
table.save(a,file='mytable.tab')
a<-table.start()
a<-table.row.start(a)
a<-table.element(a,'Partial Autocorrelation Function',4,TRUE)
a<-table.row.end(a)
a<-table.row.start(a)
a<-table.element(a,'Time lag k',header=TRUE)
a<-table.element(a,hyperlink('basics.htm','PACF(k)','click here for more information about the Partial Autocorrelation Function'),header=TRUE)
a<-table.element(a,'T-STAT',header=TRUE)
a<-table.element(a,'P-value',header=TRUE)
a<-table.row.end(a)
for (i in 1:par1) {
a<-table.row.start(a)
a<-table.element(a,i,header=TRUE)
a<-table.element(a,round(mypacf[i],6))
mytstat <- mypacf[i]*sqrtn
a<-table.element(a,round(mytstat,4))
a<-table.element(a,round(1-pt(abs(mytstat),lengthx),6))
a<-table.row.end(a)
}
a<-table.end(a)
table.save(a,file='mytable1.tab')