Free Statistics

of Irreproducible Research!

Author's title

Author*Unverified author*
R Software Modulerwasp_smp.wasp
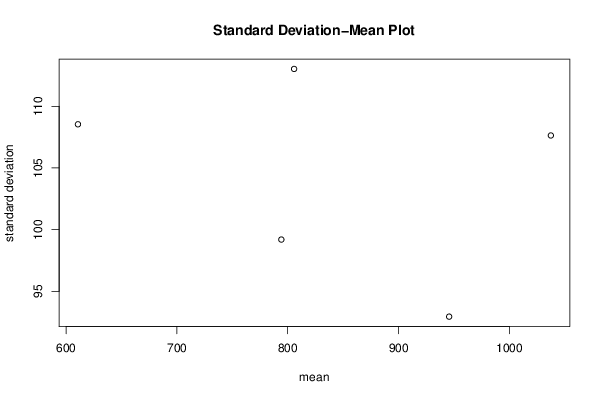
Title produced by softwareStandard Deviation-Mean Plot
Date of computationTue, 22 Mar 2016 21:40:44 +0000
Cite this page as followsStatistical Computations at FreeStatistics.org, Office for Research Development and Education, URL https://freestatistics.org/blog/index.php?v=date/2016/Mar/22/t1458682891rjasughmv8qeeon.htm/, Retrieved Mon, 29 Apr 2024 08:48:16 +0000
Statistical Computations at FreeStatistics.org, Office for Research Development and Education, URL https://freestatistics.org/blog/index.php?pk=294493, Retrieved Mon, 29 Apr 2024 08:48:16 +0000
QR Codes:

Original text written by user:
IsPrivate?No (this computation is public)
User-defined keywords
Estimated Impact63
Family? (F = Feedback message, R = changed R code, M = changed R Module, P = changed Parameters, D = changed Data)
-       [Standard Deviation-Mean Plot] [Standard Deviatio...] [2016-03-22 21:40:44] [45930f35caeb32be6f319da4f3b0c690] [Current]
Feedback Forum

Post a new message
Dataseries X:
726
784
884
696
893
674
703
799
793
799
1022
758
1021
944
915
864
1022
891
1087
822
890
1092
967
833
1104
1063
1103
1039
1185
1047
1155
878
879
1133
920
943
938
900
781
1040
792
653
866
679
799
760
699
762
671
679
862
624
516
650
583
444
562
540
524
674


Summary of computational transaction
Raw Inputview raw input (R code)
Raw Outputview raw output of R engine
Computing time1 seconds
R Server'Sir Maurice George Kendall' @ kendall.wessa.net

\begin{tabular}{lllllllll}
\hline
Summary of computational transaction \tabularnewline
Raw Input & view raw input (R code)  \tabularnewline
Raw Output & view raw output of R engine  \tabularnewline
Computing time & 1 seconds \tabularnewline
R Server & 'Sir Maurice George Kendall' @ kendall.wessa.net \tabularnewline
\hline
\end{tabular}
%Source: https://freestatistics.org/blog/index.php?pk=294493&T=0

[TABLE]
[ROW][C]Summary of computational transaction[/C][/ROW]
[ROW][C]Raw Input[/C][C]view raw input (R code) [/C][/ROW]
[ROW][C]Raw Output[/C][C]view raw output of R engine [/C][/ROW]
[ROW][C]Computing time[/C][C]1 seconds[/C][/ROW]
[ROW][C]R Server[/C][C]'Sir Maurice George Kendall' @ kendall.wessa.net[/C][/ROW]
[/TABLE]
Source: https://freestatistics.org/blog/index.php?pk=294493&T=0

Globally Unique Identifier (entire table): ba.freestatistics.org/blog/index.php?pk=294493&T=0

As an alternative you can also use a QR Code:  

The GUIDs for individual cells are displayed in the table below:

Summary of computational transaction
Raw Inputview raw input (R code)
Raw Outputview raw output of R engine
Computing time1 seconds
R Server'Sir Maurice George Kendall' @ kendall.wessa.net


Standard Deviation-Mean Plot
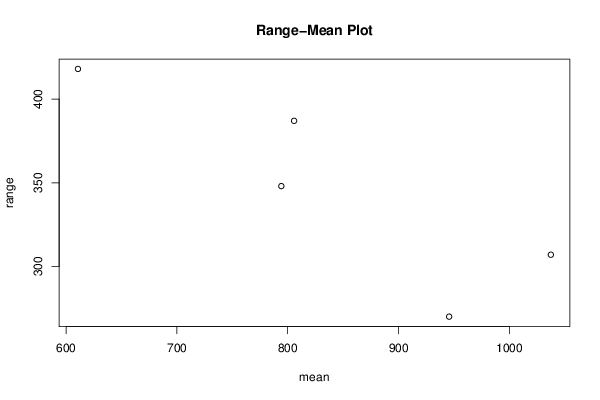
SectionMeanStandard DeviationRange
1794.2599.196888697543348
2945.66666666666792.9480141441082270
31037.41666666667107.634447285357307
4805.75113.026243935565387
5610.75108.540838564863418

\begin{tabular}{lllllllll}
\hline
Standard Deviation-Mean Plot \tabularnewline
Section & Mean & Standard Deviation & Range \tabularnewline
1 & 794.25 & 99.196888697543 & 348 \tabularnewline
2 & 945.666666666667 & 92.9480141441082 & 270 \tabularnewline
3 & 1037.41666666667 & 107.634447285357 & 307 \tabularnewline
4 & 805.75 & 113.026243935565 & 387 \tabularnewline
5 & 610.75 & 108.540838564863 & 418 \tabularnewline
\hline
\end{tabular}
%Source: https://freestatistics.org/blog/index.php?pk=294493&T=1

[TABLE]
[ROW][C]Standard Deviation-Mean Plot[/C][/ROW]
[ROW][C]Section[/C][C]Mean[/C][C]Standard Deviation[/C][C]Range[/C][/ROW]
[ROW][C]1[/C][C]794.25[/C][C]99.196888697543[/C][C]348[/C][/ROW]
[ROW][C]2[/C][C]945.666666666667[/C][C]92.9480141441082[/C][C]270[/C][/ROW]
[ROW][C]3[/C][C]1037.41666666667[/C][C]107.634447285357[/C][C]307[/C][/ROW]
[ROW][C]4[/C][C]805.75[/C][C]113.026243935565[/C][C]387[/C][/ROW]
[ROW][C]5[/C][C]610.75[/C][C]108.540838564863[/C][C]418[/C][/ROW]
[/TABLE]
Source: https://freestatistics.org/blog/index.php?pk=294493&T=1

Globally Unique Identifier (entire table): ba.freestatistics.org/blog/index.php?pk=294493&T=1

As an alternative you can also use a QR Code:  

The GUIDs for individual cells are displayed in the table below:

Standard Deviation-Mean Plot
SectionMeanStandard DeviationRange
1794.2599.196888697543348
2945.66666666666792.9480141441082270
31037.41666666667107.634447285357307
4805.75113.026243935565387
5610.75108.540838564863418


Regression: S.E.(k) = alpha + beta * Mean(k)
alpha116.76977146259
beta-0.0149034116803673
S.D.0.0272841493014114
T-STAT-0.546229663081209
p-value0.622909874112229

\begin{tabular}{lllllllll}
\hline
Regression: S.E.(k) = alpha + beta * Mean(k) \tabularnewline
alpha & 116.76977146259 \tabularnewline
beta & -0.0149034116803673 \tabularnewline
S.D. & 0.0272841493014114 \tabularnewline
T-STAT & -0.546229663081209 \tabularnewline
p-value & 0.622909874112229 \tabularnewline
\hline
\end{tabular}
%Source: https://freestatistics.org/blog/index.php?pk=294493&T=2

[TABLE]
[ROW][C]Regression: S.E.(k) = alpha + beta * Mean(k)[/C][/ROW]
[ROW][C]alpha[/C][C]116.76977146259[/C][/ROW]
[ROW][C]beta[/C][C]-0.0149034116803673[/C][/ROW]
[ROW][C]S.D.[/C][C]0.0272841493014114[/C][/ROW]
[ROW][C]T-STAT[/C][C]-0.546229663081209[/C][/ROW]
[ROW][C]p-value[/C][C]0.622909874112229[/C][/ROW]
[/TABLE]
Source: https://freestatistics.org/blog/index.php?pk=294493&T=2

Globally Unique Identifier (entire table): ba.freestatistics.org/blog/index.php?pk=294493&T=2

As an alternative you can also use a QR Code:  

The GUIDs for individual cells are displayed in the table below:

Regression: S.E.(k) = alpha + beta * Mean(k)
alpha116.76977146259
beta-0.0149034116803673
S.D.0.0272841493014114
T-STAT-0.546229663081209
p-value0.622909874112229


Regression: ln S.E.(k) = alpha + beta * ln Mean(k)
alpha5.48584940233537
beta-0.125270484035845
S.D.0.212839424949671
T-STAT-0.588568044033509
p-value0.59752786771855
Lambda1.12527048403584

\begin{tabular}{lllllllll}
\hline
Regression: ln S.E.(k) = alpha + beta * ln Mean(k) \tabularnewline
alpha & 5.48584940233537 \tabularnewline
beta & -0.125270484035845 \tabularnewline
S.D. & 0.212839424949671 \tabularnewline
T-STAT & -0.588568044033509 \tabularnewline
p-value & 0.59752786771855 \tabularnewline
Lambda & 1.12527048403584 \tabularnewline
\hline
\end{tabular}
%Source: https://freestatistics.org/blog/index.php?pk=294493&T=3

[TABLE]
[ROW][C]Regression: ln S.E.(k) = alpha + beta * ln Mean(k)[/C][/ROW]
[ROW][C]alpha[/C][C]5.48584940233537[/C][/ROW]
[ROW][C]beta[/C][C]-0.125270484035845[/C][/ROW]
[ROW][C]S.D.[/C][C]0.212839424949671[/C][/ROW]
[ROW][C]T-STAT[/C][C]-0.588568044033509[/C][/ROW]
[ROW][C]p-value[/C][C]0.59752786771855[/C][/ROW]
[ROW][C]Lambda[/C][C]1.12527048403584[/C][/ROW]
[/TABLE]
Source: https://freestatistics.org/blog/index.php?pk=294493&T=3

Globally Unique Identifier (entire table): ba.freestatistics.org/blog/index.php?pk=294493&T=3

As an alternative you can also use a QR Code:  

The GUIDs for individual cells are displayed in the table below:

Regression: ln S.E.(k) = alpha + beta * ln Mean(k)
alpha5.48584940233537
beta-0.125270484035845
S.D.0.212839424949671
T-STAT-0.588568044033509
p-value0.59752786771855
Lambda1.12527048403584


Parameters (Session):
par1 = 12 ;
Parameters (R input):
par1 = 12 ;
R code (references can be found in the software module):
par1 <- as.numeric(par1)
(n <- length(x))
(np <- floor(n / par1))
arr <- array(NA,dim=c(par1,np))
j <- 0
k <- 1
for (i in 1:(np*par1))
{
j = j + 1
arr[j,k] <- x[i]
if (j == par1) {
j = 0
k=k+1
}
}
arr
arr.mean <- array(NA,dim=np)
arr.sd <- array(NA,dim=np)
arr.range <- array(NA,dim=np)
for (j in 1:np)
{
arr.mean[j] <- mean(arr[,j],na.rm=TRUE)
arr.sd[j] <- sd(arr[,j],na.rm=TRUE)
arr.range[j] <- max(arr[,j],na.rm=TRUE) - min(arr[,j],na.rm=TRUE)
}
arr.mean
arr.sd
arr.range
(lm1 <- lm(arr.sd~arr.mean))
(lnlm1 <- lm(log(arr.sd)~log(arr.mean)))
(lm2 <- lm(arr.range~arr.mean))
bitmap(file='test1.png')
plot(arr.mean,arr.sd,main='Standard Deviation-Mean Plot',xlab='mean',ylab='standard deviation')
dev.off()
bitmap(file='test2.png')
plot(arr.mean,arr.range,main='Range-Mean Plot',xlab='mean',ylab='range')
dev.off()
load(file='createtable')
a<-table.start()
a<-table.row.start(a)
a<-table.element(a,'Standard Deviation-Mean Plot',4,TRUE)
a<-table.row.end(a)
a<-table.row.start(a)
a<-table.element(a,'Section',header=TRUE)
a<-table.element(a,'Mean',header=TRUE)
a<-table.element(a,'Standard Deviation',header=TRUE)
a<-table.element(a,'Range',header=TRUE)
a<-table.row.end(a)
for (j in 1:np) {
a<-table.row.start(a)
a<-table.element(a,j,header=TRUE)
a<-table.element(a,arr.mean[j])
a<-table.element(a,arr.sd[j] )
a<-table.element(a,arr.range[j] )
a<-table.row.end(a)
}
a<-table.end(a)
table.save(a,file='mytable.tab')
a<-table.start()
a<-table.row.start(a)
a<-table.element(a,'Regression: S.E.(k) = alpha + beta * Mean(k)',2,TRUE)
a<-table.row.end(a)
a<-table.row.start(a)
a<-table.element(a,'alpha',header=TRUE)
a<-table.element(a,lm1$coefficients[[1]])
a<-table.row.end(a)
a<-table.row.start(a)
a<-table.element(a,'beta',header=TRUE)
a<-table.element(a,lm1$coefficients[[2]])
a<-table.row.end(a)
a<-table.row.start(a)
a<-table.element(a,'S.D.',header=TRUE)
a<-table.element(a,summary(lm1)$coefficients[2,2])
a<-table.row.end(a)
a<-table.row.start(a)
a<-table.element(a,'T-STAT',header=TRUE)
a<-table.element(a,summary(lm1)$coefficients[2,3])
a<-table.row.end(a)
a<-table.row.start(a)
a<-table.element(a,'p-value',header=TRUE)
a<-table.element(a,summary(lm1)$coefficients[2,4])
a<-table.row.end(a)
a<-table.end(a)
table.save(a,file='mytable1.tab')
a<-table.start()
a<-table.row.start(a)
a<-table.element(a,'Regression: ln S.E.(k) = alpha + beta * ln Mean(k)',2,TRUE)
a<-table.row.end(a)
a<-table.row.start(a)
a<-table.element(a,'alpha',header=TRUE)
a<-table.element(a,lnlm1$coefficients[[1]])
a<-table.row.end(a)
a<-table.row.start(a)
a<-table.element(a,'beta',header=TRUE)
a<-table.element(a,lnlm1$coefficients[[2]])
a<-table.row.end(a)
a<-table.row.start(a)
a<-table.element(a,'S.D.',header=TRUE)
a<-table.element(a,summary(lnlm1)$coefficients[2,2])
a<-table.row.end(a)
a<-table.row.start(a)
a<-table.element(a,'T-STAT',header=TRUE)
a<-table.element(a,summary(lnlm1)$coefficients[2,3])
a<-table.row.end(a)
a<-table.row.start(a)
a<-table.element(a,'p-value',header=TRUE)
a<-table.element(a,summary(lnlm1)$coefficients[2,4])
a<-table.row.end(a)
a<-table.row.start(a)
a<-table.element(a,'Lambda',header=TRUE)
a<-table.element(a,1-lnlm1$coefficients[[2]])
a<-table.row.end(a)
a<-table.end(a)
table.save(a,file='mytable2.tab')