Free Statistics

of Irreproducible Research!

Author's title

Author*Unverified author*
R Software Modulerwasp_exponentialsmoothing.wasp
Title produced by softwareExponential Smoothing
Date of computationMon, 02 May 2016 11:12:25 +0100
Cite this page as followsStatistical Computations at FreeStatistics.org, Office for Research Development and Education, URL https://freestatistics.org/blog/index.php?v=date/2016/May/02/t1462184025divg6t0e6vsnkfq.htm/, Retrieved Sun, 05 May 2024 16:08:15 +0000
Statistical Computations at FreeStatistics.org, Office for Research Development and Education, URL https://freestatistics.org/blog/index.php?pk=295112, Retrieved Sun, 05 May 2024 16:08:15 +0000
QR Codes:

Original text written by user:
IsPrivate?No (this computation is public)
User-defined keywords
Estimated Impact105
Family? (F = Feedback message, R = changed R code, M = changed R Module, P = changed Parameters, D = changed Data)
-     [Harrell-Davis Quantiles] [Harrel-Davis Quan...] [2016-02-27 10:54:55] [c654849ccc5a3f9604e59101648dee14]
- RMP     [Exponential Smoothing] [Exponential Smoot...] [2016-05-02 10:12:25] [fcb50c3fd850be3d4e9c7b78a2663ee0] [Current]
Feedback Forum

Post a new message
Dataseries X:
86,37
86,84
86,73
90,99
92,61
93,83
94,2
94,01
93,47
93,27
94,3
94,53
94,59
94,69
94,67
96,55
97,14
97,32
97,97
98,49
99,11
99,09
98,76
99,2
99,61
99,54
99,68
100,75
100,38
100,79
100,39
100,39
100,12
100
99,17
99,17
99,59
99,96
99,68
101,03
100,99
101,38
101,84
101,52
101,37
101,22
101,45
101,99
104,05
104,61
105,06
105,4
104,71
104,8
104,83
104,81
104,49
104,59
104,5
104,61


Summary of computational transaction
Raw Inputview raw input (R code)
Raw Outputview raw output of R engine
Computing time2 seconds
R Server'Sir Maurice George Kendall' @ kendall.wessa.net

\begin{tabular}{lllllllll}
\hline
Summary of computational transaction \tabularnewline
Raw Input & view raw input (R code)  \tabularnewline
Raw Output & view raw output of R engine  \tabularnewline
Computing time & 2 seconds \tabularnewline
R Server & 'Sir Maurice George Kendall' @ kendall.wessa.net \tabularnewline
\hline
\end{tabular}
%Source: https://freestatistics.org/blog/index.php?pk=295112&T=0

[TABLE]
[ROW][C]Summary of computational transaction[/C][/ROW]
[ROW][C]Raw Input[/C][C]view raw input (R code) [/C][/ROW]
[ROW][C]Raw Output[/C][C]view raw output of R engine [/C][/ROW]
[ROW][C]Computing time[/C][C]2 seconds[/C][/ROW]
[ROW][C]R Server[/C][C]'Sir Maurice George Kendall' @ kendall.wessa.net[/C][/ROW]
[/TABLE]
Source: https://freestatistics.org/blog/index.php?pk=295112&T=0

Globally Unique Identifier (entire table): ba.freestatistics.org/blog/index.php?pk=295112&T=0

As an alternative you can also use a QR Code:  

The GUIDs for individual cells are displayed in the table below:

Summary of computational transaction
Raw Inputview raw input (R code)
Raw Outputview raw output of R engine
Computing time2 seconds
R Server'Sir Maurice George Kendall' @ kendall.wessa.net


Estimated Parameters of Exponential Smoothing
ParameterValue
alpha0.665932641075839
beta0.0480086184585807
gamma1

\begin{tabular}{lllllllll}
\hline
Estimated Parameters of Exponential Smoothing \tabularnewline
Parameter & Value \tabularnewline
alpha & 0.665932641075839 \tabularnewline
beta & 0.0480086184585807 \tabularnewline
gamma & 1 \tabularnewline
\hline
\end{tabular}
%Source: https://freestatistics.org/blog/index.php?pk=295112&T=1

[TABLE]
[ROW][C]Estimated Parameters of Exponential Smoothing[/C][/ROW]
[ROW][C]Parameter[/C][C]Value[/C][/ROW]
[ROW][C]alpha[/C][C]0.665932641075839[/C][/ROW]
[ROW][C]beta[/C][C]0.0480086184585807[/C][/ROW]
[ROW][C]gamma[/C][C]1[/C][/ROW]
[/TABLE]
Source: https://freestatistics.org/blog/index.php?pk=295112&T=1

Globally Unique Identifier (entire table): ba.freestatistics.org/blog/index.php?pk=295112&T=1

As an alternative you can also use a QR Code:  

The GUIDs for individual cells are displayed in the table below:

Estimated Parameters of Exponential Smoothing
ParameterValue
alpha0.665932641075839
beta0.0480086184585807
gamma1


Interpolation Forecasts of Exponential Smoothing
tObservedFittedResiduals
1394.5991.9223584401712.66764155982902
1494.6993.97014971943230.719850280567741
1594.6794.54594051893880.124059481061209
1696.5596.573107688862-0.0231076888619981
1797.1497.2606993387979-0.120699338797905
1897.3297.5173593712663-0.197359371266273
1997.9799.7958259735348-1.82582597353478
2098.4998.19313759672130.296862403278695
2199.1197.67517420479721.43482579520283
2299.0998.39630655338710.693693446612883
2398.76100.018155743583-1.25815574358292
2499.299.5862309717144-0.386230971714355
2599.61100.47544000348-0.865440003479563
2699.5499.47474408535010.0652559146498675
2799.6899.34965778550480.330342214495232
28100.75101.405699490959-0.655699490959464
29100.38101.559869024421-1.17986902442057
30100.79100.9721651831-0.182165183100281
31100.39102.60379972708-2.21379972707965
32100.39101.326531319285-0.936531319285166
33100.12100.202598447113-0.0825984471125167
3410099.45235874911880.547641250881227
3599.17100.106946961317-0.936946961317361
3699.1799.9725254656344-0.802525465634432
3799.59100.203431422089-0.613431422088979
3899.9699.46853732545970.491462674540273
3999.6899.51652469874920.163475301250855
40101.03100.9273971117640.102602888236362
41100.99101.231037510628-0.241037510627976
42101.38101.451447915658-0.0714479156583394
43101.84102.331265012211-0.491265012211301
44101.52102.536007783305-1.01600778330518
45101.37101.550104539315-0.180104539315096
46101.22100.8480420445690.371957955430631
47101.45100.7866350501820.663364949818131
48101.99101.7109326052490.279067394750612
49104.05102.7079690498061.34203095019419
50104.61103.68959970.920400300000139
51105.06103.972583588451.08741641154954
52105.4106.066864748823-0.666864748823301
53104.71105.807153911503-1.09715391150311
54104.8105.550593754173-0.750593754172868
55104.83105.852676589419-1.02267658941901
56104.81105.526024425976-0.716024425975775
57104.49105.026517312422-0.536517312422504
58104.59104.2675187131930.322481286806521
59104.5104.2649160962940.235083903706212
60104.61104.756336633257-0.146336633257462

\begin{tabular}{lllllllll}
\hline
Interpolation Forecasts of Exponential Smoothing \tabularnewline
t & Observed & Fitted & Residuals \tabularnewline
13 & 94.59 & 91.922358440171 & 2.66764155982902 \tabularnewline
14 & 94.69 & 93.9701497194323 & 0.719850280567741 \tabularnewline
15 & 94.67 & 94.5459405189388 & 0.124059481061209 \tabularnewline
16 & 96.55 & 96.573107688862 & -0.0231076888619981 \tabularnewline
17 & 97.14 & 97.2606993387979 & -0.120699338797905 \tabularnewline
18 & 97.32 & 97.5173593712663 & -0.197359371266273 \tabularnewline
19 & 97.97 & 99.7958259735348 & -1.82582597353478 \tabularnewline
20 & 98.49 & 98.1931375967213 & 0.296862403278695 \tabularnewline
21 & 99.11 & 97.6751742047972 & 1.43482579520283 \tabularnewline
22 & 99.09 & 98.3963065533871 & 0.693693446612883 \tabularnewline
23 & 98.76 & 100.018155743583 & -1.25815574358292 \tabularnewline
24 & 99.2 & 99.5862309717144 & -0.386230971714355 \tabularnewline
25 & 99.61 & 100.47544000348 & -0.865440003479563 \tabularnewline
26 & 99.54 & 99.4747440853501 & 0.0652559146498675 \tabularnewline
27 & 99.68 & 99.3496577855048 & 0.330342214495232 \tabularnewline
28 & 100.75 & 101.405699490959 & -0.655699490959464 \tabularnewline
29 & 100.38 & 101.559869024421 & -1.17986902442057 \tabularnewline
30 & 100.79 & 100.9721651831 & -0.182165183100281 \tabularnewline
31 & 100.39 & 102.60379972708 & -2.21379972707965 \tabularnewline
32 & 100.39 & 101.326531319285 & -0.936531319285166 \tabularnewline
33 & 100.12 & 100.202598447113 & -0.0825984471125167 \tabularnewline
34 & 100 & 99.4523587491188 & 0.547641250881227 \tabularnewline
35 & 99.17 & 100.106946961317 & -0.936946961317361 \tabularnewline
36 & 99.17 & 99.9725254656344 & -0.802525465634432 \tabularnewline
37 & 99.59 & 100.203431422089 & -0.613431422088979 \tabularnewline
38 & 99.96 & 99.4685373254597 & 0.491462674540273 \tabularnewline
39 & 99.68 & 99.5165246987492 & 0.163475301250855 \tabularnewline
40 & 101.03 & 100.927397111764 & 0.102602888236362 \tabularnewline
41 & 100.99 & 101.231037510628 & -0.241037510627976 \tabularnewline
42 & 101.38 & 101.451447915658 & -0.0714479156583394 \tabularnewline
43 & 101.84 & 102.331265012211 & -0.491265012211301 \tabularnewline
44 & 101.52 & 102.536007783305 & -1.01600778330518 \tabularnewline
45 & 101.37 & 101.550104539315 & -0.180104539315096 \tabularnewline
46 & 101.22 & 100.848042044569 & 0.371957955430631 \tabularnewline
47 & 101.45 & 100.786635050182 & 0.663364949818131 \tabularnewline
48 & 101.99 & 101.710932605249 & 0.279067394750612 \tabularnewline
49 & 104.05 & 102.707969049806 & 1.34203095019419 \tabularnewline
50 & 104.61 & 103.6895997 & 0.920400300000139 \tabularnewline
51 & 105.06 & 103.97258358845 & 1.08741641154954 \tabularnewline
52 & 105.4 & 106.066864748823 & -0.666864748823301 \tabularnewline
53 & 104.71 & 105.807153911503 & -1.09715391150311 \tabularnewline
54 & 104.8 & 105.550593754173 & -0.750593754172868 \tabularnewline
55 & 104.83 & 105.852676589419 & -1.02267658941901 \tabularnewline
56 & 104.81 & 105.526024425976 & -0.716024425975775 \tabularnewline
57 & 104.49 & 105.026517312422 & -0.536517312422504 \tabularnewline
58 & 104.59 & 104.267518713193 & 0.322481286806521 \tabularnewline
59 & 104.5 & 104.264916096294 & 0.235083903706212 \tabularnewline
60 & 104.61 & 104.756336633257 & -0.146336633257462 \tabularnewline
\hline
\end{tabular}
%Source: https://freestatistics.org/blog/index.php?pk=295112&T=2

[TABLE]
[ROW][C]Interpolation Forecasts of Exponential Smoothing[/C][/ROW]
[ROW][C]t[/C][C]Observed[/C][C]Fitted[/C][C]Residuals[/C][/ROW]
[ROW][C]13[/C][C]94.59[/C][C]91.922358440171[/C][C]2.66764155982902[/C][/ROW]
[ROW][C]14[/C][C]94.69[/C][C]93.9701497194323[/C][C]0.719850280567741[/C][/ROW]
[ROW][C]15[/C][C]94.67[/C][C]94.5459405189388[/C][C]0.124059481061209[/C][/ROW]
[ROW][C]16[/C][C]96.55[/C][C]96.573107688862[/C][C]-0.0231076888619981[/C][/ROW]
[ROW][C]17[/C][C]97.14[/C][C]97.2606993387979[/C][C]-0.120699338797905[/C][/ROW]
[ROW][C]18[/C][C]97.32[/C][C]97.5173593712663[/C][C]-0.197359371266273[/C][/ROW]
[ROW][C]19[/C][C]97.97[/C][C]99.7958259735348[/C][C]-1.82582597353478[/C][/ROW]
[ROW][C]20[/C][C]98.49[/C][C]98.1931375967213[/C][C]0.296862403278695[/C][/ROW]
[ROW][C]21[/C][C]99.11[/C][C]97.6751742047972[/C][C]1.43482579520283[/C][/ROW]
[ROW][C]22[/C][C]99.09[/C][C]98.3963065533871[/C][C]0.693693446612883[/C][/ROW]
[ROW][C]23[/C][C]98.76[/C][C]100.018155743583[/C][C]-1.25815574358292[/C][/ROW]
[ROW][C]24[/C][C]99.2[/C][C]99.5862309717144[/C][C]-0.386230971714355[/C][/ROW]
[ROW][C]25[/C][C]99.61[/C][C]100.47544000348[/C][C]-0.865440003479563[/C][/ROW]
[ROW][C]26[/C][C]99.54[/C][C]99.4747440853501[/C][C]0.0652559146498675[/C][/ROW]
[ROW][C]27[/C][C]99.68[/C][C]99.3496577855048[/C][C]0.330342214495232[/C][/ROW]
[ROW][C]28[/C][C]100.75[/C][C]101.405699490959[/C][C]-0.655699490959464[/C][/ROW]
[ROW][C]29[/C][C]100.38[/C][C]101.559869024421[/C][C]-1.17986902442057[/C][/ROW]
[ROW][C]30[/C][C]100.79[/C][C]100.9721651831[/C][C]-0.182165183100281[/C][/ROW]
[ROW][C]31[/C][C]100.39[/C][C]102.60379972708[/C][C]-2.21379972707965[/C][/ROW]
[ROW][C]32[/C][C]100.39[/C][C]101.326531319285[/C][C]-0.936531319285166[/C][/ROW]
[ROW][C]33[/C][C]100.12[/C][C]100.202598447113[/C][C]-0.0825984471125167[/C][/ROW]
[ROW][C]34[/C][C]100[/C][C]99.4523587491188[/C][C]0.547641250881227[/C][/ROW]
[ROW][C]35[/C][C]99.17[/C][C]100.106946961317[/C][C]-0.936946961317361[/C][/ROW]
[ROW][C]36[/C][C]99.17[/C][C]99.9725254656344[/C][C]-0.802525465634432[/C][/ROW]
[ROW][C]37[/C][C]99.59[/C][C]100.203431422089[/C][C]-0.613431422088979[/C][/ROW]
[ROW][C]38[/C][C]99.96[/C][C]99.4685373254597[/C][C]0.491462674540273[/C][/ROW]
[ROW][C]39[/C][C]99.68[/C][C]99.5165246987492[/C][C]0.163475301250855[/C][/ROW]
[ROW][C]40[/C][C]101.03[/C][C]100.927397111764[/C][C]0.102602888236362[/C][/ROW]
[ROW][C]41[/C][C]100.99[/C][C]101.231037510628[/C][C]-0.241037510627976[/C][/ROW]
[ROW][C]42[/C][C]101.38[/C][C]101.451447915658[/C][C]-0.0714479156583394[/C][/ROW]
[ROW][C]43[/C][C]101.84[/C][C]102.331265012211[/C][C]-0.491265012211301[/C][/ROW]
[ROW][C]44[/C][C]101.52[/C][C]102.536007783305[/C][C]-1.01600778330518[/C][/ROW]
[ROW][C]45[/C][C]101.37[/C][C]101.550104539315[/C][C]-0.180104539315096[/C][/ROW]
[ROW][C]46[/C][C]101.22[/C][C]100.848042044569[/C][C]0.371957955430631[/C][/ROW]
[ROW][C]47[/C][C]101.45[/C][C]100.786635050182[/C][C]0.663364949818131[/C][/ROW]
[ROW][C]48[/C][C]101.99[/C][C]101.710932605249[/C][C]0.279067394750612[/C][/ROW]
[ROW][C]49[/C][C]104.05[/C][C]102.707969049806[/C][C]1.34203095019419[/C][/ROW]
[ROW][C]50[/C][C]104.61[/C][C]103.6895997[/C][C]0.920400300000139[/C][/ROW]
[ROW][C]51[/C][C]105.06[/C][C]103.97258358845[/C][C]1.08741641154954[/C][/ROW]
[ROW][C]52[/C][C]105.4[/C][C]106.066864748823[/C][C]-0.666864748823301[/C][/ROW]
[ROW][C]53[/C][C]104.71[/C][C]105.807153911503[/C][C]-1.09715391150311[/C][/ROW]
[ROW][C]54[/C][C]104.8[/C][C]105.550593754173[/C][C]-0.750593754172868[/C][/ROW]
[ROW][C]55[/C][C]104.83[/C][C]105.852676589419[/C][C]-1.02267658941901[/C][/ROW]
[ROW][C]56[/C][C]104.81[/C][C]105.526024425976[/C][C]-0.716024425975775[/C][/ROW]
[ROW][C]57[/C][C]104.49[/C][C]105.026517312422[/C][C]-0.536517312422504[/C][/ROW]
[ROW][C]58[/C][C]104.59[/C][C]104.267518713193[/C][C]0.322481286806521[/C][/ROW]
[ROW][C]59[/C][C]104.5[/C][C]104.264916096294[/C][C]0.235083903706212[/C][/ROW]
[ROW][C]60[/C][C]104.61[/C][C]104.756336633257[/C][C]-0.146336633257462[/C][/ROW]
[/TABLE]
Source: https://freestatistics.org/blog/index.php?pk=295112&T=2

Globally Unique Identifier (entire table): ba.freestatistics.org/blog/index.php?pk=295112&T=2

As an alternative you can also use a QR Code:  

The GUIDs for individual cells are displayed in the table below:

Interpolation Forecasts of Exponential Smoothing
tObservedFittedResiduals
1394.5991.9223584401712.66764155982902
1494.6993.97014971943230.719850280567741
1594.6794.54594051893880.124059481061209
1696.5596.573107688862-0.0231076888619981
1797.1497.2606993387979-0.120699338797905
1897.3297.5173593712663-0.197359371266273
1997.9799.7958259735348-1.82582597353478
2098.4998.19313759672130.296862403278695
2199.1197.67517420479721.43482579520283
2299.0998.39630655338710.693693446612883
2398.76100.018155743583-1.25815574358292
2499.299.5862309717144-0.386230971714355
2599.61100.47544000348-0.865440003479563
2699.5499.47474408535010.0652559146498675
2799.6899.34965778550480.330342214495232
28100.75101.405699490959-0.655699490959464
29100.38101.559869024421-1.17986902442057
30100.79100.9721651831-0.182165183100281
31100.39102.60379972708-2.21379972707965
32100.39101.326531319285-0.936531319285166
33100.12100.202598447113-0.0825984471125167
3410099.45235874911880.547641250881227
3599.17100.106946961317-0.936946961317361
3699.1799.9725254656344-0.802525465634432
3799.59100.203431422089-0.613431422088979
3899.9699.46853732545970.491462674540273
3999.6899.51652469874920.163475301250855
40101.03100.9273971117640.102602888236362
41100.99101.231037510628-0.241037510627976
42101.38101.451447915658-0.0714479156583394
43101.84102.331265012211-0.491265012211301
44101.52102.536007783305-1.01600778330518
45101.37101.550104539315-0.180104539315096
46101.22100.8480420445690.371957955430631
47101.45100.7866350501820.663364949818131
48101.99101.7109326052490.279067394750612
49104.05102.7079690498061.34203095019419
50104.61103.68959970.920400300000139
51105.06103.972583588451.08741641154954
52105.4106.066864748823-0.666864748823301
53104.71105.807153911503-1.09715391150311
54104.8105.550593754173-0.750593754172868
55104.83105.852676589419-1.02267658941901
56104.81105.526024425976-0.716024425975775
57104.49105.026517312422-0.536517312422504
58104.59104.2675187131930.322481286806521
59104.5104.2649160962940.235083903706212
60104.61104.756336633257-0.146336633257462


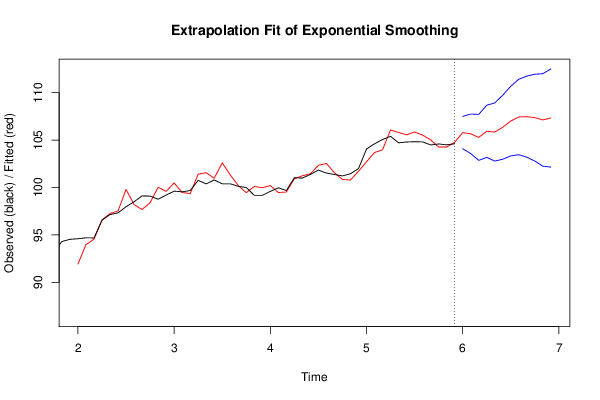
Extrapolation Forecasts of Exponential Smoothing
tForecast95% Lower Bound95% Upper Bound
61105.792294274771104.085782978754107.498805570787
62105.663574460739103.582561913697107.74458700778
63105.284207503049102.858928711142107.709486294956
64105.928308378674103.176540591733108.680076165615
65105.850272856338102.783138594118108.917407118559
66106.356528178944102.981148161314109.731908196574
67107.007969204801103.328864401555110.687074008046
68107.437896033689103.457804149164111.417987918214
69107.471174879624103.191560272136111.750789487112
70107.369571249695102.790960690958111.948181808432
71107.125858499976102.248071609761112.00364539019
72107.328630384423102.150943136319112.506317632526

\begin{tabular}{lllllllll}
\hline
Extrapolation Forecasts of Exponential Smoothing \tabularnewline
t & Forecast & 95% Lower Bound & 95% Upper Bound \tabularnewline
61 & 105.792294274771 & 104.085782978754 & 107.498805570787 \tabularnewline
62 & 105.663574460739 & 103.582561913697 & 107.74458700778 \tabularnewline
63 & 105.284207503049 & 102.858928711142 & 107.709486294956 \tabularnewline
64 & 105.928308378674 & 103.176540591733 & 108.680076165615 \tabularnewline
65 & 105.850272856338 & 102.783138594118 & 108.917407118559 \tabularnewline
66 & 106.356528178944 & 102.981148161314 & 109.731908196574 \tabularnewline
67 & 107.007969204801 & 103.328864401555 & 110.687074008046 \tabularnewline
68 & 107.437896033689 & 103.457804149164 & 111.417987918214 \tabularnewline
69 & 107.471174879624 & 103.191560272136 & 111.750789487112 \tabularnewline
70 & 107.369571249695 & 102.790960690958 & 111.948181808432 \tabularnewline
71 & 107.125858499976 & 102.248071609761 & 112.00364539019 \tabularnewline
72 & 107.328630384423 & 102.150943136319 & 112.506317632526 \tabularnewline
\hline
\end{tabular}
%Source: https://freestatistics.org/blog/index.php?pk=295112&T=3

[TABLE]
[ROW][C]Extrapolation Forecasts of Exponential Smoothing[/C][/ROW]
[ROW][C]t[/C][C]Forecast[/C][C]95% Lower Bound[/C][C]95% Upper Bound[/C][/ROW]
[ROW][C]61[/C][C]105.792294274771[/C][C]104.085782978754[/C][C]107.498805570787[/C][/ROW]
[ROW][C]62[/C][C]105.663574460739[/C][C]103.582561913697[/C][C]107.74458700778[/C][/ROW]
[ROW][C]63[/C][C]105.284207503049[/C][C]102.858928711142[/C][C]107.709486294956[/C][/ROW]
[ROW][C]64[/C][C]105.928308378674[/C][C]103.176540591733[/C][C]108.680076165615[/C][/ROW]
[ROW][C]65[/C][C]105.850272856338[/C][C]102.783138594118[/C][C]108.917407118559[/C][/ROW]
[ROW][C]66[/C][C]106.356528178944[/C][C]102.981148161314[/C][C]109.731908196574[/C][/ROW]
[ROW][C]67[/C][C]107.007969204801[/C][C]103.328864401555[/C][C]110.687074008046[/C][/ROW]
[ROW][C]68[/C][C]107.437896033689[/C][C]103.457804149164[/C][C]111.417987918214[/C][/ROW]
[ROW][C]69[/C][C]107.471174879624[/C][C]103.191560272136[/C][C]111.750789487112[/C][/ROW]
[ROW][C]70[/C][C]107.369571249695[/C][C]102.790960690958[/C][C]111.948181808432[/C][/ROW]
[ROW][C]71[/C][C]107.125858499976[/C][C]102.248071609761[/C][C]112.00364539019[/C][/ROW]
[ROW][C]72[/C][C]107.328630384423[/C][C]102.150943136319[/C][C]112.506317632526[/C][/ROW]
[/TABLE]
Source: https://freestatistics.org/blog/index.php?pk=295112&T=3

Globally Unique Identifier (entire table): ba.freestatistics.org/blog/index.php?pk=295112&T=3

As an alternative you can also use a QR Code:  

The GUIDs for individual cells are displayed in the table below:

Extrapolation Forecasts of Exponential Smoothing
tForecast95% Lower Bound95% Upper Bound
61105.792294274771104.085782978754107.498805570787
62105.663574460739103.582561913697107.74458700778
63105.284207503049102.858928711142107.709486294956
64105.928308378674103.176540591733108.680076165615
65105.850272856338102.783138594118108.917407118559
66106.356528178944102.981148161314109.731908196574
67107.007969204801103.328864401555110.687074008046
68107.437896033689103.457804149164111.417987918214
69107.471174879624103.191560272136111.750789487112
70107.369571249695102.790960690958111.948181808432
71107.125858499976102.248071609761112.00364539019
72107.328630384423102.150943136319112.506317632526


Parameters (Session):
par1 = 12 ; par2 = Triple ; par3 = additive ;
Parameters (R input):
par1 = 12 ; par2 = Triple ; par3 = additive ;
R code (references can be found in the software module):
par1 <- as.numeric(par1)
if (par2 == 'Single') K <- 1
if (par2 == 'Double') K <- 2
if (par2 == 'Triple') K <- par1
nx <- length(x)
nxmK <- nx - K
x <- ts(x, frequency = par1)
if (par2 == 'Single') fit <- HoltWinters(x, gamma=F, beta=F)
if (par2 == 'Double') fit <- HoltWinters(x, gamma=F)
if (par2 == 'Triple') fit <- HoltWinters(x, seasonal=par3)
fit
myresid <- x - fit$fitted[,'xhat']
bitmap(file='test1.png')
op <- par(mfrow=c(2,1))
plot(fit,ylab='Observed (black) / Fitted (red)',main='Interpolation Fit of Exponential Smoothing')
plot(myresid,ylab='Residuals',main='Interpolation Prediction Errors')
par(op)
dev.off()
bitmap(file='test2.png')
p <- predict(fit, par1, prediction.interval=TRUE)
np <- length(p[,1])
plot(fit,p,ylab='Observed (black) / Fitted (red)',main='Extrapolation Fit of Exponential Smoothing')
dev.off()
bitmap(file='test3.png')
op <- par(mfrow = c(2,2))
acf(as.numeric(myresid),lag.max = nx/2,main='Residual ACF')
spectrum(myresid,main='Residals Periodogram')
cpgram(myresid,main='Residal Cumulative Periodogram')
qqnorm(myresid,main='Residual Normal QQ Plot')
qqline(myresid)
par(op)
dev.off()
load(file='createtable')
a<-table.start()
a<-table.row.start(a)
a<-table.element(a,'Estimated Parameters of Exponential Smoothing',2,TRUE)
a<-table.row.end(a)
a<-table.row.start(a)
a<-table.element(a,'Parameter',header=TRUE)
a<-table.element(a,'Value',header=TRUE)
a<-table.row.end(a)
a<-table.row.start(a)
a<-table.element(a,'alpha',header=TRUE)
a<-table.element(a,fit$alpha)
a<-table.row.end(a)
a<-table.row.start(a)
a<-table.element(a,'beta',header=TRUE)
a<-table.element(a,fit$beta)
a<-table.row.end(a)
a<-table.row.start(a)
a<-table.element(a,'gamma',header=TRUE)
a<-table.element(a,fit$gamma)
a<-table.row.end(a)
a<-table.end(a)
table.save(a,file='mytable.tab')
a<-table.start()
a<-table.row.start(a)
a<-table.element(a,'Interpolation Forecasts of Exponential Smoothing',4,TRUE)
a<-table.row.end(a)
a<-table.row.start(a)
a<-table.element(a,'t',header=TRUE)
a<-table.element(a,'Observed',header=TRUE)
a<-table.element(a,'Fitted',header=TRUE)
a<-table.element(a,'Residuals',header=TRUE)
a<-table.row.end(a)
for (i in 1:nxmK) {
a<-table.row.start(a)
a<-table.element(a,i+K,header=TRUE)
a<-table.element(a,x[i+K])
a<-table.element(a,fit$fitted[i,'xhat'])
a<-table.element(a,myresid[i])
a<-table.row.end(a)
}
a<-table.end(a)
table.save(a,file='mytable1.tab')
a<-table.start()
a<-table.row.start(a)
a<-table.element(a,'Extrapolation Forecasts of Exponential Smoothing',4,TRUE)
a<-table.row.end(a)
a<-table.row.start(a)
a<-table.element(a,'t',header=TRUE)
a<-table.element(a,'Forecast',header=TRUE)
a<-table.element(a,'95% Lower Bound',header=TRUE)
a<-table.element(a,'95% Upper Bound',header=TRUE)
a<-table.row.end(a)
for (i in 1:np) {
a<-table.row.start(a)
a<-table.element(a,nx+i,header=TRUE)
a<-table.element(a,p[i,'fit'])
a<-table.element(a,p[i,'lwr'])
a<-table.element(a,p[i,'upr'])
a<-table.row.end(a)
}
a<-table.end(a)
table.save(a,file='mytable2.tab')