Free Statistics

of Irreproducible Research!

Author's title

Author*Unverified author*
R Software Modulerwasp_autocorrelation.wasp
Title produced by software(Partial) Autocorrelation Function
Date of computationTue, 03 May 2016 10:22:59 +0100
Cite this page as followsStatistical Computations at FreeStatistics.org, Office for Research Development and Education, URL https://freestatistics.org/blog/index.php?v=date/2016/May/03/t1462267408xumktriboy6lmvd.htm/, Retrieved Mon, 29 Apr 2024 03:15:32 +0000
Statistical Computations at FreeStatistics.org, Office for Research Development and Education, URL https://freestatistics.org/blog/index.php?pk=295204, Retrieved Mon, 29 Apr 2024 03:15:32 +0000
QR Codes:

Original text written by user:
IsPrivate?No (this computation is public)
User-defined keywords
Estimated Impact100
Family? (F = Feedback message, R = changed R code, M = changed R Module, P = changed Parameters, D = changed Data)
-       [(Partial) Autocorrelation Function] [] [2016-05-03 09:22:59] [517bf63cbd197750110a40d4d2cd39d6] [Current]
Feedback Forum

Post a new message
Dataseries X:
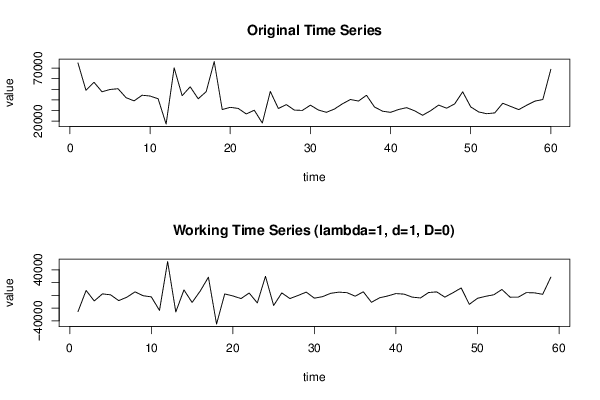
74787
49019
56601
47637
49806
50499
42092
39062
44382
43635
41082
17244
70170
43949
52333
41032
47758
76116
30917
32996
31951
26775
30268
18214
47957
31901
35559
30408
30083
35043
30475
28309
31394
36313
40357
38918
44368
33298
29366
28282
30943
32699
29764
25524
29807
35112
32192
36214
47639
33421
28642
26996
27757
36839
33821
30839
35032
38821
40347
68799


Summary of computational transaction
Raw Inputview raw input (R code)
Raw Outputview raw output of R engine
Computing time2 seconds
R Server'Sir Maurice George Kendall' @ kendall.wessa.net

\begin{tabular}{lllllllll}
\hline
Summary of computational transaction \tabularnewline
Raw Input & view raw input (R code)  \tabularnewline
Raw Output & view raw output of R engine  \tabularnewline
Computing time & 2 seconds \tabularnewline
R Server & 'Sir Maurice George Kendall' @ kendall.wessa.net \tabularnewline
\hline
\end{tabular}
%Source: https://freestatistics.org/blog/index.php?pk=295204&T=0

[TABLE]
[ROW][C]Summary of computational transaction[/C][/ROW]
[ROW][C]Raw Input[/C][C]view raw input (R code) [/C][/ROW]
[ROW][C]Raw Output[/C][C]view raw output of R engine [/C][/ROW]
[ROW][C]Computing time[/C][C]2 seconds[/C][/ROW]
[ROW][C]R Server[/C][C]'Sir Maurice George Kendall' @ kendall.wessa.net[/C][/ROW]
[/TABLE]
Source: https://freestatistics.org/blog/index.php?pk=295204&T=0

Globally Unique Identifier (entire table): ba.freestatistics.org/blog/index.php?pk=295204&T=0

As an alternative you can also use a QR Code:  

The GUIDs for individual cells are displayed in the table below:

Summary of computational transaction
Raw Inputview raw input (R code)
Raw Outputview raw output of R engine
Computing time2 seconds
R Server'Sir Maurice George Kendall' @ kendall.wessa.net


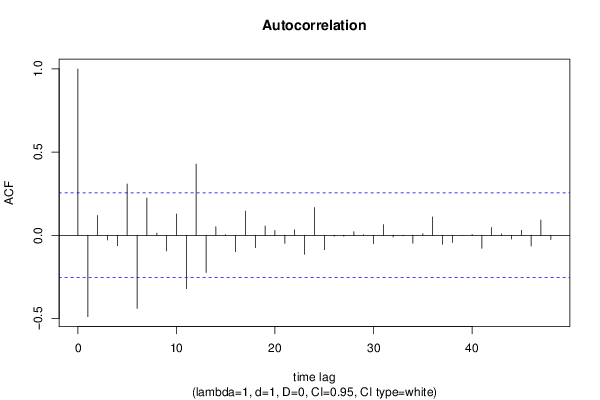
Autocorrelation Function
Time lag kACF(k)T-STATP-value
1-0.489099-3.75680.000198
20.1191820.91550.181839
3-0.028746-0.22080.413005
4-0.062025-0.47640.317767
50.3084972.36960.010548
6-0.439377-3.37490.000655
70.2238211.71920.045411
80.0133060.10220.459469
9-0.093753-0.72010.237145
100.1281360.98420.16451
11-0.320651-2.4630.008358
120.4279153.28690.000855
13-0.223366-1.71570.045731
140.0517140.39720.34632
150.0038640.02970.48821
16-0.098336-0.75530.226528
170.1453011.11610.134457
18-0.074204-0.570.285431
190.055360.42520.336108
200.028790.22110.412875
21-0.048885-0.37550.354321
220.0327130.25130.401239
23-0.114314-0.87810.191736
240.1663851.2780.103123
25-0.086178-0.66190.255293
26-0.005081-0.0390.484499
27-0.006311-0.04850.480752
280.0218070.16750.433773
290.0029850.02290.490892
30-0.050029-0.38430.351077
310.0643610.49440.311443
32-0.010549-0.0810.467847
33-0.002301-0.01770.492979
34-0.04784-0.36750.357293
350.0089630.06880.472672
360.1100680.84540.200639
37-0.054145-0.41590.339497
38-0.043139-0.33140.370775
39-0.000329-0.00250.498995
400.004930.03790.484962
41-0.07824-0.6010.27508
420.0473960.36410.35856
430.0077360.05940.476409
44-0.021957-0.16870.433323
450.0305020.23430.407785
46-0.064225-0.49330.311808
470.0911740.70030.243241
48-0.025082-0.19270.423944

\begin{tabular}{lllllllll}
\hline
Autocorrelation Function \tabularnewline
Time lag k & ACF(k) & T-STAT & P-value \tabularnewline
1 & -0.489099 & -3.7568 & 0.000198 \tabularnewline
2 & 0.119182 & 0.9155 & 0.181839 \tabularnewline
3 & -0.028746 & -0.2208 & 0.413005 \tabularnewline
4 & -0.062025 & -0.4764 & 0.317767 \tabularnewline
5 & 0.308497 & 2.3696 & 0.010548 \tabularnewline
6 & -0.439377 & -3.3749 & 0.000655 \tabularnewline
7 & 0.223821 & 1.7192 & 0.045411 \tabularnewline
8 & 0.013306 & 0.1022 & 0.459469 \tabularnewline
9 & -0.093753 & -0.7201 & 0.237145 \tabularnewline
10 & 0.128136 & 0.9842 & 0.16451 \tabularnewline
11 & -0.320651 & -2.463 & 0.008358 \tabularnewline
12 & 0.427915 & 3.2869 & 0.000855 \tabularnewline
13 & -0.223366 & -1.7157 & 0.045731 \tabularnewline
14 & 0.051714 & 0.3972 & 0.34632 \tabularnewline
15 & 0.003864 & 0.0297 & 0.48821 \tabularnewline
16 & -0.098336 & -0.7553 & 0.226528 \tabularnewline
17 & 0.145301 & 1.1161 & 0.134457 \tabularnewline
18 & -0.074204 & -0.57 & 0.285431 \tabularnewline
19 & 0.05536 & 0.4252 & 0.336108 \tabularnewline
20 & 0.02879 & 0.2211 & 0.412875 \tabularnewline
21 & -0.048885 & -0.3755 & 0.354321 \tabularnewline
22 & 0.032713 & 0.2513 & 0.401239 \tabularnewline
23 & -0.114314 & -0.8781 & 0.191736 \tabularnewline
24 & 0.166385 & 1.278 & 0.103123 \tabularnewline
25 & -0.086178 & -0.6619 & 0.255293 \tabularnewline
26 & -0.005081 & -0.039 & 0.484499 \tabularnewline
27 & -0.006311 & -0.0485 & 0.480752 \tabularnewline
28 & 0.021807 & 0.1675 & 0.433773 \tabularnewline
29 & 0.002985 & 0.0229 & 0.490892 \tabularnewline
30 & -0.050029 & -0.3843 & 0.351077 \tabularnewline
31 & 0.064361 & 0.4944 & 0.311443 \tabularnewline
32 & -0.010549 & -0.081 & 0.467847 \tabularnewline
33 & -0.002301 & -0.0177 & 0.492979 \tabularnewline
34 & -0.04784 & -0.3675 & 0.357293 \tabularnewline
35 & 0.008963 & 0.0688 & 0.472672 \tabularnewline
36 & 0.110068 & 0.8454 & 0.200639 \tabularnewline
37 & -0.054145 & -0.4159 & 0.339497 \tabularnewline
38 & -0.043139 & -0.3314 & 0.370775 \tabularnewline
39 & -0.000329 & -0.0025 & 0.498995 \tabularnewline
40 & 0.00493 & 0.0379 & 0.484962 \tabularnewline
41 & -0.07824 & -0.601 & 0.27508 \tabularnewline
42 & 0.047396 & 0.3641 & 0.35856 \tabularnewline
43 & 0.007736 & 0.0594 & 0.476409 \tabularnewline
44 & -0.021957 & -0.1687 & 0.433323 \tabularnewline
45 & 0.030502 & 0.2343 & 0.407785 \tabularnewline
46 & -0.064225 & -0.4933 & 0.311808 \tabularnewline
47 & 0.091174 & 0.7003 & 0.243241 \tabularnewline
48 & -0.025082 & -0.1927 & 0.423944 \tabularnewline
\hline
\end{tabular}
%Source: https://freestatistics.org/blog/index.php?pk=295204&T=1

[TABLE]
[ROW][C]Autocorrelation Function[/C][/ROW]
[ROW][C]Time lag k[/C][C]ACF(k)[/C][C]T-STAT[/C][C]P-value[/C][/ROW]
[ROW][C]1[/C][C]-0.489099[/C][C]-3.7568[/C][C]0.000198[/C][/ROW]
[ROW][C]2[/C][C]0.119182[/C][C]0.9155[/C][C]0.181839[/C][/ROW]
[ROW][C]3[/C][C]-0.028746[/C][C]-0.2208[/C][C]0.413005[/C][/ROW]
[ROW][C]4[/C][C]-0.062025[/C][C]-0.4764[/C][C]0.317767[/C][/ROW]
[ROW][C]5[/C][C]0.308497[/C][C]2.3696[/C][C]0.010548[/C][/ROW]
[ROW][C]6[/C][C]-0.439377[/C][C]-3.3749[/C][C]0.000655[/C][/ROW]
[ROW][C]7[/C][C]0.223821[/C][C]1.7192[/C][C]0.045411[/C][/ROW]
[ROW][C]8[/C][C]0.013306[/C][C]0.1022[/C][C]0.459469[/C][/ROW]
[ROW][C]9[/C][C]-0.093753[/C][C]-0.7201[/C][C]0.237145[/C][/ROW]
[ROW][C]10[/C][C]0.128136[/C][C]0.9842[/C][C]0.16451[/C][/ROW]
[ROW][C]11[/C][C]-0.320651[/C][C]-2.463[/C][C]0.008358[/C][/ROW]
[ROW][C]12[/C][C]0.427915[/C][C]3.2869[/C][C]0.000855[/C][/ROW]
[ROW][C]13[/C][C]-0.223366[/C][C]-1.7157[/C][C]0.045731[/C][/ROW]
[ROW][C]14[/C][C]0.051714[/C][C]0.3972[/C][C]0.34632[/C][/ROW]
[ROW][C]15[/C][C]0.003864[/C][C]0.0297[/C][C]0.48821[/C][/ROW]
[ROW][C]16[/C][C]-0.098336[/C][C]-0.7553[/C][C]0.226528[/C][/ROW]
[ROW][C]17[/C][C]0.145301[/C][C]1.1161[/C][C]0.134457[/C][/ROW]
[ROW][C]18[/C][C]-0.074204[/C][C]-0.57[/C][C]0.285431[/C][/ROW]
[ROW][C]19[/C][C]0.05536[/C][C]0.4252[/C][C]0.336108[/C][/ROW]
[ROW][C]20[/C][C]0.02879[/C][C]0.2211[/C][C]0.412875[/C][/ROW]
[ROW][C]21[/C][C]-0.048885[/C][C]-0.3755[/C][C]0.354321[/C][/ROW]
[ROW][C]22[/C][C]0.032713[/C][C]0.2513[/C][C]0.401239[/C][/ROW]
[ROW][C]23[/C][C]-0.114314[/C][C]-0.8781[/C][C]0.191736[/C][/ROW]
[ROW][C]24[/C][C]0.166385[/C][C]1.278[/C][C]0.103123[/C][/ROW]
[ROW][C]25[/C][C]-0.086178[/C][C]-0.6619[/C][C]0.255293[/C][/ROW]
[ROW][C]26[/C][C]-0.005081[/C][C]-0.039[/C][C]0.484499[/C][/ROW]
[ROW][C]27[/C][C]-0.006311[/C][C]-0.0485[/C][C]0.480752[/C][/ROW]
[ROW][C]28[/C][C]0.021807[/C][C]0.1675[/C][C]0.433773[/C][/ROW]
[ROW][C]29[/C][C]0.002985[/C][C]0.0229[/C][C]0.490892[/C][/ROW]
[ROW][C]30[/C][C]-0.050029[/C][C]-0.3843[/C][C]0.351077[/C][/ROW]
[ROW][C]31[/C][C]0.064361[/C][C]0.4944[/C][C]0.311443[/C][/ROW]
[ROW][C]32[/C][C]-0.010549[/C][C]-0.081[/C][C]0.467847[/C][/ROW]
[ROW][C]33[/C][C]-0.002301[/C][C]-0.0177[/C][C]0.492979[/C][/ROW]
[ROW][C]34[/C][C]-0.04784[/C][C]-0.3675[/C][C]0.357293[/C][/ROW]
[ROW][C]35[/C][C]0.008963[/C][C]0.0688[/C][C]0.472672[/C][/ROW]
[ROW][C]36[/C][C]0.110068[/C][C]0.8454[/C][C]0.200639[/C][/ROW]
[ROW][C]37[/C][C]-0.054145[/C][C]-0.4159[/C][C]0.339497[/C][/ROW]
[ROW][C]38[/C][C]-0.043139[/C][C]-0.3314[/C][C]0.370775[/C][/ROW]
[ROW][C]39[/C][C]-0.000329[/C][C]-0.0025[/C][C]0.498995[/C][/ROW]
[ROW][C]40[/C][C]0.00493[/C][C]0.0379[/C][C]0.484962[/C][/ROW]
[ROW][C]41[/C][C]-0.07824[/C][C]-0.601[/C][C]0.27508[/C][/ROW]
[ROW][C]42[/C][C]0.047396[/C][C]0.3641[/C][C]0.35856[/C][/ROW]
[ROW][C]43[/C][C]0.007736[/C][C]0.0594[/C][C]0.476409[/C][/ROW]
[ROW][C]44[/C][C]-0.021957[/C][C]-0.1687[/C][C]0.433323[/C][/ROW]
[ROW][C]45[/C][C]0.030502[/C][C]0.2343[/C][C]0.407785[/C][/ROW]
[ROW][C]46[/C][C]-0.064225[/C][C]-0.4933[/C][C]0.311808[/C][/ROW]
[ROW][C]47[/C][C]0.091174[/C][C]0.7003[/C][C]0.243241[/C][/ROW]
[ROW][C]48[/C][C]-0.025082[/C][C]-0.1927[/C][C]0.423944[/C][/ROW]
[/TABLE]
Source: https://freestatistics.org/blog/index.php?pk=295204&T=1

Globally Unique Identifier (entire table): ba.freestatistics.org/blog/index.php?pk=295204&T=1

As an alternative you can also use a QR Code:  

The GUIDs for individual cells are displayed in the table below:

Autocorrelation Function
Time lag kACF(k)T-STATP-value
1-0.489099-3.75680.000198
20.1191820.91550.181839
3-0.028746-0.22080.413005
4-0.062025-0.47640.317767
50.3084972.36960.010548
6-0.439377-3.37490.000655
70.2238211.71920.045411
80.0133060.10220.459469
9-0.093753-0.72010.237145
100.1281360.98420.16451
11-0.320651-2.4630.008358
120.4279153.28690.000855
13-0.223366-1.71570.045731
140.0517140.39720.34632
150.0038640.02970.48821
16-0.098336-0.75530.226528
170.1453011.11610.134457
18-0.074204-0.570.285431
190.055360.42520.336108
200.028790.22110.412875
21-0.048885-0.37550.354321
220.0327130.25130.401239
23-0.114314-0.87810.191736
240.1663851.2780.103123
25-0.086178-0.66190.255293
26-0.005081-0.0390.484499
27-0.006311-0.04850.480752
280.0218070.16750.433773
290.0029850.02290.490892
30-0.050029-0.38430.351077
310.0643610.49440.311443
32-0.010549-0.0810.467847
33-0.002301-0.01770.492979
34-0.04784-0.36750.357293
350.0089630.06880.472672
360.1100680.84540.200639
37-0.054145-0.41590.339497
38-0.043139-0.33140.370775
39-0.000329-0.00250.498995
400.004930.03790.484962
41-0.07824-0.6010.27508
420.0473960.36410.35856
430.0077360.05940.476409
44-0.021957-0.16870.433323
450.0305020.23430.407785
46-0.064225-0.49330.311808
470.0911740.70030.243241
48-0.025082-0.19270.423944


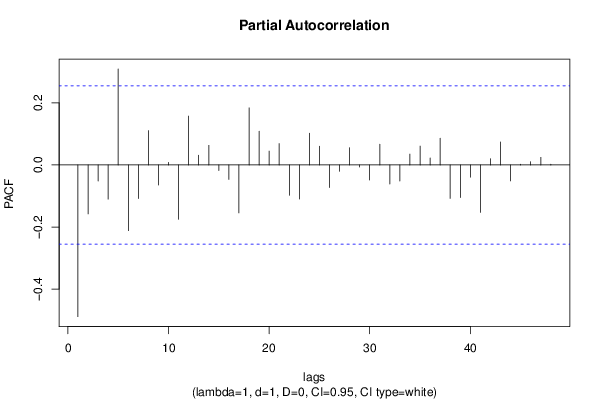
Partial Autocorrelation Function
Time lag kPACF(k)T-STATP-value
1-0.489099-3.75680.000198
2-0.157778-1.21190.115187
3-0.051798-0.39790.346083
4-0.110253-0.84690.200244
50.3096882.37880.010313
6-0.211685-1.6260.054642
7-0.108155-0.83080.204732
80.110890.85180.198895
9-0.064669-0.49670.310612
100.0083370.0640.474579
11-0.174951-1.34380.092075
120.1576751.21110.115339
130.0314080.24120.4051
140.0631930.48540.314597
15-0.018035-0.13850.445147
16-0.046425-0.35660.361334
17-0.154401-1.1860.120193
180.1843111.41570.081057
190.1086130.83430.203746
200.0446910.34330.366306
210.0690280.53020.298978
22-0.097815-0.75130.22772
23-0.109879-0.8440.201041
240.1023190.78590.217528
250.0601780.46220.322805
26-0.072471-0.55670.289933
27-0.020179-0.1550.438676
280.0554520.42590.335852
29-0.006686-0.05140.479607
30-0.048436-0.3720.355598
310.0670650.51510.304191
32-0.061093-0.46930.320305
33-0.051821-0.3980.346017
340.0351410.26990.394081
350.0608940.46770.320849
360.0223870.1720.432029
370.0860.66060.255728
38-0.107746-0.82760.205613
39-0.105107-0.80730.211357
40-0.039233-0.30140.382101
41-0.152734-1.17320.122721
420.0200860.15430.438956
430.0742930.57070.285201
44-0.051331-0.39430.347398
450.0026220.02010.491999
460.0103750.07970.468377
470.0246910.18970.425116
480.0025860.01990.492109

\begin{tabular}{lllllllll}
\hline
Partial Autocorrelation Function \tabularnewline
Time lag k & PACF(k) & T-STAT & P-value \tabularnewline
1 & -0.489099 & -3.7568 & 0.000198 \tabularnewline
2 & -0.157778 & -1.2119 & 0.115187 \tabularnewline
3 & -0.051798 & -0.3979 & 0.346083 \tabularnewline
4 & -0.110253 & -0.8469 & 0.200244 \tabularnewline
5 & 0.309688 & 2.3788 & 0.010313 \tabularnewline
6 & -0.211685 & -1.626 & 0.054642 \tabularnewline
7 & -0.108155 & -0.8308 & 0.204732 \tabularnewline
8 & 0.11089 & 0.8518 & 0.198895 \tabularnewline
9 & -0.064669 & -0.4967 & 0.310612 \tabularnewline
10 & 0.008337 & 0.064 & 0.474579 \tabularnewline
11 & -0.174951 & -1.3438 & 0.092075 \tabularnewline
12 & 0.157675 & 1.2111 & 0.115339 \tabularnewline
13 & 0.031408 & 0.2412 & 0.4051 \tabularnewline
14 & 0.063193 & 0.4854 & 0.314597 \tabularnewline
15 & -0.018035 & -0.1385 & 0.445147 \tabularnewline
16 & -0.046425 & -0.3566 & 0.361334 \tabularnewline
17 & -0.154401 & -1.186 & 0.120193 \tabularnewline
18 & 0.184311 & 1.4157 & 0.081057 \tabularnewline
19 & 0.108613 & 0.8343 & 0.203746 \tabularnewline
20 & 0.044691 & 0.3433 & 0.366306 \tabularnewline
21 & 0.069028 & 0.5302 & 0.298978 \tabularnewline
22 & -0.097815 & -0.7513 & 0.22772 \tabularnewline
23 & -0.109879 & -0.844 & 0.201041 \tabularnewline
24 & 0.102319 & 0.7859 & 0.217528 \tabularnewline
25 & 0.060178 & 0.4622 & 0.322805 \tabularnewline
26 & -0.072471 & -0.5567 & 0.289933 \tabularnewline
27 & -0.020179 & -0.155 & 0.438676 \tabularnewline
28 & 0.055452 & 0.4259 & 0.335852 \tabularnewline
29 & -0.006686 & -0.0514 & 0.479607 \tabularnewline
30 & -0.048436 & -0.372 & 0.355598 \tabularnewline
31 & 0.067065 & 0.5151 & 0.304191 \tabularnewline
32 & -0.061093 & -0.4693 & 0.320305 \tabularnewline
33 & -0.051821 & -0.398 & 0.346017 \tabularnewline
34 & 0.035141 & 0.2699 & 0.394081 \tabularnewline
35 & 0.060894 & 0.4677 & 0.320849 \tabularnewline
36 & 0.022387 & 0.172 & 0.432029 \tabularnewline
37 & 0.086 & 0.6606 & 0.255728 \tabularnewline
38 & -0.107746 & -0.8276 & 0.205613 \tabularnewline
39 & -0.105107 & -0.8073 & 0.211357 \tabularnewline
40 & -0.039233 & -0.3014 & 0.382101 \tabularnewline
41 & -0.152734 & -1.1732 & 0.122721 \tabularnewline
42 & 0.020086 & 0.1543 & 0.438956 \tabularnewline
43 & 0.074293 & 0.5707 & 0.285201 \tabularnewline
44 & -0.051331 & -0.3943 & 0.347398 \tabularnewline
45 & 0.002622 & 0.0201 & 0.491999 \tabularnewline
46 & 0.010375 & 0.0797 & 0.468377 \tabularnewline
47 & 0.024691 & 0.1897 & 0.425116 \tabularnewline
48 & 0.002586 & 0.0199 & 0.492109 \tabularnewline
\hline
\end{tabular}
%Source: https://freestatistics.org/blog/index.php?pk=295204&T=2

[TABLE]
[ROW][C]Partial Autocorrelation Function[/C][/ROW]
[ROW][C]Time lag k[/C][C]PACF(k)[/C][C]T-STAT[/C][C]P-value[/C][/ROW]
[ROW][C]1[/C][C]-0.489099[/C][C]-3.7568[/C][C]0.000198[/C][/ROW]
[ROW][C]2[/C][C]-0.157778[/C][C]-1.2119[/C][C]0.115187[/C][/ROW]
[ROW][C]3[/C][C]-0.051798[/C][C]-0.3979[/C][C]0.346083[/C][/ROW]
[ROW][C]4[/C][C]-0.110253[/C][C]-0.8469[/C][C]0.200244[/C][/ROW]
[ROW][C]5[/C][C]0.309688[/C][C]2.3788[/C][C]0.010313[/C][/ROW]
[ROW][C]6[/C][C]-0.211685[/C][C]-1.626[/C][C]0.054642[/C][/ROW]
[ROW][C]7[/C][C]-0.108155[/C][C]-0.8308[/C][C]0.204732[/C][/ROW]
[ROW][C]8[/C][C]0.11089[/C][C]0.8518[/C][C]0.198895[/C][/ROW]
[ROW][C]9[/C][C]-0.064669[/C][C]-0.4967[/C][C]0.310612[/C][/ROW]
[ROW][C]10[/C][C]0.008337[/C][C]0.064[/C][C]0.474579[/C][/ROW]
[ROW][C]11[/C][C]-0.174951[/C][C]-1.3438[/C][C]0.092075[/C][/ROW]
[ROW][C]12[/C][C]0.157675[/C][C]1.2111[/C][C]0.115339[/C][/ROW]
[ROW][C]13[/C][C]0.031408[/C][C]0.2412[/C][C]0.4051[/C][/ROW]
[ROW][C]14[/C][C]0.063193[/C][C]0.4854[/C][C]0.314597[/C][/ROW]
[ROW][C]15[/C][C]-0.018035[/C][C]-0.1385[/C][C]0.445147[/C][/ROW]
[ROW][C]16[/C][C]-0.046425[/C][C]-0.3566[/C][C]0.361334[/C][/ROW]
[ROW][C]17[/C][C]-0.154401[/C][C]-1.186[/C][C]0.120193[/C][/ROW]
[ROW][C]18[/C][C]0.184311[/C][C]1.4157[/C][C]0.081057[/C][/ROW]
[ROW][C]19[/C][C]0.108613[/C][C]0.8343[/C][C]0.203746[/C][/ROW]
[ROW][C]20[/C][C]0.044691[/C][C]0.3433[/C][C]0.366306[/C][/ROW]
[ROW][C]21[/C][C]0.069028[/C][C]0.5302[/C][C]0.298978[/C][/ROW]
[ROW][C]22[/C][C]-0.097815[/C][C]-0.7513[/C][C]0.22772[/C][/ROW]
[ROW][C]23[/C][C]-0.109879[/C][C]-0.844[/C][C]0.201041[/C][/ROW]
[ROW][C]24[/C][C]0.102319[/C][C]0.7859[/C][C]0.217528[/C][/ROW]
[ROW][C]25[/C][C]0.060178[/C][C]0.4622[/C][C]0.322805[/C][/ROW]
[ROW][C]26[/C][C]-0.072471[/C][C]-0.5567[/C][C]0.289933[/C][/ROW]
[ROW][C]27[/C][C]-0.020179[/C][C]-0.155[/C][C]0.438676[/C][/ROW]
[ROW][C]28[/C][C]0.055452[/C][C]0.4259[/C][C]0.335852[/C][/ROW]
[ROW][C]29[/C][C]-0.006686[/C][C]-0.0514[/C][C]0.479607[/C][/ROW]
[ROW][C]30[/C][C]-0.048436[/C][C]-0.372[/C][C]0.355598[/C][/ROW]
[ROW][C]31[/C][C]0.067065[/C][C]0.5151[/C][C]0.304191[/C][/ROW]
[ROW][C]32[/C][C]-0.061093[/C][C]-0.4693[/C][C]0.320305[/C][/ROW]
[ROW][C]33[/C][C]-0.051821[/C][C]-0.398[/C][C]0.346017[/C][/ROW]
[ROW][C]34[/C][C]0.035141[/C][C]0.2699[/C][C]0.394081[/C][/ROW]
[ROW][C]35[/C][C]0.060894[/C][C]0.4677[/C][C]0.320849[/C][/ROW]
[ROW][C]36[/C][C]0.022387[/C][C]0.172[/C][C]0.432029[/C][/ROW]
[ROW][C]37[/C][C]0.086[/C][C]0.6606[/C][C]0.255728[/C][/ROW]
[ROW][C]38[/C][C]-0.107746[/C][C]-0.8276[/C][C]0.205613[/C][/ROW]
[ROW][C]39[/C][C]-0.105107[/C][C]-0.8073[/C][C]0.211357[/C][/ROW]
[ROW][C]40[/C][C]-0.039233[/C][C]-0.3014[/C][C]0.382101[/C][/ROW]
[ROW][C]41[/C][C]-0.152734[/C][C]-1.1732[/C][C]0.122721[/C][/ROW]
[ROW][C]42[/C][C]0.020086[/C][C]0.1543[/C][C]0.438956[/C][/ROW]
[ROW][C]43[/C][C]0.074293[/C][C]0.5707[/C][C]0.285201[/C][/ROW]
[ROW][C]44[/C][C]-0.051331[/C][C]-0.3943[/C][C]0.347398[/C][/ROW]
[ROW][C]45[/C][C]0.002622[/C][C]0.0201[/C][C]0.491999[/C][/ROW]
[ROW][C]46[/C][C]0.010375[/C][C]0.0797[/C][C]0.468377[/C][/ROW]
[ROW][C]47[/C][C]0.024691[/C][C]0.1897[/C][C]0.425116[/C][/ROW]
[ROW][C]48[/C][C]0.002586[/C][C]0.0199[/C][C]0.492109[/C][/ROW]
[/TABLE]
Source: https://freestatistics.org/blog/index.php?pk=295204&T=2

Globally Unique Identifier (entire table): ba.freestatistics.org/blog/index.php?pk=295204&T=2

As an alternative you can also use a QR Code:  

The GUIDs for individual cells are displayed in the table below:

Partial Autocorrelation Function
Time lag kPACF(k)T-STATP-value
1-0.489099-3.75680.000198
2-0.157778-1.21190.115187
3-0.051798-0.39790.346083
4-0.110253-0.84690.200244
50.3096882.37880.010313
6-0.211685-1.6260.054642
7-0.108155-0.83080.204732
80.110890.85180.198895
9-0.064669-0.49670.310612
100.0083370.0640.474579
11-0.174951-1.34380.092075
120.1576751.21110.115339
130.0314080.24120.4051
140.0631930.48540.314597
15-0.018035-0.13850.445147
16-0.046425-0.35660.361334
17-0.154401-1.1860.120193
180.1843111.41570.081057
190.1086130.83430.203746
200.0446910.34330.366306
210.0690280.53020.298978
22-0.097815-0.75130.22772
23-0.109879-0.8440.201041
240.1023190.78590.217528
250.0601780.46220.322805
26-0.072471-0.55670.289933
27-0.020179-0.1550.438676
280.0554520.42590.335852
29-0.006686-0.05140.479607
30-0.048436-0.3720.355598
310.0670650.51510.304191
32-0.061093-0.46930.320305
33-0.051821-0.3980.346017
340.0351410.26990.394081
350.0608940.46770.320849
360.0223870.1720.432029
370.0860.66060.255728
38-0.107746-0.82760.205613
39-0.105107-0.80730.211357
40-0.039233-0.30140.382101
41-0.152734-1.17320.122721
420.0200860.15430.438956
430.0742930.57070.285201
44-0.051331-0.39430.347398
450.0026220.02010.491999
460.0103750.07970.468377
470.0246910.18970.425116
480.0025860.01990.492109


Parameters (Session):
par1 = 48 ; par2 = 1 ; par3 = 1 ; par4 = 0 ; par5 = 12 ; par6 = White Noise ; par7 = 0.95 ;
Parameters (R input):
par1 = 48 ; par2 = 1 ; par3 = 1 ; par4 = 0 ; par5 = 12 ; par6 = White Noise ; par7 = 0.95 ; par8 = ;
R code (references can be found in the software module):
par8 <- ''
par7 <- '0.95'
par6 <- 'White Noise'
par5 <- '12'
par4 <- '0'
par3 <- '1'
par2 <- '1'
par1 <- '24'
if (par1 == 'Default') {
par1 = 10*log10(length(x))
} else {
par1 <- as.numeric(par1)
}
par2 <- as.numeric(par2)
par3 <- as.numeric(par3)
par4 <- as.numeric(par4)
par5 <- as.numeric(par5)
if (par6 == 'White Noise') par6 <- 'white' else par6 <- 'ma'
par7 <- as.numeric(par7)
if (par8 != '') par8 <- as.numeric(par8)
x <- na.omit(x)
ox <- x
if (par8 == '') {
if (par2 == 0) {
x <- log(x)
} else {
x <- (x ^ par2 - 1) / par2
}
} else {
x <- log(x,base=par8)
}
if (par3 > 0) x <- diff(x,lag=1,difference=par3)
if (par4 > 0) x <- diff(x,lag=par5,difference=par4)
bitmap(file='picts.png')
op <- par(mfrow=c(2,1))
plot(ox,type='l',main='Original Time Series',xlab='time',ylab='value')
if (par8=='') {
mytitle <- paste('Working Time Series (lambda=',par2,', d=',par3,', D=',par4,')',sep='')
mysub <- paste('(lambda=',par2,', d=',par3,', D=',par4,', CI=', par7, ', CI type=',par6,')',sep='')
} else {
mytitle <- paste('Working Time Series (base=',par8,', d=',par3,', D=',par4,')',sep='')
mysub <- paste('(base=',par8,', d=',par3,', D=',par4,', CI=', par7, ', CI type=',par6,')',sep='')
}
plot(x,type='l', main=mytitle,xlab='time',ylab='value')
par(op)
dev.off()
bitmap(file='pic1.png')
racf <- acf(x, par1, main='Autocorrelation', xlab='time lag', ylab='ACF', ci.type=par6, ci=par7, sub=mysub)
dev.off()
bitmap(file='pic2.png')
rpacf <- pacf(x,par1,main='Partial Autocorrelation',xlab='lags',ylab='PACF',sub=mysub)
dev.off()
(myacf <- c(racf$acf))
(mypacf <- c(rpacf$acf))
lengthx <- length(x)
sqrtn <- sqrt(lengthx)
load(file='createtable')
a<-table.start()
a<-table.row.start(a)
a<-table.element(a,'Autocorrelation Function',4,TRUE)
a<-table.row.end(a)
a<-table.row.start(a)
a<-table.element(a,'Time lag k',header=TRUE)
a<-table.element(a,hyperlink('basics.htm','ACF(k)','click here for more information about the Autocorrelation Function'),header=TRUE)
a<-table.element(a,'T-STAT',header=TRUE)
a<-table.element(a,'P-value',header=TRUE)
a<-table.row.end(a)
for (i in 2:(par1+1)) {
a<-table.row.start(a)
a<-table.element(a,i-1,header=TRUE)
a<-table.element(a,round(myacf[i],6))
mytstat <- myacf[i]*sqrtn
a<-table.element(a,round(mytstat,4))
a<-table.element(a,round(1-pt(abs(mytstat),lengthx),6))
a<-table.row.end(a)
}
a<-table.end(a)
table.save(a,file='mytable.tab')
a<-table.start()
a<-table.row.start(a)
a<-table.element(a,'Partial Autocorrelation Function',4,TRUE)
a<-table.row.end(a)
a<-table.row.start(a)
a<-table.element(a,'Time lag k',header=TRUE)
a<-table.element(a,hyperlink('basics.htm','PACF(k)','click here for more information about the Partial Autocorrelation Function'),header=TRUE)
a<-table.element(a,'T-STAT',header=TRUE)
a<-table.element(a,'P-value',header=TRUE)
a<-table.row.end(a)
for (i in 1:par1) {
a<-table.row.start(a)
a<-table.element(a,i,header=TRUE)
a<-table.element(a,round(mypacf[i],6))
mytstat <- mypacf[i]*sqrtn
a<-table.element(a,round(mytstat,4))
a<-table.element(a,round(1-pt(abs(mytstat),lengthx),6))
a<-table.row.end(a)
}
a<-table.end(a)
table.save(a,file='mytable1.tab')