Free Statistics

of Irreproducible Research!

Author's title

Author*Unverified author*
R Software Modulerwasp_autocorrelation.wasp
Title produced by software(Partial) Autocorrelation Function
Date of computationTue, 03 May 2016 10:26:59 +0100
Cite this page as followsStatistical Computations at FreeStatistics.org, Office for Research Development and Education, URL https://freestatistics.org/blog/index.php?v=date/2016/May/03/t14622676444mukhovr62hblfe.htm/, Retrieved Mon, 29 Apr 2024 05:20:29 +0000
Statistical Computations at FreeStatistics.org, Office for Research Development and Education, URL https://freestatistics.org/blog/index.php?pk=295205, Retrieved Mon, 29 Apr 2024 05:20:29 +0000
QR Codes:

Original text written by user:
IsPrivate?No (this computation is public)
User-defined keywords
Estimated Impact97
Family? (F = Feedback message, R = changed R code, M = changed R Module, P = changed Parameters, D = changed Data)
-       [(Partial) Autocorrelation Function] [] [2016-05-03 09:26:59] [517bf63cbd197750110a40d4d2cd39d6] [Current]
Feedback Forum

Post a new message
Dataseries X:
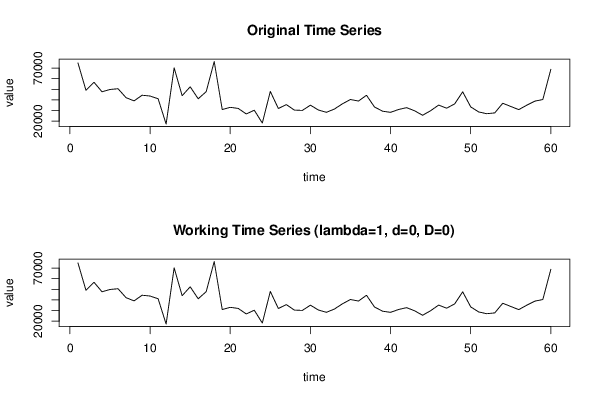
74787
49019
56601
47637
49806
50499
42092
39062
44382
43635
41082
17244
70170
43949
52333
41032
47758
76116
30917
32996
31951
26775
30268
18214
47957
31901
35559
30408
30083
35043
30475
28309
31394
36313
40357
38918
44368
33298
29366
28282
30943
32699
29764
25524
29807
35112
32192
36214
47639
33421
28642
26996
27757
36839
33821
30839
35032
38821
40347
68799


Summary of computational transaction
Raw Inputview raw input (R code)
Raw Outputview raw output of R engine
Computing time2 seconds
R Server'Sir Maurice George Kendall' @ kendall.wessa.net

\begin{tabular}{lllllllll}
\hline
Summary of computational transaction \tabularnewline
Raw Input & view raw input (R code)  \tabularnewline
Raw Output & view raw output of R engine  \tabularnewline
Computing time & 2 seconds \tabularnewline
R Server & 'Sir Maurice George Kendall' @ kendall.wessa.net \tabularnewline
\hline
\end{tabular}
%Source: https://freestatistics.org/blog/index.php?pk=295205&T=0

[TABLE]
[ROW][C]Summary of computational transaction[/C][/ROW]
[ROW][C]Raw Input[/C][C]view raw input (R code) [/C][/ROW]
[ROW][C]Raw Output[/C][C]view raw output of R engine [/C][/ROW]
[ROW][C]Computing time[/C][C]2 seconds[/C][/ROW]
[ROW][C]R Server[/C][C]'Sir Maurice George Kendall' @ kendall.wessa.net[/C][/ROW]
[/TABLE]
Source: https://freestatistics.org/blog/index.php?pk=295205&T=0

Globally Unique Identifier (entire table): ba.freestatistics.org/blog/index.php?pk=295205&T=0

As an alternative you can also use a QR Code:  

The GUIDs for individual cells are displayed in the table below:

Summary of computational transaction
Raw Inputview raw input (R code)
Raw Outputview raw output of R engine
Computing time2 seconds
R Server'Sir Maurice George Kendall' @ kendall.wessa.net


Autocorrelation Function
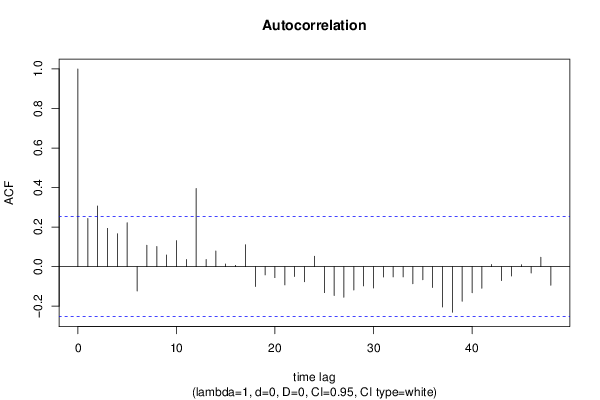
Time lag kACF(k)T-STATP-value
10.2434661.88590.032077
20.3066382.37520.010376
30.1934941.49880.069584
40.1662481.28780.101388
50.2224141.72280.045037
6-0.123462-0.95630.171371
70.1084860.84030.202029
80.1018330.78880.216668
90.0589570.45670.324776
100.1314691.01840.1563
110.03650.28270.38918
120.395123.06060.001651
130.0358320.27750.391156
140.0793940.6150.270445
150.0131150.10160.45971
160.0064410.04990.480188
170.1104730.85570.197778
18-0.100197-0.77610.220362
19-0.041739-0.32330.373794
20-0.055609-0.43070.334099
21-0.092406-0.71580.238454
22-0.050047-0.38770.34982
23-0.076738-0.59440.277235
240.0524550.40630.342978
25-0.131659-1.01980.155953
26-0.146078-1.13150.13117
27-0.155274-1.20270.1169
28-0.118505-0.91790.181165
29-0.097354-0.75410.226869
30-0.107857-0.83550.203387
31-0.052198-0.40430.343707
32-0.051752-0.40090.344971
33-0.051849-0.40160.344695
34-0.086968-0.67370.25156
35-0.066003-0.51130.305523
36-0.105427-0.81660.208684
37-0.20428-1.58230.059414
38-0.230842-1.78810.039405
39-0.174982-1.35540.090185
40-0.132008-1.02250.155318
41-0.109786-0.85040.199243
420.0108830.08430.466549
43-0.070655-0.54730.293103
44-0.047059-0.36450.358378
450.009760.07560.469996
46-0.032269-0.250.401738
470.0474720.36770.35719
48-0.093804-0.72660.235148

\begin{tabular}{lllllllll}
\hline
Autocorrelation Function \tabularnewline
Time lag k & ACF(k) & T-STAT & P-value \tabularnewline
1 & 0.243466 & 1.8859 & 0.032077 \tabularnewline
2 & 0.306638 & 2.3752 & 0.010376 \tabularnewline
3 & 0.193494 & 1.4988 & 0.069584 \tabularnewline
4 & 0.166248 & 1.2878 & 0.101388 \tabularnewline
5 & 0.222414 & 1.7228 & 0.045037 \tabularnewline
6 & -0.123462 & -0.9563 & 0.171371 \tabularnewline
7 & 0.108486 & 0.8403 & 0.202029 \tabularnewline
8 & 0.101833 & 0.7888 & 0.216668 \tabularnewline
9 & 0.058957 & 0.4567 & 0.324776 \tabularnewline
10 & 0.131469 & 1.0184 & 0.1563 \tabularnewline
11 & 0.0365 & 0.2827 & 0.38918 \tabularnewline
12 & 0.39512 & 3.0606 & 0.001651 \tabularnewline
13 & 0.035832 & 0.2775 & 0.391156 \tabularnewline
14 & 0.079394 & 0.615 & 0.270445 \tabularnewline
15 & 0.013115 & 0.1016 & 0.45971 \tabularnewline
16 & 0.006441 & 0.0499 & 0.480188 \tabularnewline
17 & 0.110473 & 0.8557 & 0.197778 \tabularnewline
18 & -0.100197 & -0.7761 & 0.220362 \tabularnewline
19 & -0.041739 & -0.3233 & 0.373794 \tabularnewline
20 & -0.055609 & -0.4307 & 0.334099 \tabularnewline
21 & -0.092406 & -0.7158 & 0.238454 \tabularnewline
22 & -0.050047 & -0.3877 & 0.34982 \tabularnewline
23 & -0.076738 & -0.5944 & 0.277235 \tabularnewline
24 & 0.052455 & 0.4063 & 0.342978 \tabularnewline
25 & -0.131659 & -1.0198 & 0.155953 \tabularnewline
26 & -0.146078 & -1.1315 & 0.13117 \tabularnewline
27 & -0.155274 & -1.2027 & 0.1169 \tabularnewline
28 & -0.118505 & -0.9179 & 0.181165 \tabularnewline
29 & -0.097354 & -0.7541 & 0.226869 \tabularnewline
30 & -0.107857 & -0.8355 & 0.203387 \tabularnewline
31 & -0.052198 & -0.4043 & 0.343707 \tabularnewline
32 & -0.051752 & -0.4009 & 0.344971 \tabularnewline
33 & -0.051849 & -0.4016 & 0.344695 \tabularnewline
34 & -0.086968 & -0.6737 & 0.25156 \tabularnewline
35 & -0.066003 & -0.5113 & 0.305523 \tabularnewline
36 & -0.105427 & -0.8166 & 0.208684 \tabularnewline
37 & -0.20428 & -1.5823 & 0.059414 \tabularnewline
38 & -0.230842 & -1.7881 & 0.039405 \tabularnewline
39 & -0.174982 & -1.3554 & 0.090185 \tabularnewline
40 & -0.132008 & -1.0225 & 0.155318 \tabularnewline
41 & -0.109786 & -0.8504 & 0.199243 \tabularnewline
42 & 0.010883 & 0.0843 & 0.466549 \tabularnewline
43 & -0.070655 & -0.5473 & 0.293103 \tabularnewline
44 & -0.047059 & -0.3645 & 0.358378 \tabularnewline
45 & 0.00976 & 0.0756 & 0.469996 \tabularnewline
46 & -0.032269 & -0.25 & 0.401738 \tabularnewline
47 & 0.047472 & 0.3677 & 0.35719 \tabularnewline
48 & -0.093804 & -0.7266 & 0.235148 \tabularnewline
\hline
\end{tabular}
%Source: https://freestatistics.org/blog/index.php?pk=295205&T=1

[TABLE]
[ROW][C]Autocorrelation Function[/C][/ROW]
[ROW][C]Time lag k[/C][C]ACF(k)[/C][C]T-STAT[/C][C]P-value[/C][/ROW]
[ROW][C]1[/C][C]0.243466[/C][C]1.8859[/C][C]0.032077[/C][/ROW]
[ROW][C]2[/C][C]0.306638[/C][C]2.3752[/C][C]0.010376[/C][/ROW]
[ROW][C]3[/C][C]0.193494[/C][C]1.4988[/C][C]0.069584[/C][/ROW]
[ROW][C]4[/C][C]0.166248[/C][C]1.2878[/C][C]0.101388[/C][/ROW]
[ROW][C]5[/C][C]0.222414[/C][C]1.7228[/C][C]0.045037[/C][/ROW]
[ROW][C]6[/C][C]-0.123462[/C][C]-0.9563[/C][C]0.171371[/C][/ROW]
[ROW][C]7[/C][C]0.108486[/C][C]0.8403[/C][C]0.202029[/C][/ROW]
[ROW][C]8[/C][C]0.101833[/C][C]0.7888[/C][C]0.216668[/C][/ROW]
[ROW][C]9[/C][C]0.058957[/C][C]0.4567[/C][C]0.324776[/C][/ROW]
[ROW][C]10[/C][C]0.131469[/C][C]1.0184[/C][C]0.1563[/C][/ROW]
[ROW][C]11[/C][C]0.0365[/C][C]0.2827[/C][C]0.38918[/C][/ROW]
[ROW][C]12[/C][C]0.39512[/C][C]3.0606[/C][C]0.001651[/C][/ROW]
[ROW][C]13[/C][C]0.035832[/C][C]0.2775[/C][C]0.391156[/C][/ROW]
[ROW][C]14[/C][C]0.079394[/C][C]0.615[/C][C]0.270445[/C][/ROW]
[ROW][C]15[/C][C]0.013115[/C][C]0.1016[/C][C]0.45971[/C][/ROW]
[ROW][C]16[/C][C]0.006441[/C][C]0.0499[/C][C]0.480188[/C][/ROW]
[ROW][C]17[/C][C]0.110473[/C][C]0.8557[/C][C]0.197778[/C][/ROW]
[ROW][C]18[/C][C]-0.100197[/C][C]-0.7761[/C][C]0.220362[/C][/ROW]
[ROW][C]19[/C][C]-0.041739[/C][C]-0.3233[/C][C]0.373794[/C][/ROW]
[ROW][C]20[/C][C]-0.055609[/C][C]-0.4307[/C][C]0.334099[/C][/ROW]
[ROW][C]21[/C][C]-0.092406[/C][C]-0.7158[/C][C]0.238454[/C][/ROW]
[ROW][C]22[/C][C]-0.050047[/C][C]-0.3877[/C][C]0.34982[/C][/ROW]
[ROW][C]23[/C][C]-0.076738[/C][C]-0.5944[/C][C]0.277235[/C][/ROW]
[ROW][C]24[/C][C]0.052455[/C][C]0.4063[/C][C]0.342978[/C][/ROW]
[ROW][C]25[/C][C]-0.131659[/C][C]-1.0198[/C][C]0.155953[/C][/ROW]
[ROW][C]26[/C][C]-0.146078[/C][C]-1.1315[/C][C]0.13117[/C][/ROW]
[ROW][C]27[/C][C]-0.155274[/C][C]-1.2027[/C][C]0.1169[/C][/ROW]
[ROW][C]28[/C][C]-0.118505[/C][C]-0.9179[/C][C]0.181165[/C][/ROW]
[ROW][C]29[/C][C]-0.097354[/C][C]-0.7541[/C][C]0.226869[/C][/ROW]
[ROW][C]30[/C][C]-0.107857[/C][C]-0.8355[/C][C]0.203387[/C][/ROW]
[ROW][C]31[/C][C]-0.052198[/C][C]-0.4043[/C][C]0.343707[/C][/ROW]
[ROW][C]32[/C][C]-0.051752[/C][C]-0.4009[/C][C]0.344971[/C][/ROW]
[ROW][C]33[/C][C]-0.051849[/C][C]-0.4016[/C][C]0.344695[/C][/ROW]
[ROW][C]34[/C][C]-0.086968[/C][C]-0.6737[/C][C]0.25156[/C][/ROW]
[ROW][C]35[/C][C]-0.066003[/C][C]-0.5113[/C][C]0.305523[/C][/ROW]
[ROW][C]36[/C][C]-0.105427[/C][C]-0.8166[/C][C]0.208684[/C][/ROW]
[ROW][C]37[/C][C]-0.20428[/C][C]-1.5823[/C][C]0.059414[/C][/ROW]
[ROW][C]38[/C][C]-0.230842[/C][C]-1.7881[/C][C]0.039405[/C][/ROW]
[ROW][C]39[/C][C]-0.174982[/C][C]-1.3554[/C][C]0.090185[/C][/ROW]
[ROW][C]40[/C][C]-0.132008[/C][C]-1.0225[/C][C]0.155318[/C][/ROW]
[ROW][C]41[/C][C]-0.109786[/C][C]-0.8504[/C][C]0.199243[/C][/ROW]
[ROW][C]42[/C][C]0.010883[/C][C]0.0843[/C][C]0.466549[/C][/ROW]
[ROW][C]43[/C][C]-0.070655[/C][C]-0.5473[/C][C]0.293103[/C][/ROW]
[ROW][C]44[/C][C]-0.047059[/C][C]-0.3645[/C][C]0.358378[/C][/ROW]
[ROW][C]45[/C][C]0.00976[/C][C]0.0756[/C][C]0.469996[/C][/ROW]
[ROW][C]46[/C][C]-0.032269[/C][C]-0.25[/C][C]0.401738[/C][/ROW]
[ROW][C]47[/C][C]0.047472[/C][C]0.3677[/C][C]0.35719[/C][/ROW]
[ROW][C]48[/C][C]-0.093804[/C][C]-0.7266[/C][C]0.235148[/C][/ROW]
[/TABLE]
Source: https://freestatistics.org/blog/index.php?pk=295205&T=1

Globally Unique Identifier (entire table): ba.freestatistics.org/blog/index.php?pk=295205&T=1

As an alternative you can also use a QR Code:  

The GUIDs for individual cells are displayed in the table below:

Autocorrelation Function
Time lag kACF(k)T-STATP-value
10.2434661.88590.032077
20.3066382.37520.010376
30.1934941.49880.069584
40.1662481.28780.101388
50.2224141.72280.045037
6-0.123462-0.95630.171371
70.1084860.84030.202029
80.1018330.78880.216668
90.0589570.45670.324776
100.1314691.01840.1563
110.03650.28270.38918
120.395123.06060.001651
130.0358320.27750.391156
140.0793940.6150.270445
150.0131150.10160.45971
160.0064410.04990.480188
170.1104730.85570.197778
18-0.100197-0.77610.220362
19-0.041739-0.32330.373794
20-0.055609-0.43070.334099
21-0.092406-0.71580.238454
22-0.050047-0.38770.34982
23-0.076738-0.59440.277235
240.0524550.40630.342978
25-0.131659-1.01980.155953
26-0.146078-1.13150.13117
27-0.155274-1.20270.1169
28-0.118505-0.91790.181165
29-0.097354-0.75410.226869
30-0.107857-0.83550.203387
31-0.052198-0.40430.343707
32-0.051752-0.40090.344971
33-0.051849-0.40160.344695
34-0.086968-0.67370.25156
35-0.066003-0.51130.305523
36-0.105427-0.81660.208684
37-0.20428-1.58230.059414
38-0.230842-1.78810.039405
39-0.174982-1.35540.090185
40-0.132008-1.02250.155318
41-0.109786-0.85040.199243
420.0108830.08430.466549
43-0.070655-0.54730.293103
44-0.047059-0.36450.358378
450.009760.07560.469996
46-0.032269-0.250.401738
470.0474720.36770.35719
48-0.093804-0.72660.235148


Partial Autocorrelation Function
Time lag kPACF(k)T-STATP-value
10.2434661.88590.032077
20.2629492.03680.023045
30.0850190.65860.256349
40.0450920.34930.36405
50.1340421.03830.151652
6-0.285092-2.20830.015527
70.0867210.67170.252165
80.1565021.21230.115083
9-0.021718-0.16820.433486
100.0877090.67940.249751
110.0393170.30450.380883
120.3004262.32710.011677
13-0.178474-1.38250.085979
14-0.069155-0.53570.297083
15-0.078902-0.61120.271696
16-0.024644-0.19090.424626
170.0533690.41340.340395
180.054910.42530.336058
19-0.134115-1.03880.151522
20-0.095546-0.74010.231064
21-0.05538-0.4290.33474
22-0.064465-0.49930.309682
230.0832410.64480.260764
24-0.007403-0.05730.477231
25-0.130415-1.01020.158231
26-0.147044-1.1390.129615
27-0.045682-0.35390.362345
280.0045050.03490.486139
29-0.037268-0.28870.386911
300.1230010.95280.172267
310.0844360.6540.257794
32-0.028185-0.21830.413961
330.0029740.0230.490847
34-0.084341-0.65330.258029
35-0.089943-0.69670.244342
36-0.085899-0.66540.254181
37-0.029306-0.2270.410598
38-0.063184-0.48940.313165
390.0703590.5450.293886
40-0.016459-0.12750.44949
41-0.010632-0.08240.467319
420.15051.16580.124161
43-0.099619-0.77160.221676
44-0.116196-0.90.185846
450.0814470.63090.265256
460.0220170.17050.432579
47-0.010214-0.07910.468601
48-0.01213-0.0940.462728

\begin{tabular}{lllllllll}
\hline
Partial Autocorrelation Function \tabularnewline
Time lag k & PACF(k) & T-STAT & P-value \tabularnewline
1 & 0.243466 & 1.8859 & 0.032077 \tabularnewline
2 & 0.262949 & 2.0368 & 0.023045 \tabularnewline
3 & 0.085019 & 0.6586 & 0.256349 \tabularnewline
4 & 0.045092 & 0.3493 & 0.36405 \tabularnewline
5 & 0.134042 & 1.0383 & 0.151652 \tabularnewline
6 & -0.285092 & -2.2083 & 0.015527 \tabularnewline
7 & 0.086721 & 0.6717 & 0.252165 \tabularnewline
8 & 0.156502 & 1.2123 & 0.115083 \tabularnewline
9 & -0.021718 & -0.1682 & 0.433486 \tabularnewline
10 & 0.087709 & 0.6794 & 0.249751 \tabularnewline
11 & 0.039317 & 0.3045 & 0.380883 \tabularnewline
12 & 0.300426 & 2.3271 & 0.011677 \tabularnewline
13 & -0.178474 & -1.3825 & 0.085979 \tabularnewline
14 & -0.069155 & -0.5357 & 0.297083 \tabularnewline
15 & -0.078902 & -0.6112 & 0.271696 \tabularnewline
16 & -0.024644 & -0.1909 & 0.424626 \tabularnewline
17 & 0.053369 & 0.4134 & 0.340395 \tabularnewline
18 & 0.05491 & 0.4253 & 0.336058 \tabularnewline
19 & -0.134115 & -1.0388 & 0.151522 \tabularnewline
20 & -0.095546 & -0.7401 & 0.231064 \tabularnewline
21 & -0.05538 & -0.429 & 0.33474 \tabularnewline
22 & -0.064465 & -0.4993 & 0.309682 \tabularnewline
23 & 0.083241 & 0.6448 & 0.260764 \tabularnewline
24 & -0.007403 & -0.0573 & 0.477231 \tabularnewline
25 & -0.130415 & -1.0102 & 0.158231 \tabularnewline
26 & -0.147044 & -1.139 & 0.129615 \tabularnewline
27 & -0.045682 & -0.3539 & 0.362345 \tabularnewline
28 & 0.004505 & 0.0349 & 0.486139 \tabularnewline
29 & -0.037268 & -0.2887 & 0.386911 \tabularnewline
30 & 0.123001 & 0.9528 & 0.172267 \tabularnewline
31 & 0.084436 & 0.654 & 0.257794 \tabularnewline
32 & -0.028185 & -0.2183 & 0.413961 \tabularnewline
33 & 0.002974 & 0.023 & 0.490847 \tabularnewline
34 & -0.084341 & -0.6533 & 0.258029 \tabularnewline
35 & -0.089943 & -0.6967 & 0.244342 \tabularnewline
36 & -0.085899 & -0.6654 & 0.254181 \tabularnewline
37 & -0.029306 & -0.227 & 0.410598 \tabularnewline
38 & -0.063184 & -0.4894 & 0.313165 \tabularnewline
39 & 0.070359 & 0.545 & 0.293886 \tabularnewline
40 & -0.016459 & -0.1275 & 0.44949 \tabularnewline
41 & -0.010632 & -0.0824 & 0.467319 \tabularnewline
42 & 0.1505 & 1.1658 & 0.124161 \tabularnewline
43 & -0.099619 & -0.7716 & 0.221676 \tabularnewline
44 & -0.116196 & -0.9 & 0.185846 \tabularnewline
45 & 0.081447 & 0.6309 & 0.265256 \tabularnewline
46 & 0.022017 & 0.1705 & 0.432579 \tabularnewline
47 & -0.010214 & -0.0791 & 0.468601 \tabularnewline
48 & -0.01213 & -0.094 & 0.462728 \tabularnewline
\hline
\end{tabular}
%Source: https://freestatistics.org/blog/index.php?pk=295205&T=2

[TABLE]
[ROW][C]Partial Autocorrelation Function[/C][/ROW]
[ROW][C]Time lag k[/C][C]PACF(k)[/C][C]T-STAT[/C][C]P-value[/C][/ROW]
[ROW][C]1[/C][C]0.243466[/C][C]1.8859[/C][C]0.032077[/C][/ROW]
[ROW][C]2[/C][C]0.262949[/C][C]2.0368[/C][C]0.023045[/C][/ROW]
[ROW][C]3[/C][C]0.085019[/C][C]0.6586[/C][C]0.256349[/C][/ROW]
[ROW][C]4[/C][C]0.045092[/C][C]0.3493[/C][C]0.36405[/C][/ROW]
[ROW][C]5[/C][C]0.134042[/C][C]1.0383[/C][C]0.151652[/C][/ROW]
[ROW][C]6[/C][C]-0.285092[/C][C]-2.2083[/C][C]0.015527[/C][/ROW]
[ROW][C]7[/C][C]0.086721[/C][C]0.6717[/C][C]0.252165[/C][/ROW]
[ROW][C]8[/C][C]0.156502[/C][C]1.2123[/C][C]0.115083[/C][/ROW]
[ROW][C]9[/C][C]-0.021718[/C][C]-0.1682[/C][C]0.433486[/C][/ROW]
[ROW][C]10[/C][C]0.087709[/C][C]0.6794[/C][C]0.249751[/C][/ROW]
[ROW][C]11[/C][C]0.039317[/C][C]0.3045[/C][C]0.380883[/C][/ROW]
[ROW][C]12[/C][C]0.300426[/C][C]2.3271[/C][C]0.011677[/C][/ROW]
[ROW][C]13[/C][C]-0.178474[/C][C]-1.3825[/C][C]0.085979[/C][/ROW]
[ROW][C]14[/C][C]-0.069155[/C][C]-0.5357[/C][C]0.297083[/C][/ROW]
[ROW][C]15[/C][C]-0.078902[/C][C]-0.6112[/C][C]0.271696[/C][/ROW]
[ROW][C]16[/C][C]-0.024644[/C][C]-0.1909[/C][C]0.424626[/C][/ROW]
[ROW][C]17[/C][C]0.053369[/C][C]0.4134[/C][C]0.340395[/C][/ROW]
[ROW][C]18[/C][C]0.05491[/C][C]0.4253[/C][C]0.336058[/C][/ROW]
[ROW][C]19[/C][C]-0.134115[/C][C]-1.0388[/C][C]0.151522[/C][/ROW]
[ROW][C]20[/C][C]-0.095546[/C][C]-0.7401[/C][C]0.231064[/C][/ROW]
[ROW][C]21[/C][C]-0.05538[/C][C]-0.429[/C][C]0.33474[/C][/ROW]
[ROW][C]22[/C][C]-0.064465[/C][C]-0.4993[/C][C]0.309682[/C][/ROW]
[ROW][C]23[/C][C]0.083241[/C][C]0.6448[/C][C]0.260764[/C][/ROW]
[ROW][C]24[/C][C]-0.007403[/C][C]-0.0573[/C][C]0.477231[/C][/ROW]
[ROW][C]25[/C][C]-0.130415[/C][C]-1.0102[/C][C]0.158231[/C][/ROW]
[ROW][C]26[/C][C]-0.147044[/C][C]-1.139[/C][C]0.129615[/C][/ROW]
[ROW][C]27[/C][C]-0.045682[/C][C]-0.3539[/C][C]0.362345[/C][/ROW]
[ROW][C]28[/C][C]0.004505[/C][C]0.0349[/C][C]0.486139[/C][/ROW]
[ROW][C]29[/C][C]-0.037268[/C][C]-0.2887[/C][C]0.386911[/C][/ROW]
[ROW][C]30[/C][C]0.123001[/C][C]0.9528[/C][C]0.172267[/C][/ROW]
[ROW][C]31[/C][C]0.084436[/C][C]0.654[/C][C]0.257794[/C][/ROW]
[ROW][C]32[/C][C]-0.028185[/C][C]-0.2183[/C][C]0.413961[/C][/ROW]
[ROW][C]33[/C][C]0.002974[/C][C]0.023[/C][C]0.490847[/C][/ROW]
[ROW][C]34[/C][C]-0.084341[/C][C]-0.6533[/C][C]0.258029[/C][/ROW]
[ROW][C]35[/C][C]-0.089943[/C][C]-0.6967[/C][C]0.244342[/C][/ROW]
[ROW][C]36[/C][C]-0.085899[/C][C]-0.6654[/C][C]0.254181[/C][/ROW]
[ROW][C]37[/C][C]-0.029306[/C][C]-0.227[/C][C]0.410598[/C][/ROW]
[ROW][C]38[/C][C]-0.063184[/C][C]-0.4894[/C][C]0.313165[/C][/ROW]
[ROW][C]39[/C][C]0.070359[/C][C]0.545[/C][C]0.293886[/C][/ROW]
[ROW][C]40[/C][C]-0.016459[/C][C]-0.1275[/C][C]0.44949[/C][/ROW]
[ROW][C]41[/C][C]-0.010632[/C][C]-0.0824[/C][C]0.467319[/C][/ROW]
[ROW][C]42[/C][C]0.1505[/C][C]1.1658[/C][C]0.124161[/C][/ROW]
[ROW][C]43[/C][C]-0.099619[/C][C]-0.7716[/C][C]0.221676[/C][/ROW]
[ROW][C]44[/C][C]-0.116196[/C][C]-0.9[/C][C]0.185846[/C][/ROW]
[ROW][C]45[/C][C]0.081447[/C][C]0.6309[/C][C]0.265256[/C][/ROW]
[ROW][C]46[/C][C]0.022017[/C][C]0.1705[/C][C]0.432579[/C][/ROW]
[ROW][C]47[/C][C]-0.010214[/C][C]-0.0791[/C][C]0.468601[/C][/ROW]
[ROW][C]48[/C][C]-0.01213[/C][C]-0.094[/C][C]0.462728[/C][/ROW]
[/TABLE]
Source: https://freestatistics.org/blog/index.php?pk=295205&T=2

Globally Unique Identifier (entire table): ba.freestatistics.org/blog/index.php?pk=295205&T=2

As an alternative you can also use a QR Code:  

The GUIDs for individual cells are displayed in the table below:

Partial Autocorrelation Function
Time lag kPACF(k)T-STATP-value
10.2434661.88590.032077
20.2629492.03680.023045
30.0850190.65860.256349
40.0450920.34930.36405
50.1340421.03830.151652
6-0.285092-2.20830.015527
70.0867210.67170.252165
80.1565021.21230.115083
9-0.021718-0.16820.433486
100.0877090.67940.249751
110.0393170.30450.380883
120.3004262.32710.011677
13-0.178474-1.38250.085979
14-0.069155-0.53570.297083
15-0.078902-0.61120.271696
16-0.024644-0.19090.424626
170.0533690.41340.340395
180.054910.42530.336058
19-0.134115-1.03880.151522
20-0.095546-0.74010.231064
21-0.05538-0.4290.33474
22-0.064465-0.49930.309682
230.0832410.64480.260764
24-0.007403-0.05730.477231
25-0.130415-1.01020.158231
26-0.147044-1.1390.129615
27-0.045682-0.35390.362345
280.0045050.03490.486139
29-0.037268-0.28870.386911
300.1230010.95280.172267
310.0844360.6540.257794
32-0.028185-0.21830.413961
330.0029740.0230.490847
34-0.084341-0.65330.258029
35-0.089943-0.69670.244342
36-0.085899-0.66540.254181
37-0.029306-0.2270.410598
38-0.063184-0.48940.313165
390.0703590.5450.293886
40-0.016459-0.12750.44949
41-0.010632-0.08240.467319
420.15051.16580.124161
43-0.099619-0.77160.221676
44-0.116196-0.90.185846
450.0814470.63090.265256
460.0220170.17050.432579
47-0.010214-0.07910.468601
48-0.01213-0.0940.462728


Parameters (Session):
par1 = 48 ; par2 = 1 ; par3 = 0 ; par4 = 0 ; par5 = 12 ; par6 = White Noise ; par7 = 0.95 ;
Parameters (R input):
par1 = 48 ; par2 = 1 ; par3 = 0 ; par4 = 0 ; par5 = 12 ; par6 = White Noise ; par7 = 0.95 ; par8 = ;
R code (references can be found in the software module):
par8 <- ''
par7 <- '0.95'
par6 <- 'White Noise'
par5 <- '12'
par4 <- '0'
par3 <- '1'
par2 <- '1'
par1 <- '48'
if (par1 == 'Default') {
par1 = 10*log10(length(x))
} else {
par1 <- as.numeric(par1)
}
par2 <- as.numeric(par2)
par3 <- as.numeric(par3)
par4 <- as.numeric(par4)
par5 <- as.numeric(par5)
if (par6 == 'White Noise') par6 <- 'white' else par6 <- 'ma'
par7 <- as.numeric(par7)
if (par8 != '') par8 <- as.numeric(par8)
x <- na.omit(x)
ox <- x
if (par8 == '') {
if (par2 == 0) {
x <- log(x)
} else {
x <- (x ^ par2 - 1) / par2
}
} else {
x <- log(x,base=par8)
}
if (par3 > 0) x <- diff(x,lag=1,difference=par3)
if (par4 > 0) x <- diff(x,lag=par5,difference=par4)
bitmap(file='picts.png')
op <- par(mfrow=c(2,1))
plot(ox,type='l',main='Original Time Series',xlab='time',ylab='value')
if (par8=='') {
mytitle <- paste('Working Time Series (lambda=',par2,', d=',par3,', D=',par4,')',sep='')
mysub <- paste('(lambda=',par2,', d=',par3,', D=',par4,', CI=', par7, ', CI type=',par6,')',sep='')
} else {
mytitle <- paste('Working Time Series (base=',par8,', d=',par3,', D=',par4,')',sep='')
mysub <- paste('(base=',par8,', d=',par3,', D=',par4,', CI=', par7, ', CI type=',par6,')',sep='')
}
plot(x,type='l', main=mytitle,xlab='time',ylab='value')
par(op)
dev.off()
bitmap(file='pic1.png')
racf <- acf(x, par1, main='Autocorrelation', xlab='time lag', ylab='ACF', ci.type=par6, ci=par7, sub=mysub)
dev.off()
bitmap(file='pic2.png')
rpacf <- pacf(x,par1,main='Partial Autocorrelation',xlab='lags',ylab='PACF',sub=mysub)
dev.off()
(myacf <- c(racf$acf))
(mypacf <- c(rpacf$acf))
lengthx <- length(x)
sqrtn <- sqrt(lengthx)
load(file='createtable')
a<-table.start()
a<-table.row.start(a)
a<-table.element(a,'Autocorrelation Function',4,TRUE)
a<-table.row.end(a)
a<-table.row.start(a)
a<-table.element(a,'Time lag k',header=TRUE)
a<-table.element(a,hyperlink('basics.htm','ACF(k)','click here for more information about the Autocorrelation Function'),header=TRUE)
a<-table.element(a,'T-STAT',header=TRUE)
a<-table.element(a,'P-value',header=TRUE)
a<-table.row.end(a)
for (i in 2:(par1+1)) {
a<-table.row.start(a)
a<-table.element(a,i-1,header=TRUE)
a<-table.element(a,round(myacf[i],6))
mytstat <- myacf[i]*sqrtn
a<-table.element(a,round(mytstat,4))
a<-table.element(a,round(1-pt(abs(mytstat),lengthx),6))
a<-table.row.end(a)
}
a<-table.end(a)
table.save(a,file='mytable.tab')
a<-table.start()
a<-table.row.start(a)
a<-table.element(a,'Partial Autocorrelation Function',4,TRUE)
a<-table.row.end(a)
a<-table.row.start(a)
a<-table.element(a,'Time lag k',header=TRUE)
a<-table.element(a,hyperlink('basics.htm','PACF(k)','click here for more information about the Partial Autocorrelation Function'),header=TRUE)
a<-table.element(a,'T-STAT',header=TRUE)
a<-table.element(a,'P-value',header=TRUE)
a<-table.row.end(a)
for (i in 1:par1) {
a<-table.row.start(a)
a<-table.element(a,i,header=TRUE)
a<-table.element(a,round(mypacf[i],6))
mytstat <- mypacf[i]*sqrtn
a<-table.element(a,round(mytstat,4))
a<-table.element(a,round(1-pt(abs(mytstat),lengthx),6))
a<-table.row.end(a)
}
a<-table.end(a)
table.save(a,file='mytable1.tab')