Free Statistics

of Irreproducible Research!

Author's title

Author*Unverified author*
R Software Modulerwasp_autocorrelation.wasp
Title produced by software(Partial) Autocorrelation Function
Date of computationSat, 21 May 2016 11:45:38 +0100
Cite this page as followsStatistical Computations at FreeStatistics.org, Office for Research Development and Education, URL https://freestatistics.org/blog/index.php?v=date/2016/May/21/t1463827662k32okgx3ghuunnp.htm/, Retrieved Mon, 20 May 2024 06:37:15 +0000
Statistical Computations at FreeStatistics.org, Office for Research Development and Education, URL https://freestatistics.org/blog/index.php?pk=295426, Retrieved Mon, 20 May 2024 06:37:15 +0000
QR Codes:

Original text written by user:
IsPrivate?No (this computation is public)
User-defined keywords
Estimated Impact95
Family? (F = Feedback message, R = changed R code, M = changed R Module, P = changed Parameters, D = changed Data)
-     [Classical Decomposition] [] [2016-04-25 20:57:38] [984d31b28aa27320c9bb8a4be001f13a]
- RMPD    [(Partial) Autocorrelation Function] [] [2016-05-21 10:45:38] [9d122f8260d20611f07666190c7f1fd6] [Current]
Feedback Forum

Post a new message
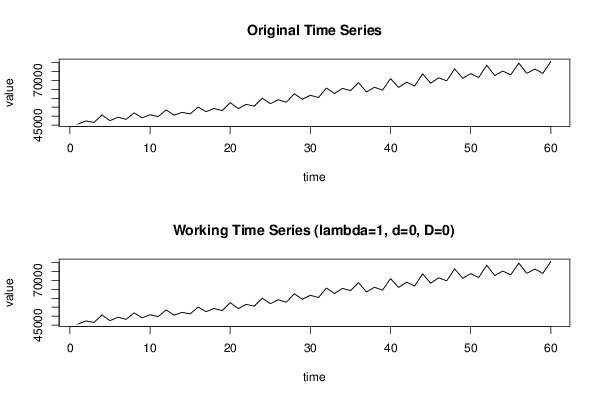
Dataseries X:
45564.6
47295.5
46465.5
50679.5
47452.8
49415.4
48165.3
51814
49030.7
50820.8
49729.5
53501.6
50524.9
52095
51290.3
55064
52505.2
54318.3
53039.6
57607.6
54236.4
56586.4
55614
60085.9
56963.5
59152.8
57804.6
62541.5
59449.3
61704.7
60399
65724.7
62679.4
65526.5
64274.8
68769.1
63542.8
66198
64544.9
71041.8
66087.2
69005.8
66897
73702
68485.3
71457
69774.6
76479.7
71204.7
73783.9
71651
78541.6
72714.4
75258
73168.1
79701.6
73944.5
76401.2
73948.1
80583.3


Summary of computational transaction
Raw Inputview raw input (R code)
Raw Outputview raw output of R engine
Computing time1 seconds
R Server'George Udny Yule' @ yule.wessa.net
R Framework error message
Warning: there are blank lines in the 'Data' field.
Please, use NA for missing data - blank lines are simply
 deleted and are NOT treated as missing values.

\begin{tabular}{lllllllll}
\hline
Summary of computational transaction \tabularnewline
Raw Input & view raw input (R code)  \tabularnewline
Raw Output & view raw output of R engine  \tabularnewline
Computing time & 1 seconds \tabularnewline
R Server & 'George Udny Yule' @ yule.wessa.net \tabularnewline
R Framework error message & 
Warning: there are blank lines in the 'Data' field.
Please, use NA for missing data - blank lines are simply
 deleted and are NOT treated as missing values.
\tabularnewline \hline \end{tabular} %Source: https://freestatistics.org/blog/index.php?pk=295426&T=0

[TABLE]
[ROW][C]Summary of computational transaction[/C][/ROW]
[ROW][C]Raw Input[/C][C]view raw input (R code) [/C][/ROW]
[ROW][C]Raw Output[/C][C]view raw output of R engine [/C][/ROW]
[ROW][C]Computing time[/C][C]1 seconds[/C][/ROW]
[ROW][C]R Server[/C][C]'George Udny Yule' @ yule.wessa.net[/C][/ROW]
[ROW][C]R Framework error message[/C][C]
Warning: there are blank lines in the 'Data' field.
Please, use NA for missing data - blank lines are simply
 deleted and are NOT treated as missing values.
[/C][/ROW] [/TABLE] Source: https://freestatistics.org/blog/index.php?pk=295426&T=0

Globally Unique Identifier (entire table): ba.freestatistics.org/blog/index.php?pk=295426&T=0

As an alternative you can also use a QR Code:  

The GUIDs for individual cells are displayed in the table below:

Summary of computational transaction
Raw Inputview raw input (R code)
Raw Outputview raw output of R engine
Computing time1 seconds
R Server'George Udny Yule' @ yule.wessa.net
R Framework error message
Warning: there are blank lines in the 'Data' field.
Please, use NA for missing data - blank lines are simply
 deleted and are NOT treated as missing values.


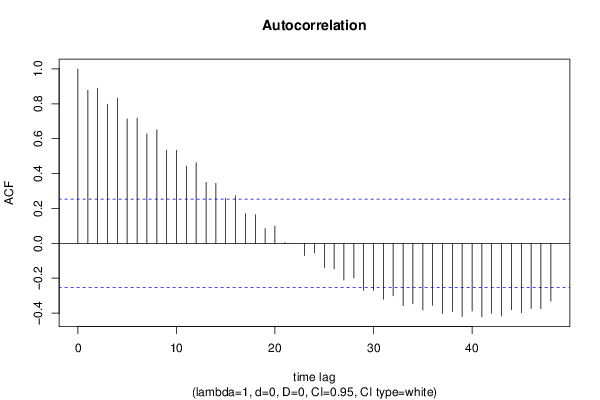
Autocorrelation Function
Time lag kACF(k)T-STATP-value
10.8783446.80360
20.8897516.8920
30.797876.18030
40.8321636.44590
50.7127825.52120
60.7178875.56070
70.6268254.85544e-06
80.6518135.04892e-06
90.5344594.13995.5e-05
100.5334434.1325.7e-05
110.4440183.43930.000533
120.4621643.57990.000344
130.3498522.70990.00438
140.3440542.6650.004937
150.258452.00190.024909
160.2733522.11740.019191
170.1693391.31170.09731
180.1646071.2750.103605
190.085140.65950.256051
200.0989740.76670.223147
210.0040640.03150.487496
22-0.000474-0.00370.498542
23-0.069629-0.53930.295822
24-0.055411-0.42920.334652
25-0.138841-1.07550.143238
26-0.14564-1.12810.131879
27-0.210242-1.62850.054327
28-0.19857-1.53810.064639
29-0.270436-2.09480.02021
30-0.269483-2.08740.020553
31-0.320166-2.480.007981
32-0.300949-2.33110.011562
33-0.35727-2.76740.003751
34-0.346833-2.68660.004663
35-0.382003-2.9590.002206
36-0.355313-2.75220.003909
37-0.402207-3.11550.001408
38-0.39099-3.02860.00181
39-0.419753-3.25140.000943
40-0.387849-3.00430.00194
41-0.420389-3.25630.000929
42-0.401198-3.10770.00144
43-0.417-3.23010.001005
44-0.380826-2.94990.002264
45-0.398298-3.08520.001537
46-0.373284-2.89140.002667
47-0.375161-2.9060.002561
48-0.331873-2.57070.006324

\begin{tabular}{lllllllll}
\hline
Autocorrelation Function \tabularnewline
Time lag k & ACF(k) & T-STAT & P-value \tabularnewline
1 & 0.878344 & 6.8036 & 0 \tabularnewline
2 & 0.889751 & 6.892 & 0 \tabularnewline
3 & 0.79787 & 6.1803 & 0 \tabularnewline
4 & 0.832163 & 6.4459 & 0 \tabularnewline
5 & 0.712782 & 5.5212 & 0 \tabularnewline
6 & 0.717887 & 5.5607 & 0 \tabularnewline
7 & 0.626825 & 4.8554 & 4e-06 \tabularnewline
8 & 0.651813 & 5.0489 & 2e-06 \tabularnewline
9 & 0.534459 & 4.1399 & 5.5e-05 \tabularnewline
10 & 0.533443 & 4.132 & 5.7e-05 \tabularnewline
11 & 0.444018 & 3.4393 & 0.000533 \tabularnewline
12 & 0.462164 & 3.5799 & 0.000344 \tabularnewline
13 & 0.349852 & 2.7099 & 0.00438 \tabularnewline
14 & 0.344054 & 2.665 & 0.004937 \tabularnewline
15 & 0.25845 & 2.0019 & 0.024909 \tabularnewline
16 & 0.273352 & 2.1174 & 0.019191 \tabularnewline
17 & 0.169339 & 1.3117 & 0.09731 \tabularnewline
18 & 0.164607 & 1.275 & 0.103605 \tabularnewline
19 & 0.08514 & 0.6595 & 0.256051 \tabularnewline
20 & 0.098974 & 0.7667 & 0.223147 \tabularnewline
21 & 0.004064 & 0.0315 & 0.487496 \tabularnewline
22 & -0.000474 & -0.0037 & 0.498542 \tabularnewline
23 & -0.069629 & -0.5393 & 0.295822 \tabularnewline
24 & -0.055411 & -0.4292 & 0.334652 \tabularnewline
25 & -0.138841 & -1.0755 & 0.143238 \tabularnewline
26 & -0.14564 & -1.1281 & 0.131879 \tabularnewline
27 & -0.210242 & -1.6285 & 0.054327 \tabularnewline
28 & -0.19857 & -1.5381 & 0.064639 \tabularnewline
29 & -0.270436 & -2.0948 & 0.02021 \tabularnewline
30 & -0.269483 & -2.0874 & 0.020553 \tabularnewline
31 & -0.320166 & -2.48 & 0.007981 \tabularnewline
32 & -0.300949 & -2.3311 & 0.011562 \tabularnewline
33 & -0.35727 & -2.7674 & 0.003751 \tabularnewline
34 & -0.346833 & -2.6866 & 0.004663 \tabularnewline
35 & -0.382003 & -2.959 & 0.002206 \tabularnewline
36 & -0.355313 & -2.7522 & 0.003909 \tabularnewline
37 & -0.402207 & -3.1155 & 0.001408 \tabularnewline
38 & -0.39099 & -3.0286 & 0.00181 \tabularnewline
39 & -0.419753 & -3.2514 & 0.000943 \tabularnewline
40 & -0.387849 & -3.0043 & 0.00194 \tabularnewline
41 & -0.420389 & -3.2563 & 0.000929 \tabularnewline
42 & -0.401198 & -3.1077 & 0.00144 \tabularnewline
43 & -0.417 & -3.2301 & 0.001005 \tabularnewline
44 & -0.380826 & -2.9499 & 0.002264 \tabularnewline
45 & -0.398298 & -3.0852 & 0.001537 \tabularnewline
46 & -0.373284 & -2.8914 & 0.002667 \tabularnewline
47 & -0.375161 & -2.906 & 0.002561 \tabularnewline
48 & -0.331873 & -2.5707 & 0.006324 \tabularnewline
\hline
\end{tabular}
%Source: https://freestatistics.org/blog/index.php?pk=295426&T=1

[TABLE]
[ROW][C]Autocorrelation Function[/C][/ROW]
[ROW][C]Time lag k[/C][C]ACF(k)[/C][C]T-STAT[/C][C]P-value[/C][/ROW]
[ROW][C]1[/C][C]0.878344[/C][C]6.8036[/C][C]0[/C][/ROW]
[ROW][C]2[/C][C]0.889751[/C][C]6.892[/C][C]0[/C][/ROW]
[ROW][C]3[/C][C]0.79787[/C][C]6.1803[/C][C]0[/C][/ROW]
[ROW][C]4[/C][C]0.832163[/C][C]6.4459[/C][C]0[/C][/ROW]
[ROW][C]5[/C][C]0.712782[/C][C]5.5212[/C][C]0[/C][/ROW]
[ROW][C]6[/C][C]0.717887[/C][C]5.5607[/C][C]0[/C][/ROW]
[ROW][C]7[/C][C]0.626825[/C][C]4.8554[/C][C]4e-06[/C][/ROW]
[ROW][C]8[/C][C]0.651813[/C][C]5.0489[/C][C]2e-06[/C][/ROW]
[ROW][C]9[/C][C]0.534459[/C][C]4.1399[/C][C]5.5e-05[/C][/ROW]
[ROW][C]10[/C][C]0.533443[/C][C]4.132[/C][C]5.7e-05[/C][/ROW]
[ROW][C]11[/C][C]0.444018[/C][C]3.4393[/C][C]0.000533[/C][/ROW]
[ROW][C]12[/C][C]0.462164[/C][C]3.5799[/C][C]0.000344[/C][/ROW]
[ROW][C]13[/C][C]0.349852[/C][C]2.7099[/C][C]0.00438[/C][/ROW]
[ROW][C]14[/C][C]0.344054[/C][C]2.665[/C][C]0.004937[/C][/ROW]
[ROW][C]15[/C][C]0.25845[/C][C]2.0019[/C][C]0.024909[/C][/ROW]
[ROW][C]16[/C][C]0.273352[/C][C]2.1174[/C][C]0.019191[/C][/ROW]
[ROW][C]17[/C][C]0.169339[/C][C]1.3117[/C][C]0.09731[/C][/ROW]
[ROW][C]18[/C][C]0.164607[/C][C]1.275[/C][C]0.103605[/C][/ROW]
[ROW][C]19[/C][C]0.08514[/C][C]0.6595[/C][C]0.256051[/C][/ROW]
[ROW][C]20[/C][C]0.098974[/C][C]0.7667[/C][C]0.223147[/C][/ROW]
[ROW][C]21[/C][C]0.004064[/C][C]0.0315[/C][C]0.487496[/C][/ROW]
[ROW][C]22[/C][C]-0.000474[/C][C]-0.0037[/C][C]0.498542[/C][/ROW]
[ROW][C]23[/C][C]-0.069629[/C][C]-0.5393[/C][C]0.295822[/C][/ROW]
[ROW][C]24[/C][C]-0.055411[/C][C]-0.4292[/C][C]0.334652[/C][/ROW]
[ROW][C]25[/C][C]-0.138841[/C][C]-1.0755[/C][C]0.143238[/C][/ROW]
[ROW][C]26[/C][C]-0.14564[/C][C]-1.1281[/C][C]0.131879[/C][/ROW]
[ROW][C]27[/C][C]-0.210242[/C][C]-1.6285[/C][C]0.054327[/C][/ROW]
[ROW][C]28[/C][C]-0.19857[/C][C]-1.5381[/C][C]0.064639[/C][/ROW]
[ROW][C]29[/C][C]-0.270436[/C][C]-2.0948[/C][C]0.02021[/C][/ROW]
[ROW][C]30[/C][C]-0.269483[/C][C]-2.0874[/C][C]0.020553[/C][/ROW]
[ROW][C]31[/C][C]-0.320166[/C][C]-2.48[/C][C]0.007981[/C][/ROW]
[ROW][C]32[/C][C]-0.300949[/C][C]-2.3311[/C][C]0.011562[/C][/ROW]
[ROW][C]33[/C][C]-0.35727[/C][C]-2.7674[/C][C]0.003751[/C][/ROW]
[ROW][C]34[/C][C]-0.346833[/C][C]-2.6866[/C][C]0.004663[/C][/ROW]
[ROW][C]35[/C][C]-0.382003[/C][C]-2.959[/C][C]0.002206[/C][/ROW]
[ROW][C]36[/C][C]-0.355313[/C][C]-2.7522[/C][C]0.003909[/C][/ROW]
[ROW][C]37[/C][C]-0.402207[/C][C]-3.1155[/C][C]0.001408[/C][/ROW]
[ROW][C]38[/C][C]-0.39099[/C][C]-3.0286[/C][C]0.00181[/C][/ROW]
[ROW][C]39[/C][C]-0.419753[/C][C]-3.2514[/C][C]0.000943[/C][/ROW]
[ROW][C]40[/C][C]-0.387849[/C][C]-3.0043[/C][C]0.00194[/C][/ROW]
[ROW][C]41[/C][C]-0.420389[/C][C]-3.2563[/C][C]0.000929[/C][/ROW]
[ROW][C]42[/C][C]-0.401198[/C][C]-3.1077[/C][C]0.00144[/C][/ROW]
[ROW][C]43[/C][C]-0.417[/C][C]-3.2301[/C][C]0.001005[/C][/ROW]
[ROW][C]44[/C][C]-0.380826[/C][C]-2.9499[/C][C]0.002264[/C][/ROW]
[ROW][C]45[/C][C]-0.398298[/C][C]-3.0852[/C][C]0.001537[/C][/ROW]
[ROW][C]46[/C][C]-0.373284[/C][C]-2.8914[/C][C]0.002667[/C][/ROW]
[ROW][C]47[/C][C]-0.375161[/C][C]-2.906[/C][C]0.002561[/C][/ROW]
[ROW][C]48[/C][C]-0.331873[/C][C]-2.5707[/C][C]0.006324[/C][/ROW]
[/TABLE]
Source: https://freestatistics.org/blog/index.php?pk=295426&T=1

Globally Unique Identifier (entire table): ba.freestatistics.org/blog/index.php?pk=295426&T=1

As an alternative you can also use a QR Code:  

The GUIDs for individual cells are displayed in the table below:

Autocorrelation Function
Time lag kACF(k)T-STATP-value
10.8783446.80360
20.8897516.8920
30.797876.18030
40.8321636.44590
50.7127825.52120
60.7178875.56070
70.6268254.85544e-06
80.6518135.04892e-06
90.5344594.13995.5e-05
100.5334434.1325.7e-05
110.4440183.43930.000533
120.4621643.57990.000344
130.3498522.70990.00438
140.3440542.6650.004937
150.258452.00190.024909
160.2733522.11740.019191
170.1693391.31170.09731
180.1646071.2750.103605
190.085140.65950.256051
200.0989740.76670.223147
210.0040640.03150.487496
22-0.000474-0.00370.498542
23-0.069629-0.53930.295822
24-0.055411-0.42920.334652
25-0.138841-1.07550.143238
26-0.14564-1.12810.131879
27-0.210242-1.62850.054327
28-0.19857-1.53810.064639
29-0.270436-2.09480.02021
30-0.269483-2.08740.020553
31-0.320166-2.480.007981
32-0.300949-2.33110.011562
33-0.35727-2.76740.003751
34-0.346833-2.68660.004663
35-0.382003-2.9590.002206
36-0.355313-2.75220.003909
37-0.402207-3.11550.001408
38-0.39099-3.02860.00181
39-0.419753-3.25140.000943
40-0.387849-3.00430.00194
41-0.420389-3.25630.000929
42-0.401198-3.10770.00144
43-0.417-3.23010.001005
44-0.380826-2.94990.002264
45-0.398298-3.08520.001537
46-0.373284-2.89140.002667
47-0.375161-2.9060.002561
48-0.331873-2.57070.006324


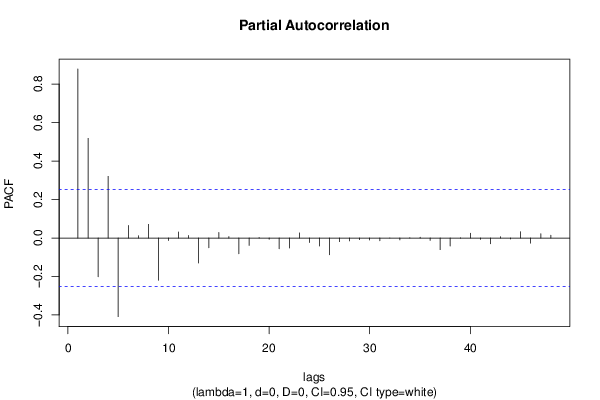
Partial Autocorrelation Function
Time lag kPACF(k)T-STATP-value
10.8783446.80360
20.5175344.00888.6e-05
3-0.201741-1.56270.061694
40.3202542.48070.007968
5-0.408616-3.16510.001218
60.0651730.50480.307763
70.0113520.08790.465111
80.0710310.55020.292112
9-0.219588-1.70090.047068
10-0.013062-0.10120.459873
110.0312660.24220.404732
120.0127830.0990.460726
13-0.13017-1.00830.158682
14-0.050984-0.39490.347151
150.0288450.22340.41198
160.0071160.05510.478113
17-0.082114-0.63610.263581
18-0.038408-0.29750.383553
190.001910.01480.494122
20-0.006453-0.050.48015
21-0.055439-0.42940.334575
22-0.052164-0.40410.343802
230.0265240.20550.418957
24-0.023134-0.17920.429195
25-0.041325-0.32010.375002
26-0.087421-0.67720.250453
27-0.018926-0.14660.441968
28-0.01493-0.11560.45416
29-0.00855-0.06620.473709
30-0.01045-0.08090.467876
31-0.0147-0.11390.454861
32-0.00014-0.00110.499569
33-0.009852-0.07630.469712
340.0017710.01370.494551
350.0035350.02740.489122
36-0.012228-0.09470.462427
37-0.060417-0.4680.320745
38-0.041853-0.32420.373459
39-0.001077-0.00830.496685
400.0251110.19450.423218
41-0.007295-0.05650.477564
42-0.030193-0.23390.407939
430.0064850.05020.480052
44-0.005085-0.03940.484357
450.0322040.24950.401932
46-0.026676-0.20660.418499
470.0225890.1750.430844
480.0147970.11460.454566

\begin{tabular}{lllllllll}
\hline
Partial Autocorrelation Function \tabularnewline
Time lag k & PACF(k) & T-STAT & P-value \tabularnewline
1 & 0.878344 & 6.8036 & 0 \tabularnewline
2 & 0.517534 & 4.0088 & 8.6e-05 \tabularnewline
3 & -0.201741 & -1.5627 & 0.061694 \tabularnewline
4 & 0.320254 & 2.4807 & 0.007968 \tabularnewline
5 & -0.408616 & -3.1651 & 0.001218 \tabularnewline
6 & 0.065173 & 0.5048 & 0.307763 \tabularnewline
7 & 0.011352 & 0.0879 & 0.465111 \tabularnewline
8 & 0.071031 & 0.5502 & 0.292112 \tabularnewline
9 & -0.219588 & -1.7009 & 0.047068 \tabularnewline
10 & -0.013062 & -0.1012 & 0.459873 \tabularnewline
11 & 0.031266 & 0.2422 & 0.404732 \tabularnewline
12 & 0.012783 & 0.099 & 0.460726 \tabularnewline
13 & -0.13017 & -1.0083 & 0.158682 \tabularnewline
14 & -0.050984 & -0.3949 & 0.347151 \tabularnewline
15 & 0.028845 & 0.2234 & 0.41198 \tabularnewline
16 & 0.007116 & 0.0551 & 0.478113 \tabularnewline
17 & -0.082114 & -0.6361 & 0.263581 \tabularnewline
18 & -0.038408 & -0.2975 & 0.383553 \tabularnewline
19 & 0.00191 & 0.0148 & 0.494122 \tabularnewline
20 & -0.006453 & -0.05 & 0.48015 \tabularnewline
21 & -0.055439 & -0.4294 & 0.334575 \tabularnewline
22 & -0.052164 & -0.4041 & 0.343802 \tabularnewline
23 & 0.026524 & 0.2055 & 0.418957 \tabularnewline
24 & -0.023134 & -0.1792 & 0.429195 \tabularnewline
25 & -0.041325 & -0.3201 & 0.375002 \tabularnewline
26 & -0.087421 & -0.6772 & 0.250453 \tabularnewline
27 & -0.018926 & -0.1466 & 0.441968 \tabularnewline
28 & -0.01493 & -0.1156 & 0.45416 \tabularnewline
29 & -0.00855 & -0.0662 & 0.473709 \tabularnewline
30 & -0.01045 & -0.0809 & 0.467876 \tabularnewline
31 & -0.0147 & -0.1139 & 0.454861 \tabularnewline
32 & -0.00014 & -0.0011 & 0.499569 \tabularnewline
33 & -0.009852 & -0.0763 & 0.469712 \tabularnewline
34 & 0.001771 & 0.0137 & 0.494551 \tabularnewline
35 & 0.003535 & 0.0274 & 0.489122 \tabularnewline
36 & -0.012228 & -0.0947 & 0.462427 \tabularnewline
37 & -0.060417 & -0.468 & 0.320745 \tabularnewline
38 & -0.041853 & -0.3242 & 0.373459 \tabularnewline
39 & -0.001077 & -0.0083 & 0.496685 \tabularnewline
40 & 0.025111 & 0.1945 & 0.423218 \tabularnewline
41 & -0.007295 & -0.0565 & 0.477564 \tabularnewline
42 & -0.030193 & -0.2339 & 0.407939 \tabularnewline
43 & 0.006485 & 0.0502 & 0.480052 \tabularnewline
44 & -0.005085 & -0.0394 & 0.484357 \tabularnewline
45 & 0.032204 & 0.2495 & 0.401932 \tabularnewline
46 & -0.026676 & -0.2066 & 0.418499 \tabularnewline
47 & 0.022589 & 0.175 & 0.430844 \tabularnewline
48 & 0.014797 & 0.1146 & 0.454566 \tabularnewline
\hline
\end{tabular}
%Source: https://freestatistics.org/blog/index.php?pk=295426&T=2

[TABLE]
[ROW][C]Partial Autocorrelation Function[/C][/ROW]
[ROW][C]Time lag k[/C][C]PACF(k)[/C][C]T-STAT[/C][C]P-value[/C][/ROW]
[ROW][C]1[/C][C]0.878344[/C][C]6.8036[/C][C]0[/C][/ROW]
[ROW][C]2[/C][C]0.517534[/C][C]4.0088[/C][C]8.6e-05[/C][/ROW]
[ROW][C]3[/C][C]-0.201741[/C][C]-1.5627[/C][C]0.061694[/C][/ROW]
[ROW][C]4[/C][C]0.320254[/C][C]2.4807[/C][C]0.007968[/C][/ROW]
[ROW][C]5[/C][C]-0.408616[/C][C]-3.1651[/C][C]0.001218[/C][/ROW]
[ROW][C]6[/C][C]0.065173[/C][C]0.5048[/C][C]0.307763[/C][/ROW]
[ROW][C]7[/C][C]0.011352[/C][C]0.0879[/C][C]0.465111[/C][/ROW]
[ROW][C]8[/C][C]0.071031[/C][C]0.5502[/C][C]0.292112[/C][/ROW]
[ROW][C]9[/C][C]-0.219588[/C][C]-1.7009[/C][C]0.047068[/C][/ROW]
[ROW][C]10[/C][C]-0.013062[/C][C]-0.1012[/C][C]0.459873[/C][/ROW]
[ROW][C]11[/C][C]0.031266[/C][C]0.2422[/C][C]0.404732[/C][/ROW]
[ROW][C]12[/C][C]0.012783[/C][C]0.099[/C][C]0.460726[/C][/ROW]
[ROW][C]13[/C][C]-0.13017[/C][C]-1.0083[/C][C]0.158682[/C][/ROW]
[ROW][C]14[/C][C]-0.050984[/C][C]-0.3949[/C][C]0.347151[/C][/ROW]
[ROW][C]15[/C][C]0.028845[/C][C]0.2234[/C][C]0.41198[/C][/ROW]
[ROW][C]16[/C][C]0.007116[/C][C]0.0551[/C][C]0.478113[/C][/ROW]
[ROW][C]17[/C][C]-0.082114[/C][C]-0.6361[/C][C]0.263581[/C][/ROW]
[ROW][C]18[/C][C]-0.038408[/C][C]-0.2975[/C][C]0.383553[/C][/ROW]
[ROW][C]19[/C][C]0.00191[/C][C]0.0148[/C][C]0.494122[/C][/ROW]
[ROW][C]20[/C][C]-0.006453[/C][C]-0.05[/C][C]0.48015[/C][/ROW]
[ROW][C]21[/C][C]-0.055439[/C][C]-0.4294[/C][C]0.334575[/C][/ROW]
[ROW][C]22[/C][C]-0.052164[/C][C]-0.4041[/C][C]0.343802[/C][/ROW]
[ROW][C]23[/C][C]0.026524[/C][C]0.2055[/C][C]0.418957[/C][/ROW]
[ROW][C]24[/C][C]-0.023134[/C][C]-0.1792[/C][C]0.429195[/C][/ROW]
[ROW][C]25[/C][C]-0.041325[/C][C]-0.3201[/C][C]0.375002[/C][/ROW]
[ROW][C]26[/C][C]-0.087421[/C][C]-0.6772[/C][C]0.250453[/C][/ROW]
[ROW][C]27[/C][C]-0.018926[/C][C]-0.1466[/C][C]0.441968[/C][/ROW]
[ROW][C]28[/C][C]-0.01493[/C][C]-0.1156[/C][C]0.45416[/C][/ROW]
[ROW][C]29[/C][C]-0.00855[/C][C]-0.0662[/C][C]0.473709[/C][/ROW]
[ROW][C]30[/C][C]-0.01045[/C][C]-0.0809[/C][C]0.467876[/C][/ROW]
[ROW][C]31[/C][C]-0.0147[/C][C]-0.1139[/C][C]0.454861[/C][/ROW]
[ROW][C]32[/C][C]-0.00014[/C][C]-0.0011[/C][C]0.499569[/C][/ROW]
[ROW][C]33[/C][C]-0.009852[/C][C]-0.0763[/C][C]0.469712[/C][/ROW]
[ROW][C]34[/C][C]0.001771[/C][C]0.0137[/C][C]0.494551[/C][/ROW]
[ROW][C]35[/C][C]0.003535[/C][C]0.0274[/C][C]0.489122[/C][/ROW]
[ROW][C]36[/C][C]-0.012228[/C][C]-0.0947[/C][C]0.462427[/C][/ROW]
[ROW][C]37[/C][C]-0.060417[/C][C]-0.468[/C][C]0.320745[/C][/ROW]
[ROW][C]38[/C][C]-0.041853[/C][C]-0.3242[/C][C]0.373459[/C][/ROW]
[ROW][C]39[/C][C]-0.001077[/C][C]-0.0083[/C][C]0.496685[/C][/ROW]
[ROW][C]40[/C][C]0.025111[/C][C]0.1945[/C][C]0.423218[/C][/ROW]
[ROW][C]41[/C][C]-0.007295[/C][C]-0.0565[/C][C]0.477564[/C][/ROW]
[ROW][C]42[/C][C]-0.030193[/C][C]-0.2339[/C][C]0.407939[/C][/ROW]
[ROW][C]43[/C][C]0.006485[/C][C]0.0502[/C][C]0.480052[/C][/ROW]
[ROW][C]44[/C][C]-0.005085[/C][C]-0.0394[/C][C]0.484357[/C][/ROW]
[ROW][C]45[/C][C]0.032204[/C][C]0.2495[/C][C]0.401932[/C][/ROW]
[ROW][C]46[/C][C]-0.026676[/C][C]-0.2066[/C][C]0.418499[/C][/ROW]
[ROW][C]47[/C][C]0.022589[/C][C]0.175[/C][C]0.430844[/C][/ROW]
[ROW][C]48[/C][C]0.014797[/C][C]0.1146[/C][C]0.454566[/C][/ROW]
[/TABLE]
Source: https://freestatistics.org/blog/index.php?pk=295426&T=2

Globally Unique Identifier (entire table): ba.freestatistics.org/blog/index.php?pk=295426&T=2

As an alternative you can also use a QR Code:  

The GUIDs for individual cells are displayed in the table below:

Partial Autocorrelation Function
Time lag kPACF(k)T-STATP-value
10.8783446.80360
20.5175344.00888.6e-05
3-0.201741-1.56270.061694
40.3202542.48070.007968
5-0.408616-3.16510.001218
60.0651730.50480.307763
70.0113520.08790.465111
80.0710310.55020.292112
9-0.219588-1.70090.047068
10-0.013062-0.10120.459873
110.0312660.24220.404732
120.0127830.0990.460726
13-0.13017-1.00830.158682
14-0.050984-0.39490.347151
150.0288450.22340.41198
160.0071160.05510.478113
17-0.082114-0.63610.263581
18-0.038408-0.29750.383553
190.001910.01480.494122
20-0.006453-0.050.48015
21-0.055439-0.42940.334575
22-0.052164-0.40410.343802
230.0265240.20550.418957
24-0.023134-0.17920.429195
25-0.041325-0.32010.375002
26-0.087421-0.67720.250453
27-0.018926-0.14660.441968
28-0.01493-0.11560.45416
29-0.00855-0.06620.473709
30-0.01045-0.08090.467876
31-0.0147-0.11390.454861
32-0.00014-0.00110.499569
33-0.009852-0.07630.469712
340.0017710.01370.494551
350.0035350.02740.489122
36-0.012228-0.09470.462427
37-0.060417-0.4680.320745
38-0.041853-0.32420.373459
39-0.001077-0.00830.496685
400.0251110.19450.423218
41-0.007295-0.05650.477564
42-0.030193-0.23390.407939
430.0064850.05020.480052
44-0.005085-0.03940.484357
450.0322040.24950.401932
46-0.026676-0.20660.418499
470.0225890.1750.430844
480.0147970.11460.454566


Parameters (Session):
par1 = 48 ; par2 = 1 ; par3 = 0 ; par4 = 0 ; par5 = 4 ; par6 = White Noise ; par7 = 0.95 ;
Parameters (R input):
par1 = 48 ; par2 = 1 ; par3 = 0 ; par4 = 0 ; par5 = 4 ; par6 = White Noise ; par7 = 0.95 ; par8 = ;
R code (references can be found in the software module):
if (par1 == 'Default') {
par1 = 10*log10(length(x))
} else {
par1 <- as.numeric(par1)
}
par2 <- as.numeric(par2)
par3 <- as.numeric(par3)
par4 <- as.numeric(par4)
par5 <- as.numeric(par5)
if (par6 == 'White Noise') par6 <- 'white' else par6 <- 'ma'
par7 <- as.numeric(par7)
if (par8 != '') par8 <- as.numeric(par8)
x <- na.omit(x)
ox <- x
if (par8 == '') {
if (par2 == 0) {
x <- log(x)
} else {
x <- (x ^ par2 - 1) / par2
}
} else {
x <- log(x,base=par8)
}
if (par3 > 0) x <- diff(x,lag=1,difference=par3)
if (par4 > 0) x <- diff(x,lag=par5,difference=par4)
bitmap(file='picts.png')
op <- par(mfrow=c(2,1))
plot(ox,type='l',main='Original Time Series',xlab='time',ylab='value')
if (par8=='') {
mytitle <- paste('Working Time Series (lambda=',par2,', d=',par3,', D=',par4,')',sep='')
mysub <- paste('(lambda=',par2,', d=',par3,', D=',par4,', CI=', par7, ', CI type=',par6,')',sep='')
} else {
mytitle <- paste('Working Time Series (base=',par8,', d=',par3,', D=',par4,')',sep='')
mysub <- paste('(base=',par8,', d=',par3,', D=',par4,', CI=', par7, ', CI type=',par6,')',sep='')
}
plot(x,type='l', main=mytitle,xlab='time',ylab='value')
par(op)
dev.off()
bitmap(file='pic1.png')
racf <- acf(x, par1, main='Autocorrelation', xlab='time lag', ylab='ACF', ci.type=par6, ci=par7, sub=mysub)
dev.off()
bitmap(file='pic2.png')
rpacf <- pacf(x,par1,main='Partial Autocorrelation',xlab='lags',ylab='PACF',sub=mysub)
dev.off()
(myacf <- c(racf$acf))
(mypacf <- c(rpacf$acf))
lengthx <- length(x)
sqrtn <- sqrt(lengthx)
load(file='createtable')
a<-table.start()
a<-table.row.start(a)
a<-table.element(a,'Autocorrelation Function',4,TRUE)
a<-table.row.end(a)
a<-table.row.start(a)
a<-table.element(a,'Time lag k',header=TRUE)
a<-table.element(a,hyperlink('basics.htm','ACF(k)','click here for more information about the Autocorrelation Function'),header=TRUE)
a<-table.element(a,'T-STAT',header=TRUE)
a<-table.element(a,'P-value',header=TRUE)
a<-table.row.end(a)
for (i in 2:(par1+1)) {
a<-table.row.start(a)
a<-table.element(a,i-1,header=TRUE)
a<-table.element(a,round(myacf[i],6))
mytstat <- myacf[i]*sqrtn
a<-table.element(a,round(mytstat,4))
a<-table.element(a,round(1-pt(abs(mytstat),lengthx),6))
a<-table.row.end(a)
}
a<-table.end(a)
table.save(a,file='mytable.tab')
a<-table.start()
a<-table.row.start(a)
a<-table.element(a,'Partial Autocorrelation Function',4,TRUE)
a<-table.row.end(a)
a<-table.row.start(a)
a<-table.element(a,'Time lag k',header=TRUE)
a<-table.element(a,hyperlink('basics.htm','PACF(k)','click here for more information about the Partial Autocorrelation Function'),header=TRUE)
a<-table.element(a,'T-STAT',header=TRUE)
a<-table.element(a,'P-value',header=TRUE)
a<-table.row.end(a)
for (i in 1:par1) {
a<-table.row.start(a)
a<-table.element(a,i,header=TRUE)
a<-table.element(a,round(mypacf[i],6))
mytstat <- mypacf[i]*sqrtn
a<-table.element(a,round(mytstat,4))
a<-table.element(a,round(1-pt(abs(mytstat),lengthx),6))
a<-table.row.end(a)
}
a<-table.end(a)
table.save(a,file='mytable1.tab')