Free Statistics

of Irreproducible Research!

Author's title

Author*Unverified author*
R Software Modulerwasp_exponentialsmoothing.wasp
Title produced by softwareExponential Smoothing
Date of computationMon, 23 May 2016 21:24:57 +0100
Cite this page as followsStatistical Computations at FreeStatistics.org, Office for Research Development and Education, URL https://freestatistics.org/blog/index.php?v=date/2016/May/23/t1464035186a45sfy2kevefbea.htm/, Retrieved Wed, 08 May 2024 02:34:00 +0000
Statistical Computations at FreeStatistics.org, Office for Research Development and Education, URL https://freestatistics.org/blog/index.php?pk=295532, Retrieved Wed, 08 May 2024 02:34:00 +0000
QR Codes:

Original text written by user:single gaf slechte voorspelling.
IsPrivate?No (this computation is public)
User-defined keywords
Estimated Impact133
Family? (F = Feedback message, R = changed R code, M = changed R Module, P = changed Parameters, D = changed Data)
-       [Exponential Smoothing] [Opgave 10 oef 2 D...] [2016-05-23 20:24:57] [8fd6d867e46a5221be3e0a22eb2f8c7a] [Current]
Feedback Forum

Post a new message
Dataseries X:
93.41
93
96.61
99.69
101.05
98
97.32
97.83
99.57
97.63
96.68
96.28
99.81
101.43
105.59
108.86
104.01
101.95
101.52
105.61
108.43
105.54
100.11
99.93
99.88
102.71
101.89
101.93
99.49
99.87
100.33
101.5
102.29
97.04
95.71
97.37
96.51
96.33
96.88
97.59
98.96
99.93
101.34
98.04
98.56
96.73
92.36
87.88
79.84
82.91
87.78
89.36
91.86
92.48
93.4
89.97
83.96
82.76
82.97
81.07


Summary of computational transaction
Raw Inputview raw input (R code)
Raw Outputview raw output of R engine
Computing time1 seconds
R Server'Sir Maurice George Kendall' @ kendall.wessa.net

\begin{tabular}{lllllllll}
\hline
Summary of computational transaction \tabularnewline
Raw Input & view raw input (R code)  \tabularnewline
Raw Output & view raw output of R engine  \tabularnewline
Computing time & 1 seconds \tabularnewline
R Server & 'Sir Maurice George Kendall' @ kendall.wessa.net \tabularnewline
\hline
\end{tabular}
%Source: https://freestatistics.org/blog/index.php?pk=295532&T=0

[TABLE]
[ROW][C]Summary of computational transaction[/C][/ROW]
[ROW][C]Raw Input[/C][C]view raw input (R code) [/C][/ROW]
[ROW][C]Raw Output[/C][C]view raw output of R engine [/C][/ROW]
[ROW][C]Computing time[/C][C]1 seconds[/C][/ROW]
[ROW][C]R Server[/C][C]'Sir Maurice George Kendall' @ kendall.wessa.net[/C][/ROW]
[/TABLE]
Source: https://freestatistics.org/blog/index.php?pk=295532&T=0

Globally Unique Identifier (entire table): ba.freestatistics.org/blog/index.php?pk=295532&T=0

As an alternative you can also use a QR Code:  

The GUIDs for individual cells are displayed in the table below:

Summary of computational transaction
Raw Inputview raw input (R code)
Raw Outputview raw output of R engine
Computing time1 seconds
R Server'Sir Maurice George Kendall' @ kendall.wessa.net


Estimated Parameters of Exponential Smoothing
ParameterValue
alpha1
beta0
gammaFALSE

\begin{tabular}{lllllllll}
\hline
Estimated Parameters of Exponential Smoothing \tabularnewline
Parameter & Value \tabularnewline
alpha & 1 \tabularnewline
beta & 0 \tabularnewline
gamma & FALSE \tabularnewline
\hline
\end{tabular}
%Source: https://freestatistics.org/blog/index.php?pk=295532&T=1

[TABLE]
[ROW][C]Estimated Parameters of Exponential Smoothing[/C][/ROW]
[ROW][C]Parameter[/C][C]Value[/C][/ROW]
[ROW][C]alpha[/C][C]1[/C][/ROW]
[ROW][C]beta[/C][C]0[/C][/ROW]
[ROW][C]gamma[/C][C]FALSE[/C][/ROW]
[/TABLE]
Source: https://freestatistics.org/blog/index.php?pk=295532&T=1

Globally Unique Identifier (entire table): ba.freestatistics.org/blog/index.php?pk=295532&T=1

As an alternative you can also use a QR Code:  

The GUIDs for individual cells are displayed in the table below:

Estimated Parameters of Exponential Smoothing
ParameterValue
alpha1
beta0
gammaFALSE


Interpolation Forecasts of Exponential Smoothing
tObservedFittedResiduals
396.6192.594.02
499.6996.23.48999999999999
5101.0599.281.77
698100.64-2.64
797.3297.59-0.27000000000001
897.8396.910.920000000000002
999.5797.422.14999999999999
1097.6399.16-1.53
1196.6897.22-0.539999999999992
1296.2896.270.00999999999999091
1399.8195.873.94
14101.4399.42.03
15105.59101.024.56999999999999
16108.86105.183.67999999999999
17104.01108.45-4.44
18101.95103.6-1.65000000000001
19101.52101.54-0.0200000000000102
20105.61101.114.5
21108.43105.23.23
22105.54108.02-2.48
23100.11105.13-5.02000000000001
2499.9399.70.230000000000004
2599.8899.520.359999999999985
26102.7199.473.23999999999999
27101.89102.3-0.409999999999997
28101.93101.480.450000000000003
2999.49101.52-2.03000000000002
3099.8799.080.790000000000006
31100.3399.460.86999999999999
32101.599.921.58
33102.29101.091.2
3497.04101.88-4.84
3595.7196.63-0.920000000000016
3697.3795.32.07000000000001
3796.5196.96-0.450000000000003
3896.3396.10.22999999999999
3996.8895.920.959999999999994
4097.5996.471.12
4198.9697.181.77999999999999
4299.9398.551.38000000000001
43101.3499.521.81999999999999
4498.04100.93-2.89
4598.5697.630.929999999999993
4696.7398.15-1.42
4792.3696.32-3.96000000000001
4887.8891.95-4.07000000000001
4979.8487.47-7.63
5082.9179.433.47999999999999
5187.7882.55.28
5289.3687.371.98999999999999
5391.8688.952.91
5492.4891.451.03
5593.492.071.33
5689.9792.99-3.02000000000001
5783.9689.56-5.60000000000001
5882.7683.55-0.789999999999992
5982.9782.350.61999999999999
6081.0782.56-1.49000000000001

\begin{tabular}{lllllllll}
\hline
Interpolation Forecasts of Exponential Smoothing \tabularnewline
t & Observed & Fitted & Residuals \tabularnewline
3 & 96.61 & 92.59 & 4.02 \tabularnewline
4 & 99.69 & 96.2 & 3.48999999999999 \tabularnewline
5 & 101.05 & 99.28 & 1.77 \tabularnewline
6 & 98 & 100.64 & -2.64 \tabularnewline
7 & 97.32 & 97.59 & -0.27000000000001 \tabularnewline
8 & 97.83 & 96.91 & 0.920000000000002 \tabularnewline
9 & 99.57 & 97.42 & 2.14999999999999 \tabularnewline
10 & 97.63 & 99.16 & -1.53 \tabularnewline
11 & 96.68 & 97.22 & -0.539999999999992 \tabularnewline
12 & 96.28 & 96.27 & 0.00999999999999091 \tabularnewline
13 & 99.81 & 95.87 & 3.94 \tabularnewline
14 & 101.43 & 99.4 & 2.03 \tabularnewline
15 & 105.59 & 101.02 & 4.56999999999999 \tabularnewline
16 & 108.86 & 105.18 & 3.67999999999999 \tabularnewline
17 & 104.01 & 108.45 & -4.44 \tabularnewline
18 & 101.95 & 103.6 & -1.65000000000001 \tabularnewline
19 & 101.52 & 101.54 & -0.0200000000000102 \tabularnewline
20 & 105.61 & 101.11 & 4.5 \tabularnewline
21 & 108.43 & 105.2 & 3.23 \tabularnewline
22 & 105.54 & 108.02 & -2.48 \tabularnewline
23 & 100.11 & 105.13 & -5.02000000000001 \tabularnewline
24 & 99.93 & 99.7 & 0.230000000000004 \tabularnewline
25 & 99.88 & 99.52 & 0.359999999999985 \tabularnewline
26 & 102.71 & 99.47 & 3.23999999999999 \tabularnewline
27 & 101.89 & 102.3 & -0.409999999999997 \tabularnewline
28 & 101.93 & 101.48 & 0.450000000000003 \tabularnewline
29 & 99.49 & 101.52 & -2.03000000000002 \tabularnewline
30 & 99.87 & 99.08 & 0.790000000000006 \tabularnewline
31 & 100.33 & 99.46 & 0.86999999999999 \tabularnewline
32 & 101.5 & 99.92 & 1.58 \tabularnewline
33 & 102.29 & 101.09 & 1.2 \tabularnewline
34 & 97.04 & 101.88 & -4.84 \tabularnewline
35 & 95.71 & 96.63 & -0.920000000000016 \tabularnewline
36 & 97.37 & 95.3 & 2.07000000000001 \tabularnewline
37 & 96.51 & 96.96 & -0.450000000000003 \tabularnewline
38 & 96.33 & 96.1 & 0.22999999999999 \tabularnewline
39 & 96.88 & 95.92 & 0.959999999999994 \tabularnewline
40 & 97.59 & 96.47 & 1.12 \tabularnewline
41 & 98.96 & 97.18 & 1.77999999999999 \tabularnewline
42 & 99.93 & 98.55 & 1.38000000000001 \tabularnewline
43 & 101.34 & 99.52 & 1.81999999999999 \tabularnewline
44 & 98.04 & 100.93 & -2.89 \tabularnewline
45 & 98.56 & 97.63 & 0.929999999999993 \tabularnewline
46 & 96.73 & 98.15 & -1.42 \tabularnewline
47 & 92.36 & 96.32 & -3.96000000000001 \tabularnewline
48 & 87.88 & 91.95 & -4.07000000000001 \tabularnewline
49 & 79.84 & 87.47 & -7.63 \tabularnewline
50 & 82.91 & 79.43 & 3.47999999999999 \tabularnewline
51 & 87.78 & 82.5 & 5.28 \tabularnewline
52 & 89.36 & 87.37 & 1.98999999999999 \tabularnewline
53 & 91.86 & 88.95 & 2.91 \tabularnewline
54 & 92.48 & 91.45 & 1.03 \tabularnewline
55 & 93.4 & 92.07 & 1.33 \tabularnewline
56 & 89.97 & 92.99 & -3.02000000000001 \tabularnewline
57 & 83.96 & 89.56 & -5.60000000000001 \tabularnewline
58 & 82.76 & 83.55 & -0.789999999999992 \tabularnewline
59 & 82.97 & 82.35 & 0.61999999999999 \tabularnewline
60 & 81.07 & 82.56 & -1.49000000000001 \tabularnewline
\hline
\end{tabular}
%Source: https://freestatistics.org/blog/index.php?pk=295532&T=2

[TABLE]
[ROW][C]Interpolation Forecasts of Exponential Smoothing[/C][/ROW]
[ROW][C]t[/C][C]Observed[/C][C]Fitted[/C][C]Residuals[/C][/ROW]
[ROW][C]3[/C][C]96.61[/C][C]92.59[/C][C]4.02[/C][/ROW]
[ROW][C]4[/C][C]99.69[/C][C]96.2[/C][C]3.48999999999999[/C][/ROW]
[ROW][C]5[/C][C]101.05[/C][C]99.28[/C][C]1.77[/C][/ROW]
[ROW][C]6[/C][C]98[/C][C]100.64[/C][C]-2.64[/C][/ROW]
[ROW][C]7[/C][C]97.32[/C][C]97.59[/C][C]-0.27000000000001[/C][/ROW]
[ROW][C]8[/C][C]97.83[/C][C]96.91[/C][C]0.920000000000002[/C][/ROW]
[ROW][C]9[/C][C]99.57[/C][C]97.42[/C][C]2.14999999999999[/C][/ROW]
[ROW][C]10[/C][C]97.63[/C][C]99.16[/C][C]-1.53[/C][/ROW]
[ROW][C]11[/C][C]96.68[/C][C]97.22[/C][C]-0.539999999999992[/C][/ROW]
[ROW][C]12[/C][C]96.28[/C][C]96.27[/C][C]0.00999999999999091[/C][/ROW]
[ROW][C]13[/C][C]99.81[/C][C]95.87[/C][C]3.94[/C][/ROW]
[ROW][C]14[/C][C]101.43[/C][C]99.4[/C][C]2.03[/C][/ROW]
[ROW][C]15[/C][C]105.59[/C][C]101.02[/C][C]4.56999999999999[/C][/ROW]
[ROW][C]16[/C][C]108.86[/C][C]105.18[/C][C]3.67999999999999[/C][/ROW]
[ROW][C]17[/C][C]104.01[/C][C]108.45[/C][C]-4.44[/C][/ROW]
[ROW][C]18[/C][C]101.95[/C][C]103.6[/C][C]-1.65000000000001[/C][/ROW]
[ROW][C]19[/C][C]101.52[/C][C]101.54[/C][C]-0.0200000000000102[/C][/ROW]
[ROW][C]20[/C][C]105.61[/C][C]101.11[/C][C]4.5[/C][/ROW]
[ROW][C]21[/C][C]108.43[/C][C]105.2[/C][C]3.23[/C][/ROW]
[ROW][C]22[/C][C]105.54[/C][C]108.02[/C][C]-2.48[/C][/ROW]
[ROW][C]23[/C][C]100.11[/C][C]105.13[/C][C]-5.02000000000001[/C][/ROW]
[ROW][C]24[/C][C]99.93[/C][C]99.7[/C][C]0.230000000000004[/C][/ROW]
[ROW][C]25[/C][C]99.88[/C][C]99.52[/C][C]0.359999999999985[/C][/ROW]
[ROW][C]26[/C][C]102.71[/C][C]99.47[/C][C]3.23999999999999[/C][/ROW]
[ROW][C]27[/C][C]101.89[/C][C]102.3[/C][C]-0.409999999999997[/C][/ROW]
[ROW][C]28[/C][C]101.93[/C][C]101.48[/C][C]0.450000000000003[/C][/ROW]
[ROW][C]29[/C][C]99.49[/C][C]101.52[/C][C]-2.03000000000002[/C][/ROW]
[ROW][C]30[/C][C]99.87[/C][C]99.08[/C][C]0.790000000000006[/C][/ROW]
[ROW][C]31[/C][C]100.33[/C][C]99.46[/C][C]0.86999999999999[/C][/ROW]
[ROW][C]32[/C][C]101.5[/C][C]99.92[/C][C]1.58[/C][/ROW]
[ROW][C]33[/C][C]102.29[/C][C]101.09[/C][C]1.2[/C][/ROW]
[ROW][C]34[/C][C]97.04[/C][C]101.88[/C][C]-4.84[/C][/ROW]
[ROW][C]35[/C][C]95.71[/C][C]96.63[/C][C]-0.920000000000016[/C][/ROW]
[ROW][C]36[/C][C]97.37[/C][C]95.3[/C][C]2.07000000000001[/C][/ROW]
[ROW][C]37[/C][C]96.51[/C][C]96.96[/C][C]-0.450000000000003[/C][/ROW]
[ROW][C]38[/C][C]96.33[/C][C]96.1[/C][C]0.22999999999999[/C][/ROW]
[ROW][C]39[/C][C]96.88[/C][C]95.92[/C][C]0.959999999999994[/C][/ROW]
[ROW][C]40[/C][C]97.59[/C][C]96.47[/C][C]1.12[/C][/ROW]
[ROW][C]41[/C][C]98.96[/C][C]97.18[/C][C]1.77999999999999[/C][/ROW]
[ROW][C]42[/C][C]99.93[/C][C]98.55[/C][C]1.38000000000001[/C][/ROW]
[ROW][C]43[/C][C]101.34[/C][C]99.52[/C][C]1.81999999999999[/C][/ROW]
[ROW][C]44[/C][C]98.04[/C][C]100.93[/C][C]-2.89[/C][/ROW]
[ROW][C]45[/C][C]98.56[/C][C]97.63[/C][C]0.929999999999993[/C][/ROW]
[ROW][C]46[/C][C]96.73[/C][C]98.15[/C][C]-1.42[/C][/ROW]
[ROW][C]47[/C][C]92.36[/C][C]96.32[/C][C]-3.96000000000001[/C][/ROW]
[ROW][C]48[/C][C]87.88[/C][C]91.95[/C][C]-4.07000000000001[/C][/ROW]
[ROW][C]49[/C][C]79.84[/C][C]87.47[/C][C]-7.63[/C][/ROW]
[ROW][C]50[/C][C]82.91[/C][C]79.43[/C][C]3.47999999999999[/C][/ROW]
[ROW][C]51[/C][C]87.78[/C][C]82.5[/C][C]5.28[/C][/ROW]
[ROW][C]52[/C][C]89.36[/C][C]87.37[/C][C]1.98999999999999[/C][/ROW]
[ROW][C]53[/C][C]91.86[/C][C]88.95[/C][C]2.91[/C][/ROW]
[ROW][C]54[/C][C]92.48[/C][C]91.45[/C][C]1.03[/C][/ROW]
[ROW][C]55[/C][C]93.4[/C][C]92.07[/C][C]1.33[/C][/ROW]
[ROW][C]56[/C][C]89.97[/C][C]92.99[/C][C]-3.02000000000001[/C][/ROW]
[ROW][C]57[/C][C]83.96[/C][C]89.56[/C][C]-5.60000000000001[/C][/ROW]
[ROW][C]58[/C][C]82.76[/C][C]83.55[/C][C]-0.789999999999992[/C][/ROW]
[ROW][C]59[/C][C]82.97[/C][C]82.35[/C][C]0.61999999999999[/C][/ROW]
[ROW][C]60[/C][C]81.07[/C][C]82.56[/C][C]-1.49000000000001[/C][/ROW]
[/TABLE]
Source: https://freestatistics.org/blog/index.php?pk=295532&T=2

Globally Unique Identifier (entire table): ba.freestatistics.org/blog/index.php?pk=295532&T=2

As an alternative you can also use a QR Code:  

The GUIDs for individual cells are displayed in the table below:

Interpolation Forecasts of Exponential Smoothing
tObservedFittedResiduals
396.6192.594.02
499.6996.23.48999999999999
5101.0599.281.77
698100.64-2.64
797.3297.59-0.27000000000001
897.8396.910.920000000000002
999.5797.422.14999999999999
1097.6399.16-1.53
1196.6897.22-0.539999999999992
1296.2896.270.00999999999999091
1399.8195.873.94
14101.4399.42.03
15105.59101.024.56999999999999
16108.86105.183.67999999999999
17104.01108.45-4.44
18101.95103.6-1.65000000000001
19101.52101.54-0.0200000000000102
20105.61101.114.5
21108.43105.23.23
22105.54108.02-2.48
23100.11105.13-5.02000000000001
2499.9399.70.230000000000004
2599.8899.520.359999999999985
26102.7199.473.23999999999999
27101.89102.3-0.409999999999997
28101.93101.480.450000000000003
2999.49101.52-2.03000000000002
3099.8799.080.790000000000006
31100.3399.460.86999999999999
32101.599.921.58
33102.29101.091.2
3497.04101.88-4.84
3595.7196.63-0.920000000000016
3697.3795.32.07000000000001
3796.5196.96-0.450000000000003
3896.3396.10.22999999999999
3996.8895.920.959999999999994
4097.5996.471.12
4198.9697.181.77999999999999
4299.9398.551.38000000000001
43101.3499.521.81999999999999
4498.04100.93-2.89
4598.5697.630.929999999999993
4696.7398.15-1.42
4792.3696.32-3.96000000000001
4887.8891.95-4.07000000000001
4979.8487.47-7.63
5082.9179.433.47999999999999
5187.7882.55.28
5289.3687.371.98999999999999
5391.8688.952.91
5492.4891.451.03
5593.492.071.33
5689.9792.99-3.02000000000001
5783.9689.56-5.60000000000001
5882.7683.55-0.789999999999992
5982.9782.350.61999999999999
6081.0782.56-1.49000000000001


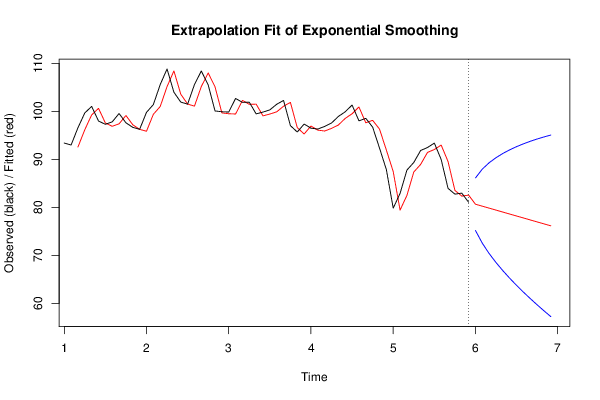
Extrapolation Forecasts of Exponential Smoothing
tForecast95% Lower Bound95% Upper Bound
6180.6675.194414255344586.1255857446555
6280.2572.520494513595287.9795054864048
6379.8470.373327797132589.3066722028675
6479.4368.498828510689190.3611714893109
6579.0266.798578738096691.2414212619035
6678.6165.222103780164591.9978962198356
6778.263.739419350341992.6605806496582
6877.7962.330989027190493.2490109728097
6977.3860.983242766033693.7767572339664
7076.9759.686300299941394.2536997000588
7176.5658.432702825462694.6872971745374
7276.1557.216655594265195.0833444057349

\begin{tabular}{lllllllll}
\hline
Extrapolation Forecasts of Exponential Smoothing \tabularnewline
t & Forecast & 95% Lower Bound & 95% Upper Bound \tabularnewline
61 & 80.66 & 75.1944142553445 & 86.1255857446555 \tabularnewline
62 & 80.25 & 72.5204945135952 & 87.9795054864048 \tabularnewline
63 & 79.84 & 70.3733277971325 & 89.3066722028675 \tabularnewline
64 & 79.43 & 68.4988285106891 & 90.3611714893109 \tabularnewline
65 & 79.02 & 66.7985787380966 & 91.2414212619035 \tabularnewline
66 & 78.61 & 65.2221037801645 & 91.9978962198356 \tabularnewline
67 & 78.2 & 63.7394193503419 & 92.6605806496582 \tabularnewline
68 & 77.79 & 62.3309890271904 & 93.2490109728097 \tabularnewline
69 & 77.38 & 60.9832427660336 & 93.7767572339664 \tabularnewline
70 & 76.97 & 59.6863002999413 & 94.2536997000588 \tabularnewline
71 & 76.56 & 58.4327028254626 & 94.6872971745374 \tabularnewline
72 & 76.15 & 57.2166555942651 & 95.0833444057349 \tabularnewline
\hline
\end{tabular}
%Source: https://freestatistics.org/blog/index.php?pk=295532&T=3

[TABLE]
[ROW][C]Extrapolation Forecasts of Exponential Smoothing[/C][/ROW]
[ROW][C]t[/C][C]Forecast[/C][C]95% Lower Bound[/C][C]95% Upper Bound[/C][/ROW]
[ROW][C]61[/C][C]80.66[/C][C]75.1944142553445[/C][C]86.1255857446555[/C][/ROW]
[ROW][C]62[/C][C]80.25[/C][C]72.5204945135952[/C][C]87.9795054864048[/C][/ROW]
[ROW][C]63[/C][C]79.84[/C][C]70.3733277971325[/C][C]89.3066722028675[/C][/ROW]
[ROW][C]64[/C][C]79.43[/C][C]68.4988285106891[/C][C]90.3611714893109[/C][/ROW]
[ROW][C]65[/C][C]79.02[/C][C]66.7985787380966[/C][C]91.2414212619035[/C][/ROW]
[ROW][C]66[/C][C]78.61[/C][C]65.2221037801645[/C][C]91.9978962198356[/C][/ROW]
[ROW][C]67[/C][C]78.2[/C][C]63.7394193503419[/C][C]92.6605806496582[/C][/ROW]
[ROW][C]68[/C][C]77.79[/C][C]62.3309890271904[/C][C]93.2490109728097[/C][/ROW]
[ROW][C]69[/C][C]77.38[/C][C]60.9832427660336[/C][C]93.7767572339664[/C][/ROW]
[ROW][C]70[/C][C]76.97[/C][C]59.6863002999413[/C][C]94.2536997000588[/C][/ROW]
[ROW][C]71[/C][C]76.56[/C][C]58.4327028254626[/C][C]94.6872971745374[/C][/ROW]
[ROW][C]72[/C][C]76.15[/C][C]57.2166555942651[/C][C]95.0833444057349[/C][/ROW]
[/TABLE]
Source: https://freestatistics.org/blog/index.php?pk=295532&T=3

Globally Unique Identifier (entire table): ba.freestatistics.org/blog/index.php?pk=295532&T=3

As an alternative you can also use a QR Code:  

The GUIDs for individual cells are displayed in the table below:

Extrapolation Forecasts of Exponential Smoothing
tForecast95% Lower Bound95% Upper Bound
6180.6675.194414255344586.1255857446555
6280.2572.520494513595287.9795054864048
6379.8470.373327797132589.3066722028675
6479.4368.498828510689190.3611714893109
6579.0266.798578738096691.2414212619035
6678.6165.222103780164591.9978962198356
6778.263.739419350341992.6605806496582
6877.7962.330989027190493.2490109728097
6977.3860.983242766033693.7767572339664
7076.9759.686300299941394.2536997000588
7176.5658.432702825462694.6872971745374
7276.1557.216655594265195.0833444057349


Parameters (Session):
par1 = 12 ; par2 = Double ; par3 = additive ;
Parameters (R input):
par1 = 12 ; par2 = Double ; par3 = additive ;
R code (references can be found in the software module):
par3 <- 'additive'
par2 <- 'Single'
par1 <- '12'
par1 <- as.numeric(par1)
if (par2 == 'Single') K <- 1
if (par2 == 'Double') K <- 2
if (par2 == 'Triple') K <- par1
nx <- length(x)
nxmK <- nx - K
x <- ts(x, frequency = par1)
if (par2 == 'Single') fit <- HoltWinters(x, gamma=F, beta=F)
if (par2 == 'Double') fit <- HoltWinters(x, gamma=F)
if (par2 == 'Triple') fit <- HoltWinters(x, seasonal=par3)
fit
myresid <- x - fit$fitted[,'xhat']
bitmap(file='test1.png')
op <- par(mfrow=c(2,1))
plot(fit,ylab='Observed (black) / Fitted (red)',main='Interpolation Fit of Exponential Smoothing')
plot(myresid,ylab='Residuals',main='Interpolation Prediction Errors')
par(op)
dev.off()
bitmap(file='test2.png')
p <- predict(fit, par1, prediction.interval=TRUE)
np <- length(p[,1])
plot(fit,p,ylab='Observed (black) / Fitted (red)',main='Extrapolation Fit of Exponential Smoothing')
dev.off()
bitmap(file='test3.png')
op <- par(mfrow = c(2,2))
acf(as.numeric(myresid),lag.max = nx/2,main='Residual ACF')
spectrum(myresid,main='Residals Periodogram')
cpgram(myresid,main='Residal Cumulative Periodogram')
qqnorm(myresid,main='Residual Normal QQ Plot')
qqline(myresid)
par(op)
dev.off()
load(file='createtable')
a<-table.start()
a<-table.row.start(a)
a<-table.element(a,'Estimated Parameters of Exponential Smoothing',2,TRUE)
a<-table.row.end(a)
a<-table.row.start(a)
a<-table.element(a,'Parameter',header=TRUE)
a<-table.element(a,'Value',header=TRUE)
a<-table.row.end(a)
a<-table.row.start(a)
a<-table.element(a,'alpha',header=TRUE)
a<-table.element(a,fit$alpha)
a<-table.row.end(a)
a<-table.row.start(a)
a<-table.element(a,'beta',header=TRUE)
a<-table.element(a,fit$beta)
a<-table.row.end(a)
a<-table.row.start(a)
a<-table.element(a,'gamma',header=TRUE)
a<-table.element(a,fit$gamma)
a<-table.row.end(a)
a<-table.end(a)
table.save(a,file='mytable.tab')
a<-table.start()
a<-table.row.start(a)
a<-table.element(a,'Interpolation Forecasts of Exponential Smoothing',4,TRUE)
a<-table.row.end(a)
a<-table.row.start(a)
a<-table.element(a,'t',header=TRUE)
a<-table.element(a,'Observed',header=TRUE)
a<-table.element(a,'Fitted',header=TRUE)
a<-table.element(a,'Residuals',header=TRUE)
a<-table.row.end(a)
for (i in 1:nxmK) {
a<-table.row.start(a)
a<-table.element(a,i+K,header=TRUE)
a<-table.element(a,x[i+K])
a<-table.element(a,fit$fitted[i,'xhat'])
a<-table.element(a,myresid[i])
a<-table.row.end(a)
}
a<-table.end(a)
table.save(a,file='mytable1.tab')
a<-table.start()
a<-table.row.start(a)
a<-table.element(a,'Extrapolation Forecasts of Exponential Smoothing',4,TRUE)
a<-table.row.end(a)
a<-table.row.start(a)
a<-table.element(a,'t',header=TRUE)
a<-table.element(a,'Forecast',header=TRUE)
a<-table.element(a,'95% Lower Bound',header=TRUE)
a<-table.element(a,'95% Upper Bound',header=TRUE)
a<-table.row.end(a)
for (i in 1:np) {
a<-table.row.start(a)
a<-table.element(a,nx+i,header=TRUE)
a<-table.element(a,p[i,'fit'])
a<-table.element(a,p[i,'lwr'])
a<-table.element(a,p[i,'upr'])
a<-table.row.end(a)
}
a<-table.end(a)
table.save(a,file='mytable2.tab')