Free Statistics

of Irreproducible Research!

Author's title

Author*Unverified author*
R Software Modulerwasp_autocorrelation.wasp
Title produced by software(Partial) Autocorrelation Function
Date of computationTue, 24 May 2016 16:15:39 +0100
Cite this page as followsStatistical Computations at FreeStatistics.org, Office for Research Development and Education, URL https://freestatistics.org/blog/index.php?v=date/2016/May/24/t14641030256uhb1i0em3d0o83.htm/, Retrieved Wed, 08 May 2024 18:43:35 +0000
Statistical Computations at FreeStatistics.org, Office for Research Development and Education, URL https://freestatistics.org/blog/index.php?pk=295559, Retrieved Wed, 08 May 2024 18:43:35 +0000
QR Codes:

Original text written by user:
IsPrivate?No (this computation is public)
User-defined keywords
Estimated Impact93
Family? (F = Feedback message, R = changed R code, M = changed R Module, P = changed Parameters, D = changed Data)
-       [(Partial) Autocorrelation Function] [] [2016-05-24 15:15:39] [be6cd4bb5de010eb7c002bb036e110fa] [Current]
Feedback Forum

Post a new message
Dataseries X:
81432
81935
82229
82963
82975
82892
82692
82648
83479
84176
84589
84857
84586
84635
84927
85563
86962
87780
88515
88800
89218
89626
89939
90663
91302
91560
92290
93281
94535
94855
95536
96008
96627
96738
96212
94198
93123
93022
93993
94876
95251
96216
96632
97023
97799
98001
98069
98172
98448
98157
98009
98020
97802
98006
98262
98629
99043
99289
99682
99979


Summary of computational transaction
Raw Inputview raw input (R code)
Raw Outputview raw output of R engine
Computing time2 seconds
R Server'George Udny Yule' @ yule.wessa.net

\begin{tabular}{lllllllll}
\hline
Summary of computational transaction \tabularnewline
Raw Input & view raw input (R code)  \tabularnewline
Raw Output & view raw output of R engine  \tabularnewline
Computing time & 2 seconds \tabularnewline
R Server & 'George Udny Yule' @ yule.wessa.net \tabularnewline
\hline
\end{tabular}
%Source: https://freestatistics.org/blog/index.php?pk=295559&T=0

[TABLE]
[ROW][C]Summary of computational transaction[/C][/ROW]
[ROW][C]Raw Input[/C][C]view raw input (R code) [/C][/ROW]
[ROW][C]Raw Output[/C][C]view raw output of R engine [/C][/ROW]
[ROW][C]Computing time[/C][C]2 seconds[/C][/ROW]
[ROW][C]R Server[/C][C]'George Udny Yule' @ yule.wessa.net[/C][/ROW]
[/TABLE]
Source: https://freestatistics.org/blog/index.php?pk=295559&T=0

Globally Unique Identifier (entire table): ba.freestatistics.org/blog/index.php?pk=295559&T=0

As an alternative you can also use a QR Code:  

The GUIDs for individual cells are displayed in the table below:

Summary of computational transaction
Raw Inputview raw input (R code)
Raw Outputview raw output of R engine
Computing time2 seconds
R Server'George Udny Yule' @ yule.wessa.net


Autocorrelation Function
Time lag kACF(k)T-STATP-value
10.953727.38750
20.9038367.00110
30.8526136.60430
40.8042236.22950
50.7565585.86030
60.7084935.4880
70.658865.10352e-06
80.608264.71168e-06
90.5598424.33652.8e-05
100.5139273.98099.4e-05
110.4671973.61890.000304
120.4181983.23930.000978
130.3660352.83530.003116
140.3111972.41050.009505
150.2542261.96920.026775
160.1973041.52830.065845
170.1471241.13960.129487
180.1001490.77580.220471
190.0572450.44340.32953
200.0194280.15050.440441
21-0.015422-0.11950.452656
22-0.045899-0.35550.361718
23-0.072759-0.56360.287568
24-0.098555-0.76340.224108
25-0.127-0.98370.164598
26-0.163417-1.26580.105235
27-0.199001-1.54150.064232
28-0.230257-1.78360.039776
29-0.254702-1.97290.026559
30-0.27791-2.15270.017687
31-0.297392-2.30360.012363
32-0.314793-2.43840.008866
33-0.324701-2.51510.007298
34-0.330414-2.55940.006512
35-0.335916-2.6020.005829
36-0.351145-2.720.004264
37-0.370297-2.86830.002844
38-0.388341-3.00810.001919
39-0.401662-3.11130.001425
40-0.410151-3.1770.001176
41-0.416325-3.22480.001021
42-0.417446-3.23350.000995
43-0.414395-3.20990.001067
44-0.406897-3.15180.001266
45-0.390585-3.02550.001826
46-0.371316-2.87620.002782
47-0.350875-2.71790.004288
48-0.330037-2.55650.006562

\begin{tabular}{lllllllll}
\hline
Autocorrelation Function \tabularnewline
Time lag k & ACF(k) & T-STAT & P-value \tabularnewline
1 & 0.95372 & 7.3875 & 0 \tabularnewline
2 & 0.903836 & 7.0011 & 0 \tabularnewline
3 & 0.852613 & 6.6043 & 0 \tabularnewline
4 & 0.804223 & 6.2295 & 0 \tabularnewline
5 & 0.756558 & 5.8603 & 0 \tabularnewline
6 & 0.708493 & 5.488 & 0 \tabularnewline
7 & 0.65886 & 5.1035 & 2e-06 \tabularnewline
8 & 0.60826 & 4.7116 & 8e-06 \tabularnewline
9 & 0.559842 & 4.3365 & 2.8e-05 \tabularnewline
10 & 0.513927 & 3.9809 & 9.4e-05 \tabularnewline
11 & 0.467197 & 3.6189 & 0.000304 \tabularnewline
12 & 0.418198 & 3.2393 & 0.000978 \tabularnewline
13 & 0.366035 & 2.8353 & 0.003116 \tabularnewline
14 & 0.311197 & 2.4105 & 0.009505 \tabularnewline
15 & 0.254226 & 1.9692 & 0.026775 \tabularnewline
16 & 0.197304 & 1.5283 & 0.065845 \tabularnewline
17 & 0.147124 & 1.1396 & 0.129487 \tabularnewline
18 & 0.100149 & 0.7758 & 0.220471 \tabularnewline
19 & 0.057245 & 0.4434 & 0.32953 \tabularnewline
20 & 0.019428 & 0.1505 & 0.440441 \tabularnewline
21 & -0.015422 & -0.1195 & 0.452656 \tabularnewline
22 & -0.045899 & -0.3555 & 0.361718 \tabularnewline
23 & -0.072759 & -0.5636 & 0.287568 \tabularnewline
24 & -0.098555 & -0.7634 & 0.224108 \tabularnewline
25 & -0.127 & -0.9837 & 0.164598 \tabularnewline
26 & -0.163417 & -1.2658 & 0.105235 \tabularnewline
27 & -0.199001 & -1.5415 & 0.064232 \tabularnewline
28 & -0.230257 & -1.7836 & 0.039776 \tabularnewline
29 & -0.254702 & -1.9729 & 0.026559 \tabularnewline
30 & -0.27791 & -2.1527 & 0.017687 \tabularnewline
31 & -0.297392 & -2.3036 & 0.012363 \tabularnewline
32 & -0.314793 & -2.4384 & 0.008866 \tabularnewline
33 & -0.324701 & -2.5151 & 0.007298 \tabularnewline
34 & -0.330414 & -2.5594 & 0.006512 \tabularnewline
35 & -0.335916 & -2.602 & 0.005829 \tabularnewline
36 & -0.351145 & -2.72 & 0.004264 \tabularnewline
37 & -0.370297 & -2.8683 & 0.002844 \tabularnewline
38 & -0.388341 & -3.0081 & 0.001919 \tabularnewline
39 & -0.401662 & -3.1113 & 0.001425 \tabularnewline
40 & -0.410151 & -3.177 & 0.001176 \tabularnewline
41 & -0.416325 & -3.2248 & 0.001021 \tabularnewline
42 & -0.417446 & -3.2335 & 0.000995 \tabularnewline
43 & -0.414395 & -3.2099 & 0.001067 \tabularnewline
44 & -0.406897 & -3.1518 & 0.001266 \tabularnewline
45 & -0.390585 & -3.0255 & 0.001826 \tabularnewline
46 & -0.371316 & -2.8762 & 0.002782 \tabularnewline
47 & -0.350875 & -2.7179 & 0.004288 \tabularnewline
48 & -0.330037 & -2.5565 & 0.006562 \tabularnewline
\hline
\end{tabular}
%Source: https://freestatistics.org/blog/index.php?pk=295559&T=1

[TABLE]
[ROW][C]Autocorrelation Function[/C][/ROW]
[ROW][C]Time lag k[/C][C]ACF(k)[/C][C]T-STAT[/C][C]P-value[/C][/ROW]
[ROW][C]1[/C][C]0.95372[/C][C]7.3875[/C][C]0[/C][/ROW]
[ROW][C]2[/C][C]0.903836[/C][C]7.0011[/C][C]0[/C][/ROW]
[ROW][C]3[/C][C]0.852613[/C][C]6.6043[/C][C]0[/C][/ROW]
[ROW][C]4[/C][C]0.804223[/C][C]6.2295[/C][C]0[/C][/ROW]
[ROW][C]5[/C][C]0.756558[/C][C]5.8603[/C][C]0[/C][/ROW]
[ROW][C]6[/C][C]0.708493[/C][C]5.488[/C][C]0[/C][/ROW]
[ROW][C]7[/C][C]0.65886[/C][C]5.1035[/C][C]2e-06[/C][/ROW]
[ROW][C]8[/C][C]0.60826[/C][C]4.7116[/C][C]8e-06[/C][/ROW]
[ROW][C]9[/C][C]0.559842[/C][C]4.3365[/C][C]2.8e-05[/C][/ROW]
[ROW][C]10[/C][C]0.513927[/C][C]3.9809[/C][C]9.4e-05[/C][/ROW]
[ROW][C]11[/C][C]0.467197[/C][C]3.6189[/C][C]0.000304[/C][/ROW]
[ROW][C]12[/C][C]0.418198[/C][C]3.2393[/C][C]0.000978[/C][/ROW]
[ROW][C]13[/C][C]0.366035[/C][C]2.8353[/C][C]0.003116[/C][/ROW]
[ROW][C]14[/C][C]0.311197[/C][C]2.4105[/C][C]0.009505[/C][/ROW]
[ROW][C]15[/C][C]0.254226[/C][C]1.9692[/C][C]0.026775[/C][/ROW]
[ROW][C]16[/C][C]0.197304[/C][C]1.5283[/C][C]0.065845[/C][/ROW]
[ROW][C]17[/C][C]0.147124[/C][C]1.1396[/C][C]0.129487[/C][/ROW]
[ROW][C]18[/C][C]0.100149[/C][C]0.7758[/C][C]0.220471[/C][/ROW]
[ROW][C]19[/C][C]0.057245[/C][C]0.4434[/C][C]0.32953[/C][/ROW]
[ROW][C]20[/C][C]0.019428[/C][C]0.1505[/C][C]0.440441[/C][/ROW]
[ROW][C]21[/C][C]-0.015422[/C][C]-0.1195[/C][C]0.452656[/C][/ROW]
[ROW][C]22[/C][C]-0.045899[/C][C]-0.3555[/C][C]0.361718[/C][/ROW]
[ROW][C]23[/C][C]-0.072759[/C][C]-0.5636[/C][C]0.287568[/C][/ROW]
[ROW][C]24[/C][C]-0.098555[/C][C]-0.7634[/C][C]0.224108[/C][/ROW]
[ROW][C]25[/C][C]-0.127[/C][C]-0.9837[/C][C]0.164598[/C][/ROW]
[ROW][C]26[/C][C]-0.163417[/C][C]-1.2658[/C][C]0.105235[/C][/ROW]
[ROW][C]27[/C][C]-0.199001[/C][C]-1.5415[/C][C]0.064232[/C][/ROW]
[ROW][C]28[/C][C]-0.230257[/C][C]-1.7836[/C][C]0.039776[/C][/ROW]
[ROW][C]29[/C][C]-0.254702[/C][C]-1.9729[/C][C]0.026559[/C][/ROW]
[ROW][C]30[/C][C]-0.27791[/C][C]-2.1527[/C][C]0.017687[/C][/ROW]
[ROW][C]31[/C][C]-0.297392[/C][C]-2.3036[/C][C]0.012363[/C][/ROW]
[ROW][C]32[/C][C]-0.314793[/C][C]-2.4384[/C][C]0.008866[/C][/ROW]
[ROW][C]33[/C][C]-0.324701[/C][C]-2.5151[/C][C]0.007298[/C][/ROW]
[ROW][C]34[/C][C]-0.330414[/C][C]-2.5594[/C][C]0.006512[/C][/ROW]
[ROW][C]35[/C][C]-0.335916[/C][C]-2.602[/C][C]0.005829[/C][/ROW]
[ROW][C]36[/C][C]-0.351145[/C][C]-2.72[/C][C]0.004264[/C][/ROW]
[ROW][C]37[/C][C]-0.370297[/C][C]-2.8683[/C][C]0.002844[/C][/ROW]
[ROW][C]38[/C][C]-0.388341[/C][C]-3.0081[/C][C]0.001919[/C][/ROW]
[ROW][C]39[/C][C]-0.401662[/C][C]-3.1113[/C][C]0.001425[/C][/ROW]
[ROW][C]40[/C][C]-0.410151[/C][C]-3.177[/C][C]0.001176[/C][/ROW]
[ROW][C]41[/C][C]-0.416325[/C][C]-3.2248[/C][C]0.001021[/C][/ROW]
[ROW][C]42[/C][C]-0.417446[/C][C]-3.2335[/C][C]0.000995[/C][/ROW]
[ROW][C]43[/C][C]-0.414395[/C][C]-3.2099[/C][C]0.001067[/C][/ROW]
[ROW][C]44[/C][C]-0.406897[/C][C]-3.1518[/C][C]0.001266[/C][/ROW]
[ROW][C]45[/C][C]-0.390585[/C][C]-3.0255[/C][C]0.001826[/C][/ROW]
[ROW][C]46[/C][C]-0.371316[/C][C]-2.8762[/C][C]0.002782[/C][/ROW]
[ROW][C]47[/C][C]-0.350875[/C][C]-2.7179[/C][C]0.004288[/C][/ROW]
[ROW][C]48[/C][C]-0.330037[/C][C]-2.5565[/C][C]0.006562[/C][/ROW]
[/TABLE]
Source: https://freestatistics.org/blog/index.php?pk=295559&T=1

Globally Unique Identifier (entire table): ba.freestatistics.org/blog/index.php?pk=295559&T=1

As an alternative you can also use a QR Code:  

The GUIDs for individual cells are displayed in the table below:

Autocorrelation Function
Time lag kACF(k)T-STATP-value
10.953727.38750
20.9038367.00110
30.8526136.60430
40.8042236.22950
50.7565585.86030
60.7084935.4880
70.658865.10352e-06
80.608264.71168e-06
90.5598424.33652.8e-05
100.5139273.98099.4e-05
110.4671973.61890.000304
120.4181983.23930.000978
130.3660352.83530.003116
140.3111972.41050.009505
150.2542261.96920.026775
160.1973041.52830.065845
170.1471241.13960.129487
180.1001490.77580.220471
190.0572450.44340.32953
200.0194280.15050.440441
21-0.015422-0.11950.452656
22-0.045899-0.35550.361718
23-0.072759-0.56360.287568
24-0.098555-0.76340.224108
25-0.127-0.98370.164598
26-0.163417-1.26580.105235
27-0.199001-1.54150.064232
28-0.230257-1.78360.039776
29-0.254702-1.97290.026559
30-0.27791-2.15270.017687
31-0.297392-2.30360.012363
32-0.314793-2.43840.008866
33-0.324701-2.51510.007298
34-0.330414-2.55940.006512
35-0.335916-2.6020.005829
36-0.351145-2.720.004264
37-0.370297-2.86830.002844
38-0.388341-3.00810.001919
39-0.401662-3.11130.001425
40-0.410151-3.1770.001176
41-0.416325-3.22480.001021
42-0.417446-3.23350.000995
43-0.414395-3.20990.001067
44-0.406897-3.15180.001266
45-0.390585-3.02550.001826
46-0.371316-2.87620.002782
47-0.350875-2.71790.004288
48-0.330037-2.55650.006562


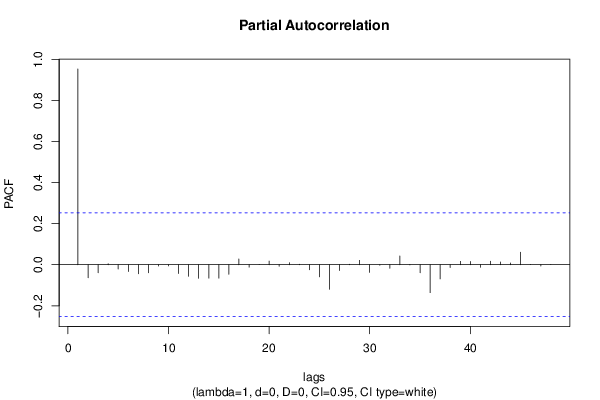
Partial Autocorrelation Function
Time lag kPACF(k)T-STATP-value
10.953727.38750
2-0.063554-0.49230.312157
3-0.039598-0.30670.380058
40.0048920.03790.48495
5-0.020925-0.16210.435893
6-0.033044-0.2560.39943
7-0.044479-0.34450.365826
8-0.038897-0.30130.382116
9-0.006089-0.04720.481268
10-0.005636-0.04370.482663
11-0.043057-0.33350.369952
12-0.055934-0.43330.333189
13-0.065711-0.5090.306311
14-0.065311-0.50590.307392
15-0.065547-0.50770.306755
16-0.046413-0.35950.360236
170.0277680.21510.415214
18-0.011758-0.09110.463867
190.0005910.00460.498181
200.0174740.13540.446394
21-0.007834-0.06070.475907
220.009310.07210.471376
230.0021760.01690.493303
24-0.024779-0.19190.424219
25-0.059119-0.45790.324328
26-0.119473-0.92540.179224
27-0.028629-0.22180.412628
280.0019990.01550.493848
290.0210720.16320.435446
30-0.037428-0.28990.386439
31-0.003064-0.02370.490571
32-0.017538-0.13580.446199
330.0421870.32680.372485
34-0.000682-0.00530.497903
35-0.039592-0.30670.380074
36-0.135937-1.0530.14829
37-0.068968-0.53420.297581
38-0.013978-0.10830.45707
390.0161710.12530.450368
400.0159340.12340.451091
41-0.012375-0.09590.461976
420.0169680.13140.447936
430.0131880.10220.459487
440.0086620.06710.473364
450.0603640.46760.320889
460.0003810.0030.498826
47-0.00619-0.0480.480957
480.0004180.00320.498715

\begin{tabular}{lllllllll}
\hline
Partial Autocorrelation Function \tabularnewline
Time lag k & PACF(k) & T-STAT & P-value \tabularnewline
1 & 0.95372 & 7.3875 & 0 \tabularnewline
2 & -0.063554 & -0.4923 & 0.312157 \tabularnewline
3 & -0.039598 & -0.3067 & 0.380058 \tabularnewline
4 & 0.004892 & 0.0379 & 0.48495 \tabularnewline
5 & -0.020925 & -0.1621 & 0.435893 \tabularnewline
6 & -0.033044 & -0.256 & 0.39943 \tabularnewline
7 & -0.044479 & -0.3445 & 0.365826 \tabularnewline
8 & -0.038897 & -0.3013 & 0.382116 \tabularnewline
9 & -0.006089 & -0.0472 & 0.481268 \tabularnewline
10 & -0.005636 & -0.0437 & 0.482663 \tabularnewline
11 & -0.043057 & -0.3335 & 0.369952 \tabularnewline
12 & -0.055934 & -0.4333 & 0.333189 \tabularnewline
13 & -0.065711 & -0.509 & 0.306311 \tabularnewline
14 & -0.065311 & -0.5059 & 0.307392 \tabularnewline
15 & -0.065547 & -0.5077 & 0.306755 \tabularnewline
16 & -0.046413 & -0.3595 & 0.360236 \tabularnewline
17 & 0.027768 & 0.2151 & 0.415214 \tabularnewline
18 & -0.011758 & -0.0911 & 0.463867 \tabularnewline
19 & 0.000591 & 0.0046 & 0.498181 \tabularnewline
20 & 0.017474 & 0.1354 & 0.446394 \tabularnewline
21 & -0.007834 & -0.0607 & 0.475907 \tabularnewline
22 & 0.00931 & 0.0721 & 0.471376 \tabularnewline
23 & 0.002176 & 0.0169 & 0.493303 \tabularnewline
24 & -0.024779 & -0.1919 & 0.424219 \tabularnewline
25 & -0.059119 & -0.4579 & 0.324328 \tabularnewline
26 & -0.119473 & -0.9254 & 0.179224 \tabularnewline
27 & -0.028629 & -0.2218 & 0.412628 \tabularnewline
28 & 0.001999 & 0.0155 & 0.493848 \tabularnewline
29 & 0.021072 & 0.1632 & 0.435446 \tabularnewline
30 & -0.037428 & -0.2899 & 0.386439 \tabularnewline
31 & -0.003064 & -0.0237 & 0.490571 \tabularnewline
32 & -0.017538 & -0.1358 & 0.446199 \tabularnewline
33 & 0.042187 & 0.3268 & 0.372485 \tabularnewline
34 & -0.000682 & -0.0053 & 0.497903 \tabularnewline
35 & -0.039592 & -0.3067 & 0.380074 \tabularnewline
36 & -0.135937 & -1.053 & 0.14829 \tabularnewline
37 & -0.068968 & -0.5342 & 0.297581 \tabularnewline
38 & -0.013978 & -0.1083 & 0.45707 \tabularnewline
39 & 0.016171 & 0.1253 & 0.450368 \tabularnewline
40 & 0.015934 & 0.1234 & 0.451091 \tabularnewline
41 & -0.012375 & -0.0959 & 0.461976 \tabularnewline
42 & 0.016968 & 0.1314 & 0.447936 \tabularnewline
43 & 0.013188 & 0.1022 & 0.459487 \tabularnewline
44 & 0.008662 & 0.0671 & 0.473364 \tabularnewline
45 & 0.060364 & 0.4676 & 0.320889 \tabularnewline
46 & 0.000381 & 0.003 & 0.498826 \tabularnewline
47 & -0.00619 & -0.048 & 0.480957 \tabularnewline
48 & 0.000418 & 0.0032 & 0.498715 \tabularnewline
\hline
\end{tabular}
%Source: https://freestatistics.org/blog/index.php?pk=295559&T=2

[TABLE]
[ROW][C]Partial Autocorrelation Function[/C][/ROW]
[ROW][C]Time lag k[/C][C]PACF(k)[/C][C]T-STAT[/C][C]P-value[/C][/ROW]
[ROW][C]1[/C][C]0.95372[/C][C]7.3875[/C][C]0[/C][/ROW]
[ROW][C]2[/C][C]-0.063554[/C][C]-0.4923[/C][C]0.312157[/C][/ROW]
[ROW][C]3[/C][C]-0.039598[/C][C]-0.3067[/C][C]0.380058[/C][/ROW]
[ROW][C]4[/C][C]0.004892[/C][C]0.0379[/C][C]0.48495[/C][/ROW]
[ROW][C]5[/C][C]-0.020925[/C][C]-0.1621[/C][C]0.435893[/C][/ROW]
[ROW][C]6[/C][C]-0.033044[/C][C]-0.256[/C][C]0.39943[/C][/ROW]
[ROW][C]7[/C][C]-0.044479[/C][C]-0.3445[/C][C]0.365826[/C][/ROW]
[ROW][C]8[/C][C]-0.038897[/C][C]-0.3013[/C][C]0.382116[/C][/ROW]
[ROW][C]9[/C][C]-0.006089[/C][C]-0.0472[/C][C]0.481268[/C][/ROW]
[ROW][C]10[/C][C]-0.005636[/C][C]-0.0437[/C][C]0.482663[/C][/ROW]
[ROW][C]11[/C][C]-0.043057[/C][C]-0.3335[/C][C]0.369952[/C][/ROW]
[ROW][C]12[/C][C]-0.055934[/C][C]-0.4333[/C][C]0.333189[/C][/ROW]
[ROW][C]13[/C][C]-0.065711[/C][C]-0.509[/C][C]0.306311[/C][/ROW]
[ROW][C]14[/C][C]-0.065311[/C][C]-0.5059[/C][C]0.307392[/C][/ROW]
[ROW][C]15[/C][C]-0.065547[/C][C]-0.5077[/C][C]0.306755[/C][/ROW]
[ROW][C]16[/C][C]-0.046413[/C][C]-0.3595[/C][C]0.360236[/C][/ROW]
[ROW][C]17[/C][C]0.027768[/C][C]0.2151[/C][C]0.415214[/C][/ROW]
[ROW][C]18[/C][C]-0.011758[/C][C]-0.0911[/C][C]0.463867[/C][/ROW]
[ROW][C]19[/C][C]0.000591[/C][C]0.0046[/C][C]0.498181[/C][/ROW]
[ROW][C]20[/C][C]0.017474[/C][C]0.1354[/C][C]0.446394[/C][/ROW]
[ROW][C]21[/C][C]-0.007834[/C][C]-0.0607[/C][C]0.475907[/C][/ROW]
[ROW][C]22[/C][C]0.00931[/C][C]0.0721[/C][C]0.471376[/C][/ROW]
[ROW][C]23[/C][C]0.002176[/C][C]0.0169[/C][C]0.493303[/C][/ROW]
[ROW][C]24[/C][C]-0.024779[/C][C]-0.1919[/C][C]0.424219[/C][/ROW]
[ROW][C]25[/C][C]-0.059119[/C][C]-0.4579[/C][C]0.324328[/C][/ROW]
[ROW][C]26[/C][C]-0.119473[/C][C]-0.9254[/C][C]0.179224[/C][/ROW]
[ROW][C]27[/C][C]-0.028629[/C][C]-0.2218[/C][C]0.412628[/C][/ROW]
[ROW][C]28[/C][C]0.001999[/C][C]0.0155[/C][C]0.493848[/C][/ROW]
[ROW][C]29[/C][C]0.021072[/C][C]0.1632[/C][C]0.435446[/C][/ROW]
[ROW][C]30[/C][C]-0.037428[/C][C]-0.2899[/C][C]0.386439[/C][/ROW]
[ROW][C]31[/C][C]-0.003064[/C][C]-0.0237[/C][C]0.490571[/C][/ROW]
[ROW][C]32[/C][C]-0.017538[/C][C]-0.1358[/C][C]0.446199[/C][/ROW]
[ROW][C]33[/C][C]0.042187[/C][C]0.3268[/C][C]0.372485[/C][/ROW]
[ROW][C]34[/C][C]-0.000682[/C][C]-0.0053[/C][C]0.497903[/C][/ROW]
[ROW][C]35[/C][C]-0.039592[/C][C]-0.3067[/C][C]0.380074[/C][/ROW]
[ROW][C]36[/C][C]-0.135937[/C][C]-1.053[/C][C]0.14829[/C][/ROW]
[ROW][C]37[/C][C]-0.068968[/C][C]-0.5342[/C][C]0.297581[/C][/ROW]
[ROW][C]38[/C][C]-0.013978[/C][C]-0.1083[/C][C]0.45707[/C][/ROW]
[ROW][C]39[/C][C]0.016171[/C][C]0.1253[/C][C]0.450368[/C][/ROW]
[ROW][C]40[/C][C]0.015934[/C][C]0.1234[/C][C]0.451091[/C][/ROW]
[ROW][C]41[/C][C]-0.012375[/C][C]-0.0959[/C][C]0.461976[/C][/ROW]
[ROW][C]42[/C][C]0.016968[/C][C]0.1314[/C][C]0.447936[/C][/ROW]
[ROW][C]43[/C][C]0.013188[/C][C]0.1022[/C][C]0.459487[/C][/ROW]
[ROW][C]44[/C][C]0.008662[/C][C]0.0671[/C][C]0.473364[/C][/ROW]
[ROW][C]45[/C][C]0.060364[/C][C]0.4676[/C][C]0.320889[/C][/ROW]
[ROW][C]46[/C][C]0.000381[/C][C]0.003[/C][C]0.498826[/C][/ROW]
[ROW][C]47[/C][C]-0.00619[/C][C]-0.048[/C][C]0.480957[/C][/ROW]
[ROW][C]48[/C][C]0.000418[/C][C]0.0032[/C][C]0.498715[/C][/ROW]
[/TABLE]
Source: https://freestatistics.org/blog/index.php?pk=295559&T=2

Globally Unique Identifier (entire table): ba.freestatistics.org/blog/index.php?pk=295559&T=2

As an alternative you can also use a QR Code:  

The GUIDs for individual cells are displayed in the table below:

Partial Autocorrelation Function
Time lag kPACF(k)T-STATP-value
10.953727.38750
2-0.063554-0.49230.312157
3-0.039598-0.30670.380058
40.0048920.03790.48495
5-0.020925-0.16210.435893
6-0.033044-0.2560.39943
7-0.044479-0.34450.365826
8-0.038897-0.30130.382116
9-0.006089-0.04720.481268
10-0.005636-0.04370.482663
11-0.043057-0.33350.369952
12-0.055934-0.43330.333189
13-0.065711-0.5090.306311
14-0.065311-0.50590.307392
15-0.065547-0.50770.306755
16-0.046413-0.35950.360236
170.0277680.21510.415214
18-0.011758-0.09110.463867
190.0005910.00460.498181
200.0174740.13540.446394
21-0.007834-0.06070.475907
220.009310.07210.471376
230.0021760.01690.493303
24-0.024779-0.19190.424219
25-0.059119-0.45790.324328
26-0.119473-0.92540.179224
27-0.028629-0.22180.412628
280.0019990.01550.493848
290.0210720.16320.435446
30-0.037428-0.28990.386439
31-0.003064-0.02370.490571
32-0.017538-0.13580.446199
330.0421870.32680.372485
34-0.000682-0.00530.497903
35-0.039592-0.30670.380074
36-0.135937-1.0530.14829
37-0.068968-0.53420.297581
38-0.013978-0.10830.45707
390.0161710.12530.450368
400.0159340.12340.451091
41-0.012375-0.09590.461976
420.0169680.13140.447936
430.0131880.10220.459487
440.0086620.06710.473364
450.0603640.46760.320889
460.0003810.0030.498826
47-0.00619-0.0480.480957
480.0004180.00320.498715


Parameters (Session):
par1 = 48 ; par2 = 1 ; par3 = 0 ; par4 = 0 ; par5 = 12 ; par6 = White Noise ; par7 = 0.95 ;
Parameters (R input):
par1 = 48 ; par2 = 1 ; par3 = 0 ; par4 = 0 ; par5 = 12 ; par6 = White Noise ; par7 = 0.95 ; par8 = ;
R code (references can be found in the software module):
if (par1 == 'Default') {
par1 = 10*log10(length(x))
} else {
par1 <- as.numeric(par1)
}
par2 <- as.numeric(par2)
par3 <- as.numeric(par3)
par4 <- as.numeric(par4)
par5 <- as.numeric(par5)
if (par6 == 'White Noise') par6 <- 'white' else par6 <- 'ma'
par7 <- as.numeric(par7)
if (par8 != '') par8 <- as.numeric(par8)
x <- na.omit(x)
ox <- x
if (par8 == '') {
if (par2 == 0) {
x <- log(x)
} else {
x <- (x ^ par2 - 1) / par2
}
} else {
x <- log(x,base=par8)
}
if (par3 > 0) x <- diff(x,lag=1,difference=par3)
if (par4 > 0) x <- diff(x,lag=par5,difference=par4)
bitmap(file='picts.png')
op <- par(mfrow=c(2,1))
plot(ox,type='l',main='Original Time Series',xlab='time',ylab='value')
if (par8=='') {
mytitle <- paste('Working Time Series (lambda=',par2,', d=',par3,', D=',par4,')',sep='')
mysub <- paste('(lambda=',par2,', d=',par3,', D=',par4,', CI=', par7, ', CI type=',par6,')',sep='')
} else {
mytitle <- paste('Working Time Series (base=',par8,', d=',par3,', D=',par4,')',sep='')
mysub <- paste('(base=',par8,', d=',par3,', D=',par4,', CI=', par7, ', CI type=',par6,')',sep='')
}
plot(x,type='l', main=mytitle,xlab='time',ylab='value')
par(op)
dev.off()
bitmap(file='pic1.png')
racf <- acf(x, par1, main='Autocorrelation', xlab='time lag', ylab='ACF', ci.type=par6, ci=par7, sub=mysub)
dev.off()
bitmap(file='pic2.png')
rpacf <- pacf(x,par1,main='Partial Autocorrelation',xlab='lags',ylab='PACF',sub=mysub)
dev.off()
(myacf <- c(racf$acf))
(mypacf <- c(rpacf$acf))
lengthx <- length(x)
sqrtn <- sqrt(lengthx)
load(file='createtable')
a<-table.start()
a<-table.row.start(a)
a<-table.element(a,'Autocorrelation Function',4,TRUE)
a<-table.row.end(a)
a<-table.row.start(a)
a<-table.element(a,'Time lag k',header=TRUE)
a<-table.element(a,hyperlink('basics.htm','ACF(k)','click here for more information about the Autocorrelation Function'),header=TRUE)
a<-table.element(a,'T-STAT',header=TRUE)
a<-table.element(a,'P-value',header=TRUE)
a<-table.row.end(a)
for (i in 2:(par1+1)) {
a<-table.row.start(a)
a<-table.element(a,i-1,header=TRUE)
a<-table.element(a,round(myacf[i],6))
mytstat <- myacf[i]*sqrtn
a<-table.element(a,round(mytstat,4))
a<-table.element(a,round(1-pt(abs(mytstat),lengthx),6))
a<-table.row.end(a)
}
a<-table.end(a)
table.save(a,file='mytable.tab')
a<-table.start()
a<-table.row.start(a)
a<-table.element(a,'Partial Autocorrelation Function',4,TRUE)
a<-table.row.end(a)
a<-table.row.start(a)
a<-table.element(a,'Time lag k',header=TRUE)
a<-table.element(a,hyperlink('basics.htm','PACF(k)','click here for more information about the Partial Autocorrelation Function'),header=TRUE)
a<-table.element(a,'T-STAT',header=TRUE)
a<-table.element(a,'P-value',header=TRUE)
a<-table.row.end(a)
for (i in 1:par1) {
a<-table.row.start(a)
a<-table.element(a,i,header=TRUE)
a<-table.element(a,round(mypacf[i],6))
mytstat <- mypacf[i]*sqrtn
a<-table.element(a,round(mytstat,4))
a<-table.element(a,round(1-pt(abs(mytstat),lengthx),6))
a<-table.row.end(a)
}
a<-table.end(a)
table.save(a,file='mytable1.tab')